Pragadeeshwaran Kannan 1; Gurugnanam Balasubramaniyan 1*; Suresh Mani 2; Bairavi Swaminathan 1; Bagyaraj Murugesan 1
1, Centre for Applied Geology, The Gandhigram Rural Institute (Deemed to be University), Gandhigram, Tamil Nadu, India.
2, Department of Civil Engineering, Jayalakshmi Institute of Technology, Thoppur, Tamil Nadu, India
E-mail:
gurugis4u@gmail.com
Received: 12/09/2025
Acceptance: 28/11/2025
Available Online: 29/11/2025
Published: 01/01/2026

Manuscript link
http://dx.doi.org/10.30493/DAS.2025.012911
Abstract
Groundwater is primarily used for drinking and irrigation in hard rock regions like Jambuduraikottai, Tamil Nadu. This study aimed to evaluate the suitability of groundwater sampled from the region for drinking and irrigation purposes. Twenty groundwater samples were collected, analyzed, and mapped using interpolation methods. Total hardness (TH), K+, Cl–, and F– exceed the not permissible limits in various locations. Piper and Gibbs plots indicated that water type is Ca2+-Mg2+-Cl–, which reveals rock dominance as a major factor affecting groundwater chemistry. Wilcox plot indicates that the majority of samples were suitable for irrigation purposes. The groundwater quality index showed that 90% of the samples are drinkable. Moreover, irrigation indices such the Kelly ratio and Sodium adsorption ratio indicate suitability for irrigation, whereas the Na% causes notable risk in 10% of the locations. Thus, proper measures such as regular monitoring and controlled usage of fertilizers must be taken to prevent further contamination and also for long-term usage.
Keywords: Groundwater quality, Water quality index, Irrigation suitability, Sodium percentage
Introduction
Groundwater is essential for agricultural, domestic, and industrial applications, particularly in semiarid areas where surface water is scarce. Consequently, groundwater is considered invaluable for supporting human health, ecological diversity, and economic development [1]. In India, especially in hard rock terrains like Tamil Nadu, groundwater quality is becoming worse due to geogenic and anthropogenic intrusions such as the uneducated use of chemicals in agriculture, over-extraction, and waste disposal [2][3]. The accelerated urbanization and industrial growth in the area underscore the need to further investigate the degradation of environmental resources, including groundwater [4].
The degradation of groundwater quality is a significant issue for drinking and irrigation due to elevated ion levels such as Fluoride, Nitrate, and Sodium, which can reduce soil productivity and pose significant health risks [5][6]. This issue is further exacerbated by the limited availability of groundwater resources in the region [7]. Therefore, concerted efforts are needed to evaluate groundwater quality, identify and model direct threats, classify water quality, and propose evidence-based management strategies.
In this context, hydrogeochemical methods provide valuable insights into the origin and evolution of groundwater chemistry by integrating aquifer lithology, water–rock interactions, and anthropogenic influences [8][9]. Other tools like the Water Quality Index (WQI) provide a composite score representing overall water quality. Moreover, graphical methods like Piper trilinear plots and Gibbs plots helps in interpreting hydrochemical facies and identify factors affecting groundwater chemistry [10][11]. Additionally, Geographic Information System (GIS) serves as an efficient tool for mapping and analyzing spatial datasets [12][13]. Consequently, previous studies showed the importance of combining physicochemical assessments with geospatial tools such as GIS and remote sensing to spatially map groundwater quality risk zones [14][15]. The use of remote sensing data and digital elevation models in GIS enabled the determination of the spatial distribution of the parameters [16].
Given the scarcity of groundwater resources and the urgent need to monitor and evaluate water quality, this study aims to assess groundwater quality in Jambuduraikottai (Nilakottai Taluk, Dindigul District, Tamil Nadu); a region where intensifying agricultural activity and growing reliance on groundwater for domestic use have raised concerns regarding water sustainability and contamination. This study employs a combined hydrochemical approach by integrating physicochemical analysis, statistical interpretation, geophysical survey, geographical mapping, irrigation suitability indicators, and suitability for drinking and irrigation.
Material and Methods
Study area
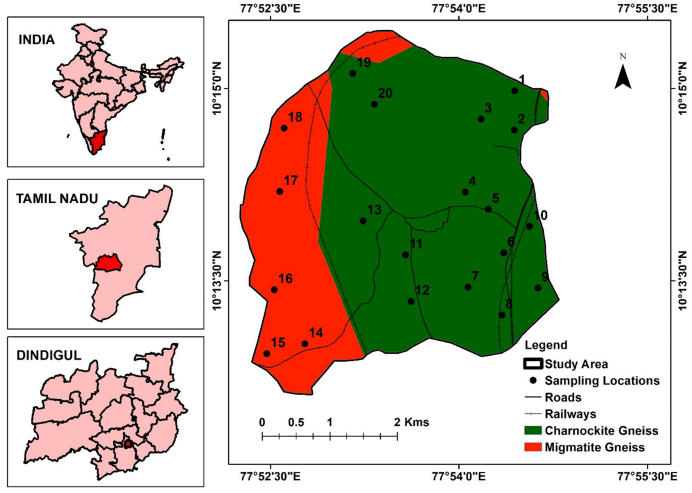
The Jambuduraikottai village is located in Nilakottai Taluk, Dindigul district, Tamil Nadu. The coordinates are 10°13’30ʺN – 10°15’0ʺN and 77°52’30ʺE – 77°55’30ʺE (Fig. 1). The study area is characterized by its agricultural landscape, and groundwater serves as a major source for drinking and irrigation purposes. The area’s geology comprises Southern Granulite Terrain, consisting of charnockite and migmatite gneissic complexes with minimal intrusions of pink granite and pegmatite [5]. The northeast monsoon accounts for a mean annual rainfall of 439 mm (October–December) [17]. April is the hottest month, and January is the coolest, with temperatures ranging from 29°C to 33°C [18].
Groundwater samples collection and analysis
During the post-monsoon season of 2024, groundwater samples were collected from Jambuduraikottai to assess physicochemical characteristics. 20 groundwater locations scattered across the area were sampled (Fig. 1). For this purpose, 1 L polypropylene bottles were washed 2–3 times with dilute HNO₃ followed by distilled water, and then used for water sample collection.
Handheld instruments including pH meter (Pen type ECO pH TEST 1-EUTECH 01X460901), Total Dissolved Solids (TDS) and Electrical Conductivity (EC) meter (TDS meter Pen type ECO TDS TEST-EUTECH) were used to measure pH, TDS, EC in the field.
Bottles were tightly sealed, transported to the lab, and stored at 4°C until analysis. Chemical parameters such as Ca2+, Mg2+, Cl–, CO3– and HCO3– levels were examined using volumetric titration with standard suggested procedures [19]. A flame photometer (Elico CL0378) was used to determine Na+, K+ concentrations and spectrometer (Elico SL 207 mini) was used to determine SO42- concentration. Fluoride was analyzed using a fluorimeter (Thermo Orion star A214 series ISE benchtop meter kit), and nitrate was analyzed using a nitrate electrode meter (Lmion-40). The following formula was used to determine the total hardness (TH) represented as CaCO3:
TH (represented as CaCO₃) = 2.497 × Ca²⁺ + 4.115 × Mg²⁺
The ionic balance error (IBE) was calculated and found to be within the acceptable range of ±10%, as shown in Equation:
IBE (%) = [(Σ Cations – Σ Anions) / (Σ Cations + Σ Anions)] × 100
Where:
Cations include: Ca²⁺, Mg²⁺, Na⁺, K⁺ concentrations (mq/L) Anions include: HCO₃⁻, Cl⁻, SO₄²⁻, NO₃⁻ concentrations (mq/L)
Groundwater Water Quality Index (GWQI)
The groundwater quality index was calculated using the weighted arithmetic index to evaluate water quality [20], a widely adopted and robust approach for site-specific water quality assessment.
For each parameter, the relative weight (Wi) was calculated using the equation:
Wᵢ = wᵢ ⁄ ∑ⁿᵢ₌₁wᵢ
The quality rating (qi) for every parameter was determined using the formula:
Qᵢ = [(Vᵢ – Videal) / (Vstandard – Videal)] × 100
Vi is the parameter’s observed value, Videal is the parameter’s ideal value, and VStandard is the permissible value of the parameter [21]. Every parameter is assigned a relative weight (Wi) based on its significance. The formula used to calculate the sub-index (Si) of each parameter is as follows:
Sᵢ = Wᵢ × qᵢ
The WQI is then calculated using the equation:
WQI = ∑Sᵢ / ∑Wᵢ
Where ∑Wi is the sum of all calculated relative weights, and ∑Si is the sum of all calculated sub-indices.
The WQI is divided into “Excellent < 50”, “Good 50 -100”, “Poor 100 – 200”, “Very Poor 200 – 300”, and “unsuitable for drinking > 300” to evaluate water quality [22].
Irrigation water quality indices
Kelly ratio (KR), sodium percentage (Na%), and sodium adsorption ratio (SAR), were used to determine irrigation suitability using the following equations:
KR = Na⁺ / (Ca²⁺ + Mg²⁺)
%Na = Na⁺ / (Ca²⁺ + Mg²⁺ + Na⁺ + K⁺)
SAR = Na⁺ / √((Ca²⁺ + Mg²⁺) / 2)
Taking into consideration that all cation concentrations are expressed in meq/L
Spatial analysis using inverse distance weighting
Among widely used spatial interpolation techniques, inverse distance weighting (IDW) is particularly valuable for assessing the spatial distribution of environmental variables, including groundwater quality, pollution levels, and contaminant dispersion [23]. IDW allows for estimating quantities at unmeasured sites using known values that fall within the proximity of unmeasured sites by giving larger weights to sites closest to the target location. This method has been widely used to trace the distribution of pollutants and to evaluate their potential health and environmental effects [24].
Statistical analysis
A comprehensive statistical analysis of groundwater parameters (including maximum, minimum, mean, and standard deviation) provided a detailed characterization of their variability and range.
Results and Discussion
Hydrogeochemical characteristics
The pH values varied from 6.50 to 7.80, indicating that none of the samples exceeds the most desirable limit (6.5-8.5) (Table 1). Similarly, none of the samples surpassed the most acceptable EC, limit since all samples recorded an EC ≤ 571 µS/cm. The TDS (117 to 571 mg/L) showed that none of the samples surpass the not permissible level; however, some samples exceeded most desirable limit (Table 1).
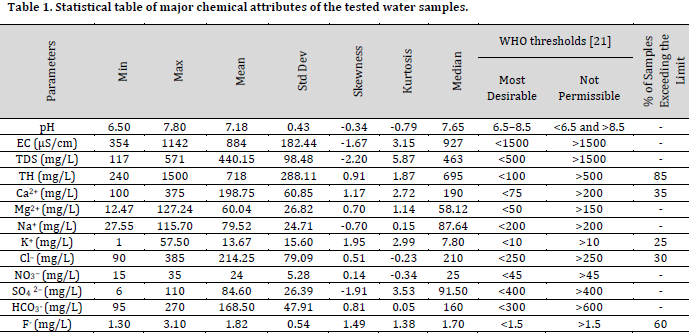
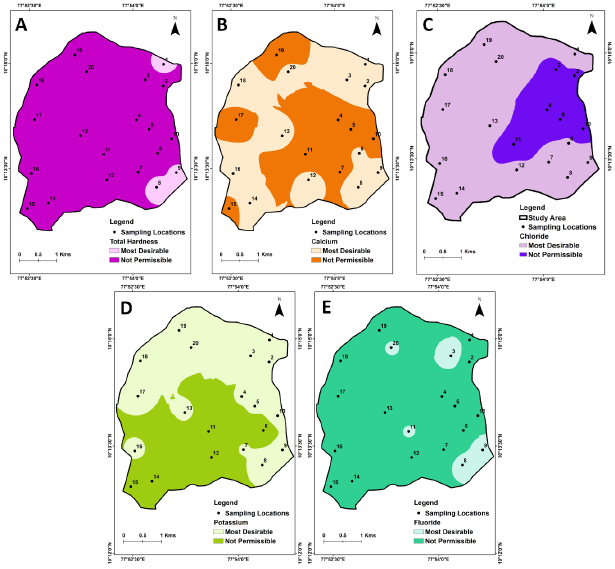
Total hardness (TH) ranged from 240 to 1500 mg/L as CaCO₃, with 85% of samples exceeding the permissible limit (500 mg/L) and the remaining 15% surpassing the desirable limit (100 mg/L) (Table 1 Fig. 2 A). The increased levels of TH are due to the weathering that happens in Ca2+-Mg2+ rich minerals such as feldspars, amphiboles and biotite present in charnockite and migmatite formations, which release Ca²⁺ and Mg²⁺ into groundwater [25].
The calcium ranged from 100 – 375 mg/L, with 35% samples exceed the not permissible limit (Table 1). The calcium spatial map (Fig. 2 B) indicates that most of the region exceeds the most desirable limit. Weathering of migmatite (formed under high-pressure and moderate-temperature conditions) releases feldspar, silica, pyroxenes, hornblende, hypersthene, and Ca²⁺, consistent with the study area’s charnockite to hornblende–biotite gneiss geology[26]. The magnesium ranged from 12.47 – 127.2 mg/L, indicating that none of the samples exceeded not permissible limit, whereas some surpassed most desirable limit (Table 1).
The sodium ranged from 27.5 to 115.70 mg/L, indicating that none of the samples exceed the not permissible limit (Table 1). On the other hand, 25% of the samples have potassium levels above the allowable threshold of 10 mg/L, with some surpassing this limit by up to fivefold (Table 1). The Potassium spatial map indicates that the south-western part and south-eastern region fall within non-permissible limit (Fig. 2 D). Agricultural fertilizers are the primary source of elevated potassium concentrations, particularly in the study area, where grape cultivation is widespread. Grapes require potassium-rich fertilizers for optimal growth, and heavy rainfall facilitates the leaching of potassium from these fertilizers into the groundwater [27]. Similarly, chloride varied from 90 to 385 mg/L, with 30% of samples exceed the most desirable limit (Table 1). The Chloride spatial map indicates that the south-eastern area exceeds the non-permissible limit (Fig. 2 C). Excessive use of fertilizers, such as potassium chloride, is a prominent source of chloride contamination in rural areas [28]. These fertilizers are carried into surface and groundwater due to runoff from irrigation and rainfall, thus raising chloride levels [29]. Since the nitrate and sulfate and bicarbonate ranged between 15 and 35 mg/L, 6 – 110 mg/L, and 95 – 270 mg/L, respectively, none of the samples fall within not permissible limit for these anions (Table 1). The Fluoride ranges from 1.30 – 3.10 mg/L, and 60% of the samples exceed the not permissible limit (Table 1 and Fig. 2 E). The weathering and dissolution of fluoride-containing minerals, including apatite, hornblende, mica, and biotite, present in charnockite and migmatite gneiss formation, elevate the fluoride concentration. Under prolonged rock-water interactions and slightly alkaline conditions, these Precambrian hard rocks release fluoride into the groundwater. Additionally, minimal calcium levels and long groundwater residence time increase fluoride enrichment [30][31].
Piper, Gibbs, and Wilcox plots for the collected groundwater samples
According to the piper trilinear plot (Fig. 3), the dominant water type is Ca2+-Mg2+-Cl–. In the cation plot, most samples fall in the category of calcium and no dominant type, revealing the predominance of Ca²⁺ and Mg²⁺ over Na⁺, K⁺. The anion plot indicates that most samples fall in the chloride category, suggesting ion-exchange processes due to rock-water interaction with minimal anthropogenic effects. Similar geochemical trends have been documented in Tamil Nadu’s hard-rock regions, where mineral dissolution and ion exchange influence groundwater quality [15][32].
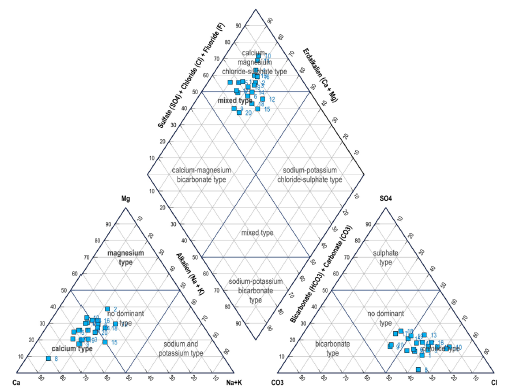
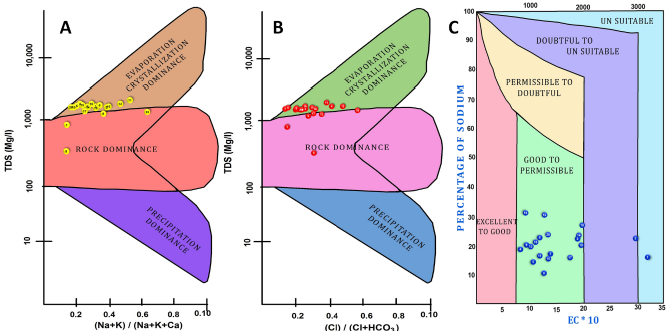
The Gibbs plot (Fig. 4 A and B) shows that silicate and carbonate weathering cause most samples to fall in the rock-dominance zone. A minimal number of samples shift towards evaporation-crystallization dominance is observed in high-TDS samples, suggesting possible localized evapotranspiration effects and aquifer salinization. Previous studies conducted in Tamil Nadu’s crystalline aquifer systems have reported comparable results [15][33-38]
Wilcox plot (Fig. 4 C) indicates that 90% samples fall in the Good-Permissible category, and the remaining 5% in Doubtful – Unsuitable, and 5% in the Unsuitable category. Such water resources may pose potential risks to salinity-sensitive crops and negatively affect nutrient availability and plant nutrition. These results are consistent with previous findings in Tamil Nadu’s hard rock regions [26][37][38].
Water Quality Index (WQI) and irrigation related indices
The WQI values ranged between 40 and 102, revealing that 80% of the samples fall under good water quality. In comparison, 15% were in Excellent water, and the remaining 5% in Poor water.
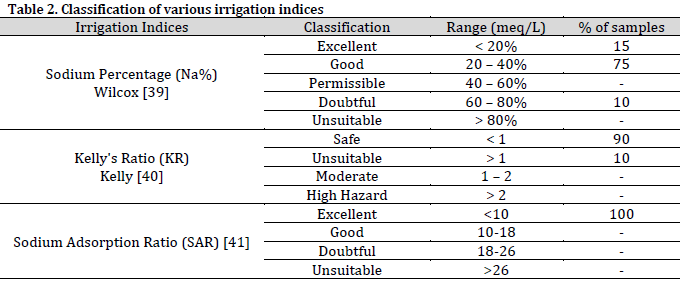
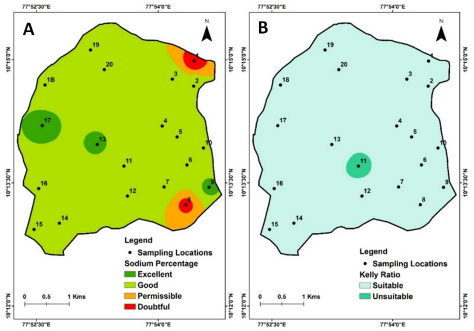
Sodium percentage index shows that 75% samples are in the Good category, and 15% in the Excellent category, indicating suitability for irrigation, and 10% in the doubtful category, indicating that caution is necessary due to possible sodium-related risks [39]. The spatial map of sodium percentage indicates that the northeastern and northern zones are classified as doubtful (Fig. 5 A).
Kelly’s ratio measures the degree of Sodium’s effect on irrigation water quality [40]. The result reveals that 90% of the samples are suitable, and the remaining 10% are in the unsuitable category, which might pose a significant cause (Table 2). The Kelly ratio’s spatial map indicates that the study area’s central part falls in an unsuitable category (Fig. 5 B).
The Sodium Adsorption Ratio (SAR) is determined based on the relative proportion of Sodium to calcium and magnesium and is used to evaluate its suitability for agricultural irrigation, particularly with respect to potential soil structural degradation[41]. The results indicate that 100% of samples fall in the Excellent category (Table 2)
Conclusions
It can be concluded that both geogenic factors such as water–rock interaction and mineral dissolution as well as anthropogenic activities such as the use of fertilizers and agricultural practices contribute to the qualities of groundwater in Jambuduraikottai region. The used analysis including Gibbs and Piper plots further confirm that Ca²⁺, Mg²⁺, and Cl⁻ are the primary factors controlling groundwater chemistry in the studies region. GWQI and irrigation indices reveal that the majority of groundwater samples are acceptable for drinking and irrigation, although sodium hazards (Na%) pose localized concerns. Hence, the study emphasizes regular groundwater monitoring and sustainable management to ensure long-term resource security in hard-rock terrains.
Conflict of interest statement
The authors declared no conflict of interest.
Funding statement
The authors declared that no funding was received in relation to this manuscript.
Data availability statement
The authors declared that the experimental data will be available upon reasonable request from the corresponding author.
References
- Arulbalaji P, Gurugnanam B. An integrated study to assess the groundwater potential zone using geospatial tool in Salem District, South India. J. Hydrogeol. Hydrol. Eng. 2016;7:2. DOI
- Panneerselvam B, Paramasivam SK, Karuppannan S, Ravichandran N, Selvaraj P. A GIS-based evaluation of hydrochemical characterisation of groundwater in hard rock region, South Tamil Nadu, India. Arabian J. Geosci. 2020;13(17):837. DOI
- Subramaniyan A, Elango L. Evaluating health risks from the release of trace elements to groundwater by rock-water interaction in a weathered gneissic aquifer. Environ. Sci. Pollut. Res. 2024;31(12):18962-81. DOI
- Arulbalaji P. Analysis of land use/land cover changes using geospatial techniques in Salem district, Tamil Nadu, South India. SN Appl. Sci. 2019;1(5):462. DOI
- Kom KP, Gurugnanam B, Sunitha V, Reddy YS, Kadam AK. Hydrogeochemical assessment of groundwater quality for drinking and irrigation purposes in western Coimbatore, South India. Int. J. Energy Water Resour. 2021;6(4):475-94. DOI
- Kom KP, Gurugnanam B, Bairavi S, Chidambaram S. Sources and geochemistry of high fluoride groundwater in hard rock aquifer of the semi-arid region. A special focus on human health risk assessment. Total Environ. Res. Themes. 2023;5:100026. DOI
- Arulbalaji P, Gurugnanam B. Evaluating the normalized difference vegetation index using landsat data by ENVI in salem district, Tamilnadu, India. Int. J. Dev. Res. 2014;4(9):1844-6.
- Ravikumar P, Somashekar RK, Angami M. Hydrochemistry and evaluation of groundwater suitability for irrigation and drinking purposes in the Markandeya River basin, Belgaum District, Karnataka State, India. Environ. Monit. Assess. 2010;173(1-4):459-87. DOI
- Srinivasamoorthy K, Chidambaram S, Prasanna MV, Vasanthavihar M, Peter J, Anandhan P. Identification of major sources controlling groundwater chemistry from a hard rock terrain — A case study from Mettur taluk, Salem district, Tamil Nadu, India. J. Earth Syst. Sci. 2008;117(1):49-58. DOI
- Subba Rao N, Sunitha B, Adimalla N, Chaudhary M. Quality criteria for groundwater use from a rural part of Wanaparthy District, Telangana State, India, through ionic spatial distribution (ISD), entropy water quality index (EWQI) and principal component analysis (PCA). Environ. Geochem. Health. 2019;42(2):579-99. DOI
- Karunanidhi D, Aravinthasamy P, Subramani T, Muthusankar G. Revealing drinking water quality issues and possible health risks based on water quality index (WQI) method in the Shanmuganadhi River basin of South India. Environ. Geochem. Health. 2020;43(2):931-48. DOI
- Nijagunappa R, Shekhar S, Gurugnanam B, Raju PLN, De P. Road network analysis of dehradun city using high resolution satellite data and gis. J. Indian Soc. Remote Sens. 2007;35(3):267-74. DOI
- Gurugnanam B, Prabhakharan N, Suvetha M, Vasudevan S, Gobu B. Geographic Information Technologies for Hydrogeomorphological Mapping in Parts of Vellar Basin, Central Tamil Nadu. J. Geol. Soc. India. 2008;72(4):471-8. DOI
- Nasiri Khiavi A, Kheirkhah Zarkesh MM, Ghermezcheshmeh B, Beyrami B. Mapping groundwater quality distribution in Northwest Iran: combining machine and deep learning and Borda scoring algorithms. Environ. Earth Sci. 2025;84(23):696. DOI
- Kinattinkara S, Arumugam T, Kuppusamy S, Krishnan M. Land use/land cover changes of Noyyal watershed in Coimbatore district, India, mapped using remote sensing techniques. Environ. Sci. Pollut. Res. 2022;29(57):86349-61. DOI
- Bagyaraj M, Ramkumar T, Venkatramanan S, Chung SY, Gurugnanam B. Assessment of soil erosion probability in Kodaikanal, India using GIS and remote sensing. Disaster Adv. 2014;7(2):36-49.
- Thangamani S, Raviraj A. Rainfall Variability and Trend Detection in Dindigul District of Amaravathi Basin. Current World Environment 2016;11(2):567-76. DOI
- Pavithrapriya S, Ramachandran A, Ahamedibrahim S, Palanivelu K. Climate variability trend and extreme indices for the Thanjavur Delta region of Tamil Nadu in South India. MAUSAM. 2022;73(2):237-50. DOI
- APHA. Standard Methods for the Examination of Water and Wastewater, 23rd ed. American Public Health Association, Washington, D.C. 2017.
- Tyagi S, Sharma B, Singh P, Dobhal R. Water Quality Assessment in Terms of Water Quality Index. American Journal of Water Resources 2020;1(3):34-8. DOI
- WHO. Guidelines for drinking-water quality: fourth edition incorporating first addendum, 4th ed., 1. World Health Organization, Geneva PP – Geneva. 2017.
- Al-Shammary SHE, Al-Mayyahi SOM. Groundwater quality assessment for drinking purposes using water quality index in Ali Al-Gharbi District, Iraq. J. Water Land Dev. 2021:274-80. DOI
- Zhou X, Sun J, Yi H, Ye T, Zhao Y, Yang Y, Liu Z, Liang C, Huang J, Chen J. Seasonal variations in groundwater chemistry and quality and associated health risks from domestic wells and crucial constraints in the Pearl River Delta. Environ. Sci. Process. Impacts. 2025;27(4):936-49. DOI
- Kom KP, Gurugnanam B, Sunitha V. Delineation of groundwater potential zones using GIS and AHP techniques in Coimbatore district, South India. Int. J. Energy Water Resour. 2022;8(1):85-109. DOI
- Chidambaram S, Bala Krishna Prasad M, Manivannan R, Karmegam U, Singaraja C, Anandhan P, Prasanna MV, Manikandan S. Environmental hydrogeochemistry and genesis of fluoride in groundwaters of Dindigul district, Tamilnadu (India). Environ. Earth Sci. 2012;68(2):333-42. DOI
- Pragadeeshwaran KR, Gurugnanam B, Bairavi S, et al (2023) Groundwater quality assessment (Post Monsoon, 2023) in Chinnalapatti Firka, Dindigul District, Tamil Nadu, India. Metszet J. 2023;9(5):338-58.
- Ciotta MN, Ceretta CA, Krug AV, Brunetto G, Nava G. Grape (Vitis vinifera L.) production and soil potassium forms in vineyard subjected to potassium fertilization. Rev. Bras. Frutic. 2021;43(1):e-682. DOI
- Buvaneshwari S, Riotte J, Sekhar M, Sharma AK, Helliwell R, Kumar MSM, Braun JJ, Ruiz L. Potash fertilizer promotes incipient salinization in groundwater irrigated semi-arid agriculture. Sci. Rep. 2020;10(1):3691. DOI
- Covaciu (Neamțu) DC, Balint AC, Neamțu CV, Moșneag SC, Bordea D, Dîrjan S, Odagiu ACM. Assessment of Groundwater Quality in Relation to Organic versus Mineral Fertilization. Water. 2023;15(16):2895. DOI
- Brindha K, Elango L. Fluoride in groundwater: causes, implications and mitigation measures. In: Fluoride properties, applications and environmental management. 2011;1:111-36.
- Karunanidhi D, Aravinthasamy P, Subramani T, Roy PD, Srinivasamoorthy K. Risk of Fluoride-Rich Groundwater on Human Health: Remediation Through Managed Aquifer Recharge in a Hard Rock Terrain, South India. Nat. Resour. Res. 2019;29(4):2369-95. DOI
- Gowrisankar G, Jagadeshan G, Elango L. Managed aquifer recharge by a check dam to improve the quality of fluoride-rich groundwater: a case study from southern India. Environ. Monit. Assess. 2017;189(4):200. DOI
- Lakshmanan E, Kannan R, Senthil Kumar M. Major ion chemistry and identification of hydrogeochemical processes of ground water in a part of Kancheepuram district, Tamil Nadu, India. Environ. Geosci. 2003;10(4):157-66. DOI
- Shaikh H, Gaikwad H, Kadam A, Umrikar B. Hydrogeochemical characterization of groundwater from semiarid region of western India for drinking and agricultural purposes with special reference to water quality index and potential health risks assessment. Appl. Water Sci. 2020;10(9):204. DOI
- Subramani T, Elango L, Damodarasamy SR. Groundwater quality and its suitability for drinking and agricultural use in Chithar River Basin, Tamil Nadu, India. Environ. Geol. 2005;47(8):1099-110. DOI
- Ravi R, Aravindan S, Shankar K, Balamurugan P. Suitability of groundwater quality for irrigation in and around the main Gadilam river basin on the east coast of southern India. Arch. Agric. Environ. Sci. 2020;5(4):554-62. DOI
- Kalaivanan K, Gurugnanam B, Pourghasemi HR, Suresh M, Kumaravel S. Spatial assessment of groundwater quality using water quality index and hydrochemical indices in the Kodavanar sub-basin, Tamil Nadu, India. Sustain. Water Resour. Manag. 2017;4(3):627-41. DOI
- Kannan P, Balasubramaniyan G, Karuppannan S, Swaminathan B, Sam SC, Murugesan B. Groundwater quality beyond potability: decoding the hydrogeochemical signatures using spatial and statistical methods in regions of Dindigul District, Tamil Nadu. Discov. Sustain. 2025;6(1):784. DOI
- Wilcox LV. The quality of water for irrigation use. Tech. Bull. 1948;962
- Kelley WP. Adsorbed Na+, Cation-Exchange Capacity and Percentage Na+ Saturation of Alkali Soils. Soil Sci. 1957;84(6):473-8. DOI
- Richards LA. Diagnosis and improvement of saline and alkali soils. US Government Printing Office. 1954.
Cite this article:
Kannan P., Balasubramaniyan G., Mani S., Swaminathan B., Murugesan B.. Hydrogeochemical assessment and suitability evaluation of groundwater in a hard rock region: A case study of Jambuduraikottai, Tamil Nadu. DYSONA-Applied Science. 2026;7(1):142-151.. doi: 10.30493/das.2025.012911