Seemal Naeem 1*; Syed Amer Mehmood 1
1, Department of Space Science, University of the Punjab, Lahore, Pakistan
E-mail:
seemalnaeem945@gmail.com
Received: 08/09/2025
Acceptance: 23/10/2025
Available Online: 25/10/2025
Published: 01/01/2026

Manuscript link
http://dx.doi.org/10.30493/DAS.2025.545963
Abstract
Anthropogenic activities have significantly changed land use and land cover (LULC), especially in areas with significant population expansion. In this study, the spatiotemporal dynamics of LULC and Land Surface Temperature (LST) of Multan were monitored. The research was carried out for the years 2001, 2011, and 2020 using Landsat-5 TM and Landsat-8 OLI images. While the dataset concludes in 2020, the observed patterns offer a critical long-term baseline for assessing ongoing urbanization and food security risks in the region. The urban area has expanded by 3.23%, whereas forest and vegetation areas have decreased by 4.31% and 9.8%, respectively. Additionally, a weak relationship with between LST and NDVI was observed, whereas a more significant relationship was noted with NDBI. Standardized Precipitation Index (SPI) and Reconnaissance Drought Index (RDI) indices were computed using climatological data to observe the drought status. A consistent drying trend was evident in both indices, highlighting a progressive increase in drought severity over the study period. The study findings highlight the influence of rapid population increase as the primary factor driving urban food insecurity and climate change in the study area.
Keywords: LULC, Land surface temperature, Drought, Urbanization, Multan
Introduction
During the last few years, Land Use and Land Cover (LULC) mapping has become a vital tool in environmental and landscape studies, offering critical insights into the drivers and consequences of global environmental change [1]. Shaped by the interplay between natural processes and anthropogenic activities, LULC dynamics have become a key contributor to landscape transformation worldwide. While land cover refers to the physical cover of Earth’s surface, such as forests, agricultural fields, and water bodies [2], land use denotes the human utilization of land, including urban development, agriculture, recreation, and conservation [3]. Rapid urbanization and population growth have significantly accelerated LULC changes, often leading to habitat fragmentation, loss of arable land, and altered microclimatic conditions [4].
Remote sensing (RS) and geographic information systems (GIS) have proven indispensable in monitoring and analyzing the spatial and temporal dynamics of LULC [5]. RS provides high-resolution, multi-temporal data essential for detecting land surface patterns. On the other hand, the integration, visualization, and spatial analysis of these patterns across diverse geographic scales is enabled through GIS [6]. Among the most widely used RS-derived indices, the Normalized Difference Vegetation Index (NDVI) has played a pivotal role in assessing vegetation health, estimating crop yields, and optimizing agricultural practices globally [7]. NDVI exhibits strong sensitivity to climatic variables such as precipitation, temperature, and elevation [8]. Studies showed that the autumn season offers optimal conditions for observing NDVI responses to rainfall and temperature fluctuations [9]. Notably, NDVI curves demonstrate rapid increases following significant rainfall events, particularly during the transition from initial vegetation growth to peak biomass accumulation [10][11].
Land Surface Temperature (LST) is the radiative skin temperature of the Earth’s surface as observed from satellite sensors [12]. LST serves as a key indicator of surface energy balance and urban thermal behavior. Urban areas often exhibit pronounced spatial heterogeneity in LST, typically increasing from vegetated suburban zones toward densely built-up city centers. This gradient is largely governed by the proportion of impervious surfaces and the spatial configuration of green infrastructure. Recent studies underscore a robust relationship between LULC changes and LST variations, mediated through biophysical indices such as NDVI and the Normalized Difference Built-up Index (NDBI) [7]. While NDVI reflects vegetation density and health, NDBI effectively captures the extent of urbanization and impervious surface coverage, both of which significantly influence sensible heat flux and surface warming [13]. Consequently, the integrated analysis of NDVI, NDBI, and LST provides a powerful framework for understanding the environmental implications of urban expansion and land transformation.
Considering the previously mentioned debates, this research investigates the spatiotemporal dynamics of Land Use/Land Cover (LULC) and Land Surface Temperature (LST) in Multan, Pakistan, during the period from 2001 to 2020 in order to understand the influence of rapid urbanization on the local landscape and surface thermal patterns.
Materials and Methods
Area of research
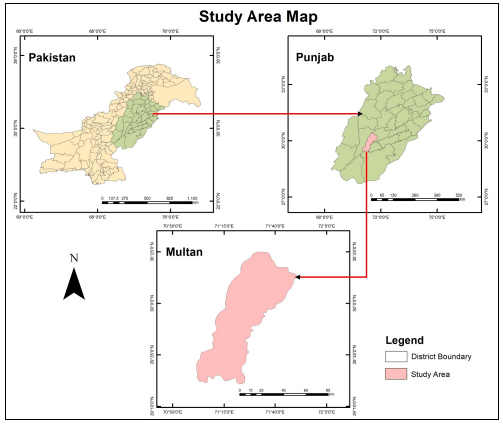
Multan district is located in the southern part of the Punjab province, Pakistan (Fig. 1). It lies between (29° 19’ 11’’ – 30° 28’ 16’’) latitude and (70° 58’ 34’’ – 71° 43’ 25’’) longitude. Multan is geographically located in the country’s center, with an average elevation of 122 m above sea level. The district consists of four tehsils (counties): Multan Cantonment, Multan Saddar, Shujabad, and Jalalpur Pirwala. The Chenab River borders the district to the west, and the adjacent tehsils of Multan Saddar and Shujabad are particularly prone to seasonal flooding during the monsoon period due to their proximity to the river.
Data
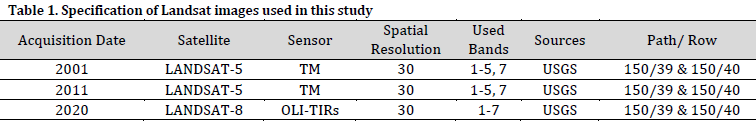
For the geospatial analysis of LULC in Multan district, the satellite imagery of Landsat-5 and Landsat-8 OLI–TIRS was downloaded from Earth Explorer USGS. Further details of the data are provided as seen in Table 1.
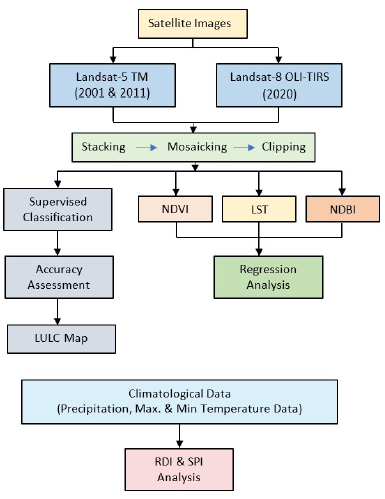
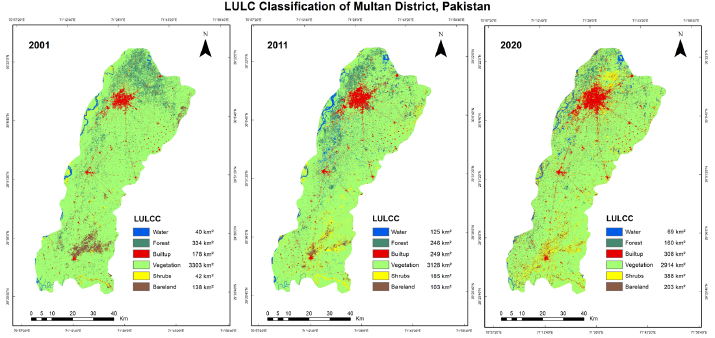
Preprocessing of data was carried out using ArcMap 10.8. This process included band composite, mosaicking, and sub-setting of images. Then, maximum likelihood classification algorithm was used as a supervised classification method to acquire the LULC classes (Fig. 2). This algorithm is commonly used with average-resolution satellite imagery [14].
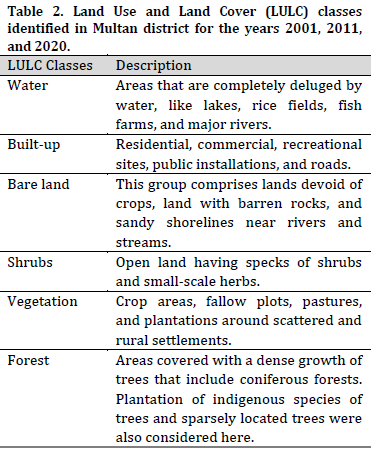
LULC classes
Classes were delineated based on discernible differences in color, texture, and tone [15] (Table 2). To support this classification, spectral samples were extracted from the dataset using various band combinations to generate a signature file, which facilitated the identification and characterization of the tonal properties associated with each class.
Result and Discussion
Accuracy assessment
The land use/land cover (LULC) classification map was generated using the maximum likelihood classification algorithm (Fig. 3). To ensure the reliability of the resulting map, an accuracy assessment was conducted, as it constitutes a critical step in evaluating the performance of image-based classification methods [16].
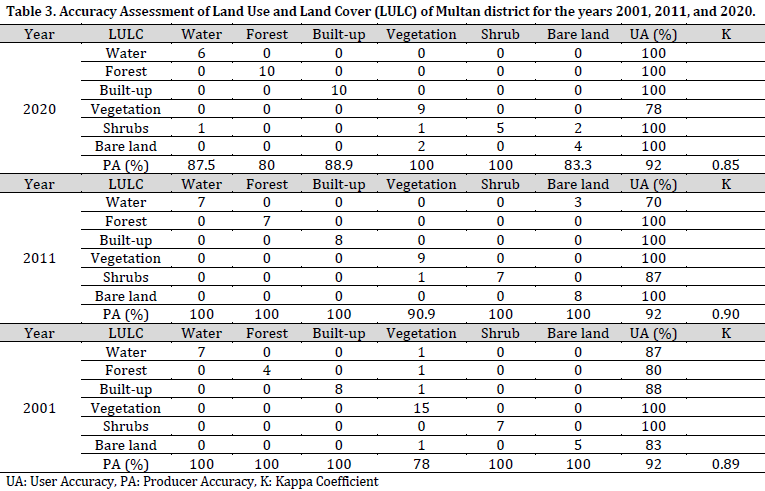
The Kappa statistic was employed to cross-validate the classification assessments. For each year, 110 random sample points were extracted to compute both producer’s and user’s accuracy. The Kappa coefficient enables the differentiation between classifications that are accurate by chance and those that reflect genuine agreement, thereby accounting for the expected level of random accuracy. It thus provides a more robust measure of overall classification accuracy by adjusting for chance agreement [17].

The overall accuracy of the 2020 classified image was 88%, while the classifications for 2011 and 2001 achieved higher overall accuracies of 92%. Thus, within the study area, the overall classification accuracy ranged from 88% to 92% (Table 3). Therefore, the acquired accuracy is acceptable for the purpose of this manuscript compared to other studies in this field [18].
Variation in LULC classes
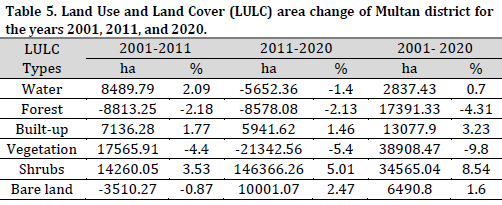
Effective monitoring and management of the Earth’s environmental resources necessitate thorough investigation into land cover dynamics through change detection. Such analyses are crucial for understanding the impacts of human activities on environmental systems [2]. Comparative classification results revealed notable changes in land use/land cover (LULC) classes in Multan district over time (Table 4).

Forest areas were reduced from 2001 to 2020 by a substantial amount of 8.27% to 3.96%. Vegetation area declined from 81.8% in 2001 to 72.0% in 2020. An apparent upsurge in the shrub area class and urban area class is noticeable, while bare land increases from 3.43% to 5.03%. Overall, there was a 4.31% and 9.8% reduction in forest and vegetation cover between 200 and 2020. On the other hand, 3.32% increase in urban and built-up areas was observed during the same period, reflecting growing demand for housing and accelerated urbanization pressures (Table 5).
According to research [19], the primary drivers behind the decline in vegetation cover—and its subsequent conversion to arid or agricultural land—include population growth and poverty. Additionally, reports indicate that the proliferation of housing developments has significantly contributed to urban expansion [20], which in turn has led to a reduction in both vegetated areas and water bodies. Additionally, increase in impervious surfaces associated with urbanization has amplified surface runoff, intensifying soil erosion [21] and endangering agricultural production and natural ecosystems.
Normalized Difference Built-up Index (NDBI)
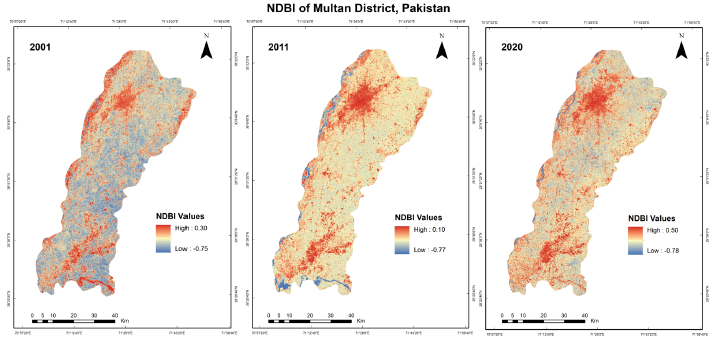
The Normalized Difference Built-up Index (NDBI) values exhibited a notable temporal shift, ranging from -0.75 to 0.30 in 2001, -0.77 to 0.10 in 2011, and reaching a maximum of 0.50 in 2020. This trend reflects a significant transformation in land surface characteristics over the study period. Compared to 2011, the spatial extent of built-up and barren rock areas increased markedly by 2020. The relatively high NDBI values observed in 2001 are attributed to extensive barren land cover, much of which was subsequently converted to urbanized (built-up) areas (Fig. 4).
In general, pixels classified as built-up, particularly in central metropolitan zones, are dominated by impervious surfaces, often interspersed with limited vegetation [22]. Such surfaces, along with bare ground, typically exhibit minimal vegetation cover and low soil moisture, leading to pronounced sensible heat exchange and contributing to localized thermal anomalies [23].
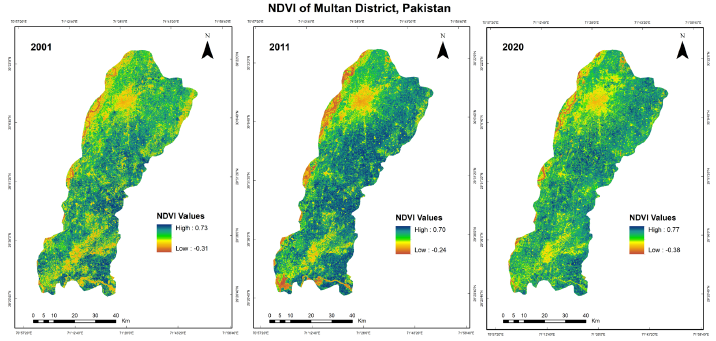
Normalized Difference Vegetation Index (NDVI)
The Normalized Difference Vegetation Index (NDVI) is a widely used remote sensing metric that enables the comparative assessment of vegetation density, biomass, and greenness across satellite images [24]. In the present study, the most robust and healthiest vegetative cover was observed in 2001. The NDVI values ranged from –0.31 to 0.73 in 2001, –0.24 to 0.70 in 2011, and –0.38 to 0.77 in 2020 (Fig. 5). Higher NDVI values correspond to densely vegetated and photosynthetically active areas, whereas lower values typically represent non-vegetated or minimally vegetated areas, such as bare soil, urbanized zones, or water bodies [25].
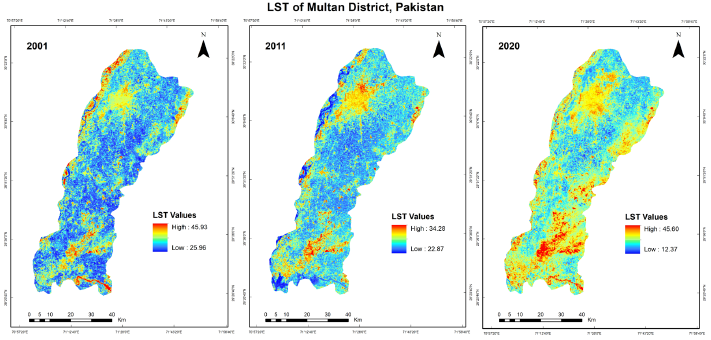
Land Surface Temperature (LST)
The average land surface temperature (LST) in 2001 was 35.94°C, with a range of 25.96°C to 45.93°C. By 2011, the LST range had shifted to 22.87°C–34.28°C, and in 2020, it exhibited a broader span of 12.37°C to 45.60°C (Fig. 6). LST is influenced by multiple environmental factors, including soil moisture, solar insolation, wind speed, and precipitation [26]. When compared with the land use/land cover (LULC) maps for the period 2001–2020, the highest LST values were consistently associated with built-up areas, reflecting the thermal characteristics of impervious surfaces. In contrast, agricultural lands consistently recorded the lowest LST values, suggesting their potential role in mitigating urban heat through evaporative cooling and shading effects.
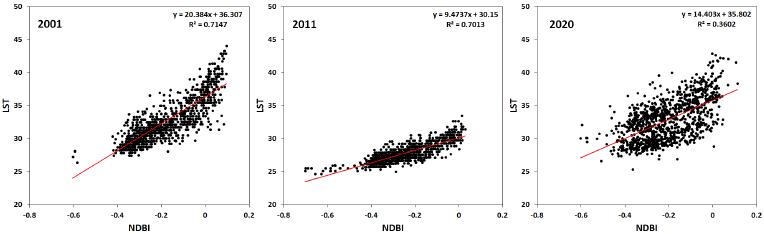
Relationship between NDVI and LST
Scatter plots for 2001, 2011, and 2020 reveal a weak negative correlation between the Normalized Difference Vegetation Index (NDVI) and Land Surface Temperature (LST): as NDVI values increase, LST tends to decrease, and vice versa. This inverse relationship is particularly evident in developed areas, where sparse vegetation results in low NDVI values and coincides with the highest recorded LST. The most pronounced negative relationship between LST and NDVI was observed in 2001 (R2=0.62) (Fig. 7).
Overall, LST and NDVI serve as complementary and effective indicators for assessing thermal patterns across the study region, with NDVI providing critical support for interpreting vegetation–temperature dynamics. LST is governed by soil thermal properties, particle density, and moisture content, whereas NDVI is influenced by leaf structure and the physiochemical characteristics of vegetation [2].

Relationship between NDBI and LST
Land Surface Temperature (LST) and the Normalized Difference Built-up Index (NDBI) exhibit a strong positive linear relationship (Fig. 8). Higher NDBI values, indicative of built-up and barren land surfaces, are closely associated with elevated LST, reflecting the thermal properties of impervious materials commonly found in urban and non-vegetated areas. In contrast, vegetated regions display more stable and lower temperature profiles, suggesting that the observed spatial variability in LST is largely driven by the extent and composition of built-up land cover [27].
It is worth noting that the positive relation between LST and NDBI was stronger than the negative relation observed between LST and NDVI. This asymmetry can be attributed to the distinct thermal characteristics of land cover types: built-up surfaces consistently absorb and retain heat, acting as strong and stable drivers of elevated surface temperatures. In contrast, while vegetation exerts a cooling influence through evapotranspiration and shading, this effect is often moderated by ecological and environmental factors such as water availability, phenological stage, and vegetation density. Consequently, the thermal signal of urban/built-up areas tends to exhibit greater consistency and intensity, leading to a stronger statistical correlation between LST and NDBI compared to the more variable and context-dependent LST–NDVI relationship.
Reconnaissance Drought Index (RDI) and the Standardized Precipitation Index (SPI)
As revealed by the land use/land cover (LULC) analysis, rapid expansion of settlement areas has occurred at the expense of agricultural land, contributing to heightened risks of climate change and food insecurity. Such land cover transformations are associated with a range of adverse environmental and socio-economic impacts, including accelerated soil erosion, rural–urban migration, fragmentation of agricultural holdings, increased climate variability, and declining crop productivity [28].
Among the most detrimental natural phenomena affecting agricultural systems is drought, which arises from prolonged deficits in precipitation over extensive regions [29]. Drought significantly reduces water availability for crops, leading to diminished yields and exacerbating food insecurity. To monitor and assess drought conditions, numerous indices have been developed globally. In this study, two widely used indices, the Reconnaissance Drought Index (RDI) and the Standardized Precipitation Index (SPI), were employed. The SPI, in particular, is favored in agricultural contexts due to its simplicity, computational efficiency, and strong correlation with soil moisture conditions.
Monthly minimum and maximum temperature and rainfall data spanning 2001 to 2020 were sourced from the Climatology Lab (www.climatologylab.org). These data were subsequently processed using DrinC 1.7 software to compute both SPI and RDI values, enabling a robust temporal analysis of drought severity and frequency in the study area.
The Standardized Precipitation Index (SPI) is computationally efficient and requires only precipitation data. It is derived by subtracting the long-term mean precipitation from the observed precipitation for a given period and then dividing the result by the standard deviation (or root-mean-square deviation) of the precipitation series, yielding a normalized index that reflects deviations from average conditions in standard deviation units.

Pij: ith gauge site periodic rainfall and jth observation
P: long-standing periodic mean
σ: standard deviation
The Reconnaissance Drought Index (RDI) constructs a cumulative frequency distribution by first arranging long-term monthly rainfall totals in ascending order. This distribution is then partitioned into ten equal intervals, known as deciles. The lowest 10% of rainfall values constitute the first decile, the next 10% (10–20%) form the second decile, and so forth. These deciles serve as a reference framework for evaluating and interpreting current or past monthly rainfall amounts relative to historical conditions [30]. The drought assessment is subsequently based on the following equation:
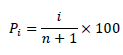
Pi: the possibility of rainfall in the rated number ith
n: number of precipitation records
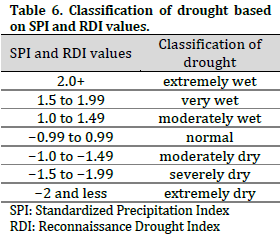
Drought conditions are classified according to SPI and RDI indices, with classes ranging from extremely wet (≥ 2.0) to extremely dry (≤ -2.0) (Table 6).
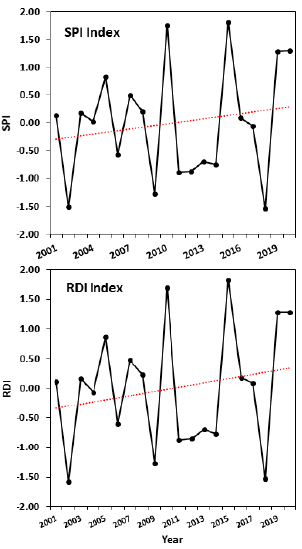
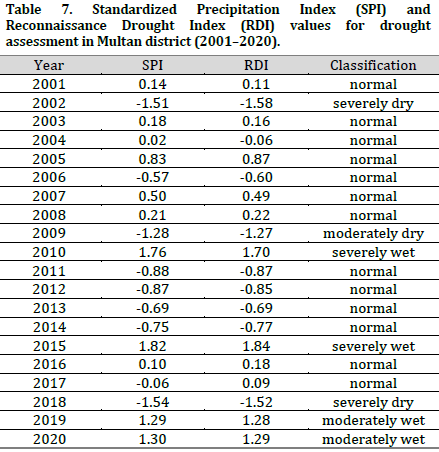
RDI and SPI values were computed for a 12-month time scale, revealing severe drought conditions in 2002 and 2018, and a moderate drought in 2009. Normal hydroclimatic conditions prevailed in 13 of the 20 years analyzed—specifically 2001, 2003–2008, 2011–2014, 2016, and 2017. Moderately wet conditions were observed in 2019 and 2020, while 2010 and 2015 were characterized by severe wet conditions (Fig. 9 and table 7). Urban expansion and sharp declines in forest/vegetation cover coincide with a long-term drying trend (rising SPI/RDI), suggesting land-use change is worsening drought vulnerability. Loss of natural cover reduces water retention and climate resilience, amplifying the impacts of climatic aridity. Integrated land and water management is urgently needed.
Conclusion
This study reveals significant changes in land use/land cover (LULC) classes in Multan district between 2001 and 2020. Forest and vegetation area declined by 4.31% and 9.8%, respectively. On the other hand, urbanization pressures and growing demand for housing led to a 3.32% increase in urban and built-up areas. NDVI and NDBI values showed notable changes overtime. Similarly, LST values consistently shifted between 2001 and 2020, with built-up areas having the highest values, while agricultural lands recorded the lowest values. NDBI exhibited a strong positive linear relationship with LST, wherein higher NDBI values are associated with elevated surface temperatures. To assess hydroclimatic stress, the study employed the Reconnaissance Drought Index (RDI) and the Standardized Precipitation Index (SPI). Both indices revealed a gradual but consistent decline in wetting trends over the study period, underscoring a growing drought risk. These findings highlight the urgent need for integrated land and water management strategies to mitigate the adverse impacts of urban expansion, rising temperatures, and increasing aridity on ecosystem resilience and food security.
Conflict of interest statement
The authors declared no conflict of interest.
Funding statement
The authors declared that no funding was received in relation to this manuscript.
Data availability statement
The authors declared that all used data and data sources are mentioned in the manuscript. the used datasets will be available upon reasonable request from the corresponding author.
References
- Gao Y, Zhang W. LULC Classification and Topographic Correction of Landsat-7 ETM+ Imagery in the Yangjia River Watershed: the Influence of DEM Resolution. Sensors. 2009;9(3):1980-95. DOI
- Hussain S, Mubeen M, Akram W, Ahmad A, Habib-ur-Rahman M, Ghaffar A, Amin A, Awais M, Farid HU, Farooq A. Study of land cover/land use changes using RS and GIS: a case study of Multan district, Pakistan. Environ. Monit. Assess. 2019;192(1):2. DOI
- Reis S. Analyzing Land Use/Land Cover Changes Using Remote Sensing and GIS in Rize, North-East Turkey. Sensors. 2008;8(10):6188-202. DOI
- Sadiq Khan M, Ullah S, Sun T, Rehman A, Chen L. Land-Use/Land-Cover Changes and Its Contribution to Urban Heat Island: A Case Study of Islamabad, Pakistan. Sustainability. 2020;12(9):3861. DOI
- Dewan AM, Yamaguchi Y. Land use and land cover change in Greater Dhaka, Bangladesh: Using remote sensing to promote sustainable urbanization. Appl. Geogr. 2009;29(3):390-401. DOI
- Zhang B, Yao Y, Cheng W, Zhou C, Lu Z, Chen X, Alshir K, ErDowlet I, Zhang L, Shi Q. Human-Induced Changes to Biodiversity and Alpine Pastureland in the Bayanbulak Region of the East Tienshan Mountains. Mountain Res. Dev. 2002;22(4):383-9. DOI
- Chaudhuri G, Mishra NB. Spatio-temporal dynamics of land cover and land surface temperature in Ganges-Brahmaputra delta: A comparative analysis between India and Bangladesh. Appl. Geogr. 2016;68:68-83. DOI
- Campo-Bescós MA, Muñoz-Carpena R, Kaplan DA, Southworth J, Zhu L, Waylen PR. Beyond Precipitation: Physiographic Gradients Dictate the Relative Importance of Environmental Drivers on Savanna Vegetation. PLoS One. 2013;8(8):e72348. DOI
- Cui L, Shi J. Temporal and spatial response of vegetation NDVI to temperature and precipitation in eastern China. J. Geogr. Sci 2010;20(2):163-76. DOI
- Wang J, Rich PM, Price KP. Temporal responses of NDVI to precipitation and temperature in the central Great Plains, USA. Int. J. Remote Sens. 2003;24(11):2345-64. DOI
- Yuan X, Li L, Chen X, Shi H. Effects of Precipitation Intensity and Temperature on NDVI-Based Grass Change over Northern China during the Period from 1982 to 2011. Remote Sens. 2015;7(8):10164-83. DOI
- John J, Chithra NR, Thampi SG. Assessment of land surface temperature dynamics over the Bharathapuzha River Basin, India. Acta Geophys. 2021;69(3):855-76. DOI
- Li H, Liu Q. Comparison of NDBI and NDVI as indicators of surface urban heat island effect in MODIS imagery. In Proceedings of the Earth Observation Data Processing and Analysis Conference. SPIE. 2008:728503. DOI
- Raj S, Rawat KS, Tripathi VK. Multi-Temporal Image Processing for LULC Classification and Change Detection. Environment and Ecology 2024;42(3B):1349-57. DOI
- Radhakrishnan N, Eerni SK, Kumar S. Analysis of Urban Sprawl Pattern in Tiruchirappalli City Using Applications of Remote Sensing and GIS. Arab. J. Sci. Eng. 2014;39(7):5555-63. DOI
- Owojori A, Xie H. Landsat image-based LULC changes of San Antonio, Texas using advanced atmospheric correction and object-oriented image analysis approaches. In 5th international symposium on remote sensing of urban areas. Tempe, AZ. 2005.
- Bokhari SA, Saqib Z, Amir S, Naseer S, Shafiq M, Ali A, Zaman-ul-Haq M, Irshad A, Hamam H. Assessing Land Cover Transformation for Urban Environmental Sustainability through Satellite Sensing. Sustainability. 2022;14(5):2810. DOI
- Usman M, Liedl R, Shahid MA, Abbas A. Land use/land cover classification and its change detection using multi-temporal MODIS NDVI data. J. Geogr. Sci 2015;25(12):1479-506. DOI
- Mather AS, Needle CL. The relationships of population and forest trends. Geogr. J. 2000;166(1):2-13. DOI
- Fareed N, Ghaffar A, Malik T. Spatio-Temporal Extension and Spatial Analyses of Dengue from Rawalpindi, Islamabad and Swat during 2010–2014. Climate. 2016;4(2):23. DOI
- Bashir H, Ahmad SS. Exploring geospatial techniques for spatiotemporal change detection in land cover dynamics along Soan River, Pakistan. Environ. Monit. Assess. 2017;189(5):222. DOI
- Xu R, Liu J, Xu J. Extraction of High-Precision Urban Impervious Surfaces from Sentinel-2 Multispectral Imagery via Modified Linear Spectral Mixture Analysis. Sensors. 2018;18(9):2873. DOI
- Zhang Y, Odeh IO, Han C. Bi-temporal characterization of land surface temperature in relation to impervious surface area, NDVI and NDBI, using a sub-pixel image analysis. Int. J. Appl. Earth Obs. Geoinf. 2009;11(4):256-64. DOI
- Kumar BP, Babu KR, Anusha B, Rajasekhar M. Geo-environmental monitoring and assessment of land degradation and desertification in the semi-arid regions using Landsat 8 OLI / TIRS, LST, and NDVI approach. Environ. Challenges. 2022;8:100578. DOI
- Nadeem B. Urban Expansion and Remote Sensing Techniques: An Assessment of Multan City during 2008-2018. Journal of Development and Social Sciences 2021;2(III):440-50. DOI
- Wang R, Hou H, Murayama Y, Derdouri A. Spatiotemporal Analysis of Land Use/Cover Patterns and Their Relationship with Land Surface Temperature in Nanjing, China. Remote Sens. 2020;12(3):440. DOI
- Macarof P, Statescu F. Comparasion of NDBI and NDVI as Indicators of Surface Urban Heat Island Effect in Landsat 8 Imagery: A Case Study of Iasi. Present Environment and Sustainable Development 2017;11(2):141-50. DOI
- Agidew AA, Singh KN. The implications of land use and land cover changes for rural household food insecurity in the Northeastern highlands of Ethiopia: the case of the Teleyayen sub-watershed. Agric. Food Secur. 2017;6(1):56. DOI
- Buttafuoco G, Caloiero T, Guagliardi I, Ricca N. Drought assessment using the reconnaissance drought index (RDI) in a southern Italy region. In Proceedings of the 6th IMEKO TC19 Symposium on Environmental Instrumentation and Measurements, Reggio Calabria, Italy. 2016:24-5.
- Atiem IA, Siddig MSA, Hamukwaya SL, Ahmed HI, Taha MMM, Ibrahim S, Osman Y. Assessment of Seasonal Rainfall Drought Indices, Nyala City Sudan. Agriculture. 2022;12(7):1069. DOI
Cite this article:
Naeem, S., Mahmood, S. A. Exploring the nexus between LULC transformation, land surface temperature, and drought in a rapidly urbanizing landscape: The case of Multan. DYSONA – Applied Science, 2026; 7(1): 98-109. doi: 10.30493/das.2025.545963