Hassan Ait Naceur 1*; Farid El Wahidi 1; Youssef Lassiane 1; Hoda Benazun 1; Ali Maged 2,3; Muhammad Rashid 4
1, Laboratory of Georesources, Geoenvironment and Civil Engineering (L3G), Faculty of Sciences and Techniques, Cadi Ayyad University, Marrakech, Morocco
2, Geology Department, Faculty of Science, Suez University, 43221, Suez, Egypt
3, Institute of Process Engineering, Johannes Kepler University Linz, Altenberger Straße 69, 4040 Linz, Austria
4, Department of Earth and Geo-environmental Sciences, University of Bari Aldo Moro, VIA E. Orabona N. 4, Bari 70125, Italy
E-mail:
hsngeo@gmail.com
Received: 07/02/2026
Acceptance: 18/03/2026
Available Online: 19/03/2026
Published: 01/07/2026

Manuscript link
http://dx.doi.org/10.30493/DAS.2026.011903
Abstract
Desertification is a serious environmental challenge that takes place in arid and semi-arid regions, posing serious threats to oasis ecosystem and the socio-economic condition of the local population. This work uses remote sensing and machine learning to assess the severity of desertification in the Tissint oasis in southern Morocco. The analysis utilized nine spectral indices obtained from Sentinel-2 imagery, reflecting the condition of vegetation, exposure of soil, albedo, moisture stress and sand encroachment. Using the interpretation of high-resolution imagery and field observations, 170 training and validation samples defined as small polygons were used to define reference data. To assess the desertification severity maps, three machine learning algorithms were executed, namely random forest (RF), support vector machine (SVM), and decision tree (DT). According to SVM model, the predominant class with area of 48.24 % is desertified land as compared to RF (37.16%) and DT (26.82%). Areas affected by sand encroachment are particularly visible in DT outputs, while stable vegetation is confined to the oasis core. According to model validation, the SVM outperformed other classifiers with accuracy = 91.76% and F1 = 93.22%. The robust and balanced performance of RF was similar to that of SVM, while DT had a lower capacity for generalization. The findings indicate that the strength of combined Sentinel-2 spectral indices and machine learning can effectively assess desertification severity. Furthermore, it can provide spatial insights for monitoring and mitigation processes.
Keywords: Desertification, Remote sensing, Machine learning, Oasis
Introduction
Desertification represents one of the most urgent ecological and environmental issues across the globe. This phenomenon involves land degradation within arid, semi-arid, and dry sub-humid regions [1]. Desertification influences close to 41% of the terrestrial surface of Earth, hyper-arid zones included. Furthermore, the lives of more than 38% of the world population are impacted by the changes resulted from desertification [2]. Significant socioeconomic hurdles at local, regional, and global levels are created by desertification in addition to its ecological fallout [3]. Public health, food security, and socioeconomic resilience face direct threats from this phenomenon. Consequently, global and national stability along with sustainable growth are often undermined [4]. Developing nations in arid and semi-arid zones suffer the most intense consequences, since land degradation is worsened by the delicate ecosystems and lack of adaptive capacity in these areas [5].
High levels of vulnerability to desertification characterize the Middle East and North Africa region [6]. Low and inconsistent annual precipitation, when paired with high temperatures, primarily drives this sensitivity. Intense droughts are often caused by these combined environmental factors [7]. Soil properties, including water retention capacity, are significantly impacted by desertification, which in turn influences the spatial distribution of crops and the agricultural viability of lands [8].
More than 90% of the national territory of Morocco is affected by desertification, rendering it a vital environmental and socioeconomic concern for the nation [9]. Arid and semi-arid regions with delicate soils and difficult climates experience these effects most severely. Long-term rainfall variability further intensifies this phenomenon, with precipitation showing a general downward trend and inconsistent distribution across time and space. As a result, land sensitivity to degradation increases, particularly in southern Morocco [10]. The necessity for efficient monitoring systems and sustainable land management strategies is highlighted by these facts. Therefore, targeted mitigation measures are required to restrict the environmental and socioeconomic damage within at-risk locations.
To address the complexities of desertification, modeling offers an effective means of exploring and predicting land degradation processes. However, given the logistical challenges of gathering field data in arid environments, remote sensing has become an essential tool for monitoring these shifts [11]. The integration of multi-temporal satellite imagery facilitates a comprehensive evaluation of degradation dynamics by monitoring key indicators, including vegetation status, surface albedo, and thermal conditions [12].
Two main methodological approaches to quantify and monitor desertification are widely reported in the literature. The first relies on visual interpretation and thematic classification of desertification stages based on vegetation cover and surface characteristics [13]. The second approach is quantitative, using satellite-derived indices such as the Normalized Difference Vegetation Index (NDVI), Temperature Vegetation Dryness Index (TVDI), albedo, and other indicators of vegetation stress and soil exposure [14]. These indices enable the mapping of desertification severity, the analysis of its dynamics, and the identification of high-risk areas, while providing a reproducible framework for long-term monitoring.
The present study builds upon an integrated framework in which machine learning techniques are applied to assess desertification dynamics in fragile oasis ecosystems, such as those of southern Morocco, where land degradation is driven by the combined effects of climatic variability and anthropogenic pressures. Specifically, Random Forest (RF), Support Vector Machine (SVM), and Decision Tree (DT) models are implemented using a set of satellite-derived indices [15]. The performance of these algorithms is systematically evaluated and compared to identifying their relative effectiveness in capturing the spatial patterns and intensity of desertification in the Tissint region, thereby contributing to a robust, data-driven approach for regional environmental monitoring.
Methodology
Study area
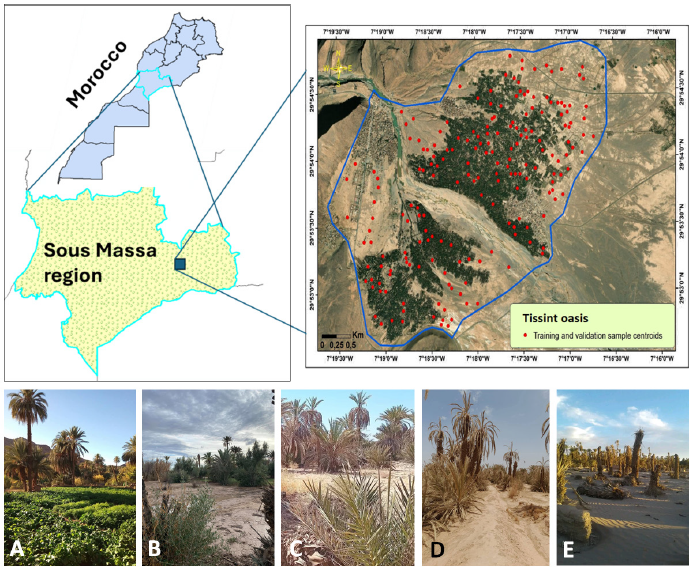
The Tissint oasis, situated in the Tata province of the Souss-Massa region in southeastern Morocco, was designated as the subject of investigation in this research. Geographic coordinates for this site span approximately from 7°16’34” W to 7°19’37” W and 29°52’37” N to 29°54’52” N (Fig. 1). Landscape features and ecological traits are molded by the transitional setting at the border of the Saharan domain and the eastern Anti-Atlas Mountains. An arid climate involving minimal and erratic rainfall alongside high temperatures governs the area. Drought conditions and notable year-to-year changes in water supply are frequently triggered by these weather patterns. A central role in restricting vegetation growth and agricultural output is played by these environmental pressures. Additionally, these constraints increase the vulnerability of the oasis to desertification [16].
When viewed from a geomorphological perspective, rocky and sandy formations encircle the alluvial plains and wadis that primarily constitute the region. These landforms maintain a close link to agricultural activities. Date palm groves and related crops depend on ephemeral surface flows and shallow groundwater resources for their survival. Traditional irrigated agriculture remains the primary land use within the Tissint oasis. Date palm cultivation serves as the central foundation for the local agro-ecosystem. Therefore, vegetation degradation, soil exposure, and localized salinization have emerged from increasing human pressure and constant climatic stress during recent decades. The Tissint oasis offers a suitable and typical environment for analyzing desertification dynamics. Such studies benefit from remote sensing and machine learning approaches due to the precarious environmental equilibrium of the location.
Data sources and preprocessing
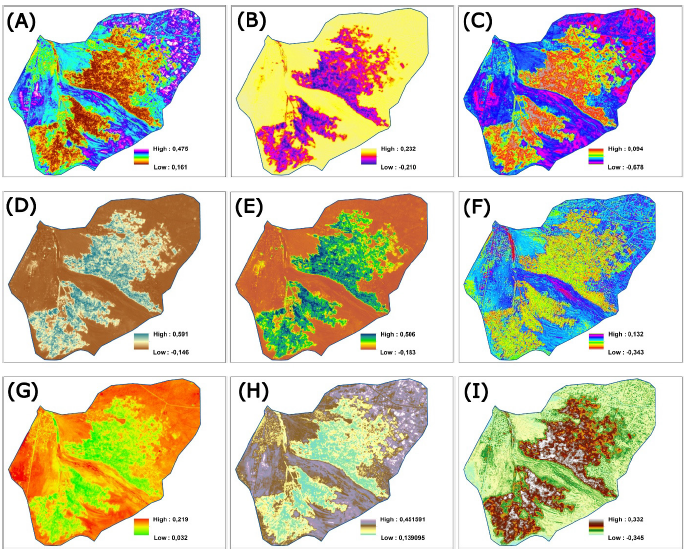
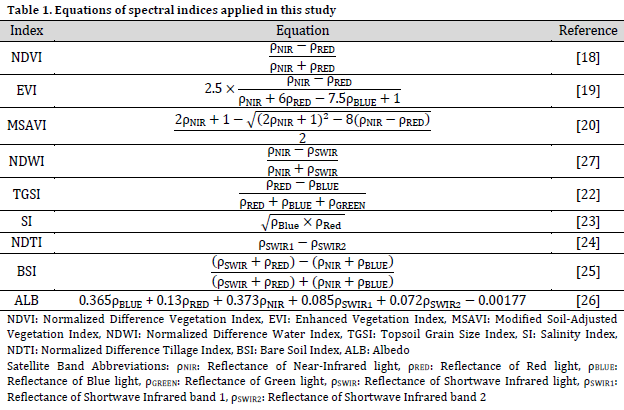
In this study, desertification assessment is based on the use of nine spectral indices widely recognized for their relevance in analyzing land degradation in arid environments. The selected indices: Topsoil Grain Size Index (TGSI), Salinity Index (SI), Normalized Difference Water Index (NDWI), Normalized Difference Vegetation Index (NDVI), Normalized Difference Tillage Index (NDTI), Modified Soil-Adjusted Vegetation Index (MSAVI), Enhanced Vegetation Index (EVI), Bare Soil Index (BSI), and surface albedo, were employed as input variables for the modeling framework.
These metrics were extracted from Sentinel-2 multispectral imagery at a 10 m spatial resolution using the Google Earth Engine (GEE) cloud computing environment. Mean composite images covering the 2020–2025 timeframe provided the foundation for the analysis to maintain stable and uniform spectral results. Only satellite scenes with cloud cover below 10% were included in the final dataset. By utilizing GEE, the data was accessed and preprocessed while calculating indices through a consistent and reproducible workflow. This systematic approach enabled the effective management of extensive multi-temporal observations.
the GIS environment (QGIS) was used to for further spatial refinement of the exported raster layers of the generated indices. The workflow involved spatial harmonization and layer preparation to align the datasets properly. Specific data formatting was also applied during this stage. These adjustments ensured that the inputs remained entirely compatible with the selected machine learning algorithms.
Reference data and training sample generation
Reference data for training and validating the machine learning models were generated through a combined approach of visual interpretation, very high-resolution satellite imagery, and targeted field surveys within the Tissint oasis (southern Morocco). This multi-source strategy ensured both spatial representativeness and thematic accuracy of the samples.
Google Earth Pro enabled the initial mapping of desertification severity classes by targeting surface markers such as vegetation density, soil exposure, sand accumulation, and patterns of land degradation. Overall, 170 homogeneous polygonal samples were manually selected to represent the study area. These samples fall into five distinct categories: Stable Vegetation, Moderately Degraded Land, Degradation in Progress, Desertified Land, and Sand-Encroached Areas. These classifications capture the primary ecological gradients and degradation pathways observed within arid oasis environments (Fig. 1 A-E).
To enhance reliability, these samples were validated and refined through systematic field surveys, which provided direct observations of vegetation condition, soil degradation, and active desertification features. The resulting reference dataset was then randomly subdivided into training (70 %) and validation (30 %) subsets, ensuring robust model calibration and an unbiased assessment of predictive performance [17].
Spectral index computation for desertification assessment
Sentinel-2 imagery provided the spectral indices necessary to evaluate desertification in the Tissint oasis by capturing the core biophysical drivers of land degradation. Plant health, density, and resilience in arid climates were characterized through various vegetation metrics. The Normalized Difference Vegetation Index (NDVI) measures photosynthetic activity, biomass, and greenness. Since NDVI values drop as plants deteriorate, this index serves as a primary measurement for tracking desertification [18]. To achieve a more precise view of vegetation vigor, the Enhanced Vegetation Index (EVI) offers better sensitivity in dense growth areas while filtering out interference from the soil and atmosphere [19]. The Modified Soil-Adjusted Vegetation Index (MSAVI) further refines these observations by reducing the influence of the soil background. This adjustment is vital for the sparse or mixed ground cover common in oasis settings [20]. Finally, the Normalized Difference Water Index (NDWI) was used to track moisture stress and water availability. These values directly indicate the internal water content of the local flora [21].
Soil and surface conditions were characterized using indices that quantify texture, salinity, disturbance, and overall degradation. The Topsoil Grain Size Index (TGSI) highlights soil texture and coarseness, identifying surfaces prone to wind erosion [22]. The Salinity Index (SI) detects surface salinity, an important factor affecting oasis agriculture and soil degradation under water stress [23]. The Normalized Difference Tillage Index (NDTI) identifies areas of exposed or disturbed soil, which are more susceptible to erosion [24]. The Bare Soil Index (BSI) provides an integrated measure of soil exposure, combining reflectance from red, NIR, blue, and SWIR bands to detect early signs of land degradation [25]. Finally, surface albedo offers complementary insights into overall surface reflectivity and the intensity of land degradation, with higher values indicating bare or degraded areas [26].
All index layers were exported and integrated into QGIS and subsequently prepared as input variables for the machine learning models. This workflow ensured spatial consistency and provided a robust, multidimensional characterization of desertification processes by jointly representing vegetation dynamics, moisture conditions, and soil surface properties. The mathematical formulations of the spectral indices used in this study are reported in Table 1, while their spatial distribution and thematic maps are presented in Figure 2.
Machine learning modeling framework
Selection of machine learning algorithms
This study utilized three common machine learning algorithms: Random Forest (RF), Support Vector Machine (SVM), and Decision Tree (DT). These models were selected since their diverse and complementary strengths allow for the effective processing of high-dimensional environmental datasets. Each method has also demonstrated reliable performance in susceptibility modeling using remote sensing data. By combining these methods, the analysis benefits from different approaches to identifying patterns within complex geographic information.
The Random Forest (RF) algorithm functions as an ensemble learning technique by building numerous decision trees from randomized portions of the training data and input variables. This strategy improves the accuracy of predictions while preventing overfitting, which is especially useful when handling diverse environmental datasets. Previous studies have successfully utilized RF within desertification and land degradation research. In these cases, the model demonstrated stable performance when processing various remote sensing indicators, such as albedo and vegetation indices, and often provided better classification results than alternative models used for similar tasks [27-29].
As a non-parametric learning algorithm, the Support Vector Machine (SVM) identifies an optimal separating hyperplane within high-dimensional feature spaces. This mathematical boundary effectively handles complex environmental modeling tasks where class divisions are not linearly separable. Researchers have successfully implemented SVM to map the susceptibility of natural hazards, including erosion and landslides [30]. Because the model generalizes well across diverse datasets, it remains a reliable choice for geographic risk assessment.
The DT algorithm offers a hierarchical rule-based modeling framework that is simple to interpret and implement [31]. Although individual DT models may be more susceptible to overfitting than ensemble methods, they provide valuable insight into decision rules and variable interactions. DTs have been used effectively in land use/land cover classification and environmental risk assessments, providing interpretable decision structures that support model explanation [32].
The primary objective of including these three algorithms in the modeling framework is to compare their performance in mapping desertification susceptibility within the Tissint oasis using satellite-derived spectral indices, and to determine which approach best captures spatial patterns of land degradation under arid conditions.
Model training and parameterization
The machine learning models were trained following a structured and reproducible procedure to ensure robust performance and objective comparison. The reference dataset, derived from field surveys and visual interpretation, was randomly divided into 70% training samples and 30% validation samples, a commonly adopted split in environmental susceptibility modeling that balances learning efficiency and independent model evaluation [33][34].
Prior to model training, all spectral indices were normalized using min–max scaling to a common range to reduce scale-related bias and improve model stability, particularly for distance-based classifiers such as SVM. Normalization is widely recommended when integrating multiple spectral indices derived from remote sensing data [35].
The RF model was implemented using an ensemble of 500 decision trees (ntree = 500) to ensure stable predictions and reduce variance. The number of variables randomly selected at each split was set to the square root of the total number of input features (mtry = √p), which corresponds to mtry = 3 given the nine spectral indices used in this study. This configuration is commonly reported in remote sensing and land degradation studies as a robust compromise between accuracy and computational efficiency [36]. Default bootstrapping was applied to generate diverse tree structures and limit overfitting.
The SVM classifier was trained using a radial basis function (RBF) kernel, which is well suited for capturing non-linear relationships between spectral indices and desertification patterns. The penalty parameter was set to C = 10, while the kernel width parameter was defined as γ = 0.1, values frequently adopted in environmental and hazard susceptibility modeling to balance model flexibility and generalization capability [37].
For DT model, a maximum tree depth of 10 levels was imposed to limit model complexity and reduce overfitting, while maintaining interpretability of the classification rules. The minimum number of samples required for node splitting was fixed at 10, which is a commonly applied constraint in environmental classification tasks to avoid overly fragmented trees [38].
Model implementation followed a hybrid computational framework. Google Earth Engine (GEE) was used for satellite image preprocessing, spectral index computation, and sample extraction, ensuring efficient handling of multi‑temporal Sentinel‑2 datasets. The machine learning models were subsequently trained and validated using Python‑based libraries, enabling consistent parameterization and standardized performance comparison across algorithms. This combined cloud–local approach has been increasingly adopted in recent remote sensing and environmental modeling studies [39].
Model validation and performance evaluation
Model validation is a critical step to ensure the scientific reliability and robustness of the desertification susceptibility maps generated using machine learning techniques. In this study, the predictive performance of the RF, SVM, and DT models was assessed using an independent validation dataset. A set of complementary evaluation metrics was employed to provide a comprehensive and unbiased comparison of model performance, accounting for both classification accuracy and class-specific discrimination capability.
Overall Accuracy (OA) was used to quantify the proportion of correctly classified samples across all classes, offering a general measure of model correctness [40]. However, since OA can be sensitive to class imbalance, the Kappa coefficient was additionally computed to evaluate the agreement between predicted and reference classes beyond chance effects [41]. To further assess class-specific performance, Precision and Recall metrics were calculated. Precision reflects the reliability of predicted degraded areas by penalizing false positives, while Recall evaluates the model’s ability to correctly identify truly degraded zones, thus minimizing omission errors. The combined use of these metrics enables a robust and objective comparison between RF, SVM, and DT models, allowing the identification of the most reliable algorithm for desertification mapping in the Tissint oasis. The mathematical formulations used for the calculation of the different evaluation metrics are summarized as follows:
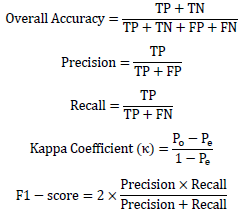
Where: TP, TN, FP, FN stand for true positive, true negative, false positive, and false negative predictions, respectively. Po and Pe represent the observed and expected agreements, respectively, and were used to distinguish between the model’s capability of matching ground truth data (Po) and its tendency to give predictions based merely on random chance (Pe).
Results and Discussion
Variable importance analysis of spectral indices
Random Forest variable importance analysis demonstrated clear differences in the contribution of each spectral variable to desertification mapping in the Tissint oasis (Fig. 3). The analysis identifies vegetation-related metrics, particularly NDVI (0.173) and MSAVI (0.127), as the most influential predictors. These results confirm that plant density and condition function as the primary indicators of desertification within oasis environments. Researchers in arid and semi-arid regions frequently report a similar dominance of vegetation indices [42]. In these locations, land degradation processes show a close association with diminishing plant cover. High importance value was also demonstrated by surface albedo (0.156) due to its sensitivity to ground exposure and vegetation loss. This combined significance of albedo and vegetation indices matches earlier findings where increased surface reflectance acts as a reliable proxy for advanced degradation in dryland ecosystems [42][43].
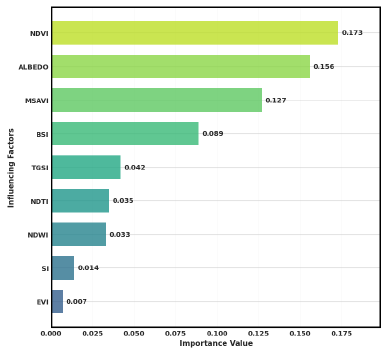
Soil-related indices, such as BSI (0.089) and TGSI (0.042), contribute moderately to the classification, reflecting the role of soil exposure and texture in erosion and surface instability. Comparable secondary contributions of soil indices have been reported in desertification assessments conducted in other arid regions, where vegetation signals generally dominate spectral responses [43]. In contrast, moisture- and salinity-related indices (NDWI and SI), as well as EVI, exhibit lower importance, suggesting more localized or redundant effects under the specific hydro-environmental conditions of the Tissint oasis.
It can be deduced that vegetation degradation and surface exposure act as the primary drivers behind desertification patterns according to the variable importance ranking. Meanwhile, soil and moisture-related factors fulfill a secondary but supportive function. Existing conceptual models of desertification in fragile oasis systems align with this hierarchy. In these environments, land degradation manifests most immediately and clearly through vegetation decline [44].
Spatial patterns of desertification severity
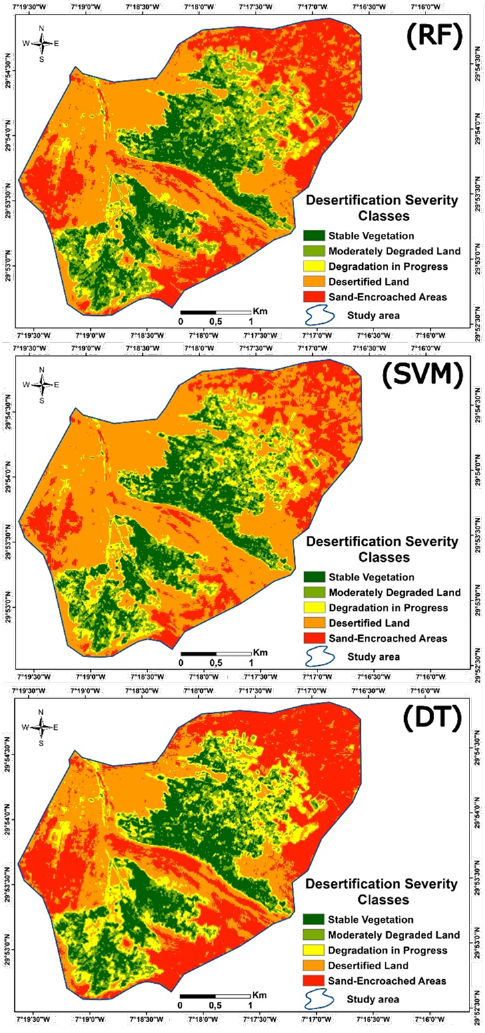
Consistent spatial patterns and significant differences between the results are highlighted by the desertification severity maps produced by the RF, SVM, and DT models for the Tissint oasis (Fig. 4). A central oasis core containing relatively stable vegetation is clearly identified by all three models. Zones showing higher levels of land degradation and desertification encircle this interior area. Arid oasis systems typically display this type of spatial arrangement. In these fragile settings, groundwater and irrigation access sustain the cultivated patches embedded within the desert landscape [42].
The “Stable Vegetation” class is consistently concentrated in the central and downstream parts of the oasis, corresponding to palm groves and irrigated agricultural plots. These areas appear spatially coherent and continuous across all models, indicating a strong agreement in identifying zones where vegetation cover and soil moisture conditions remain relatively preserved. Similar spatial stability of vegetated cores has been reported in oasis environments of southern Morocco and other arid regions, where permanent crops mitigate degradation processes locally [44].
“Moderately Degraded Land” forms transitional belts around the cultivated core, particularly evident in the RF and SVM outputs. These zones likely reflect reduced vegetation density, declining irrigation efficiency, or increasing pressure from surrounding barren surfaces. The spatial continuity supports the interpretation of this class as an intermediate degradation stage rather than isolated or sporadic degradation patches, a pattern also observed in semi-arid regions undergoing gradual land degradation [43].
Areas classified as “Degradation in Progress” are more fragmented and mainly located at the interface between agricultural land and severely degraded surfaces. The DT model allocates a larger extent to this class, suggesting a higher sensitivity to subtle spectral variations but also a potential tendency toward over-fragmentation. In contrast, RF and SVM tend to assign these transitional zones directly to more advanced degradation classes, reflecting their higher generalization tendency.
“Desertified Land” dominates the peripheral parts of the study area in all three models, with the most extensive and continuous distribution observed in the SVM output. These zones correspond to bare or sparsely vegetated surfaces and reflect advanced stages of land degradation. The higher proportion mapped by SVM suggests a more conservative classification strategy, grouping transitional surfaces into severe desertification classes, which is consistent with its higher recall and discriminative power.
Finally, “Sand-Encroached Areas” are distinctly identified, especially by the Decision Tree and Random Forest models, mainly along the margins of the oasis and in downwind sectors. Their spatial separation from other desertified surfaces supports the decision to treat sand encroachment as a distinct desertification-related process rather than a generic barren land class. The SVM model shows a comparatively lower proportion of this class, indicating differences in spectral separability between sand-covered surfaces and other degraded lands [44]. The smaller fraction of sand-encroached mapped by SVM suggests that spectral separability varies between sandy surfaces and other types of degraded land. Such an outcome possibly arises from the model’s focus on vegetation-related features. Evaluating intricate degradation processes like sand encroachment underscores the value of a multi-model comparison. These processes often display spectral characteristics that overlap with other desertified surfaces, rendering a single-model approach less definitive.
Quantitative comparison of desertification severity classes
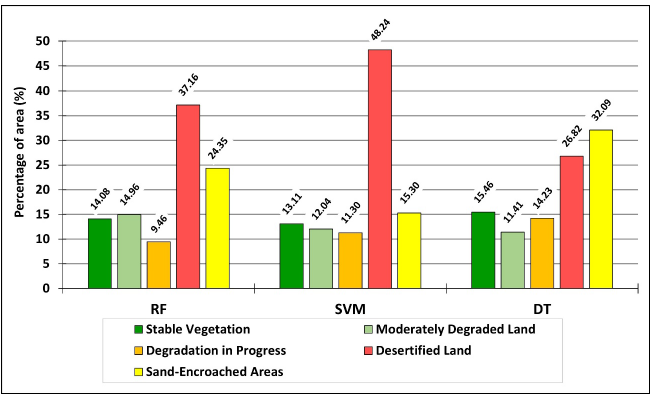
The RF, SVM, and DT models show distinct variations in the surface proportions of desertification severity classes (Fig. 5). However, all models identified Desertified Land and Sand-Encroached Areas as the main dominant categories. SVM predicted the largest share of Desertified Land at 48.24%, while RF followed at 37.16%. In contrast, DT mapped a significantly lower 26.82%. Higher recall and F1-score values support the tendency of SVM to classify more area within the most severe degradation stage. These results highlight a superior capability for identifying desertified surfaces.
The largest portion of Sand-Encroached Areas (32.09%) was reported by the DT model, which exceeded the results from both RF (24.35%) and SVM (15.30%). This outcome suggests that DT possesses a higher sensitivity to characteristics linked to aeolian sand invasion. More uniform proportions were generated by the models for the less severe categories. Specifically, the extent of Stable Vegetation fluctuated between 13.11% for SVM and 15.46% for DT. For Moderately Degraded Land, values ranged from 11.41% in DT up to 14.96% in RF. Greater variability was observed in the Degradation in Progress class, which stems from discrepancies in how each method treats transitional surfaces. That model structure strongly affects class allocation as emphasized by these quantitative differences. This impact remains particularly high within transitional or sand-affected regions, even though broad spatial trends stayed consistent.
Model performance assessment
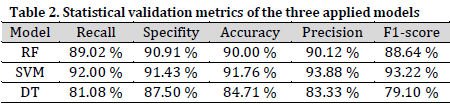
Clear differences in the classification capability of the three machine learning models are revealed by the performance metrics (Table 2). The most robust overall performance was demonstrated by the SVM model. This specific approach reached the highest recall (92.00%), accuracy (91.76%), precision (93.88%), and F1-score (93.22%). These balanced outcomes suggest a high capacity to accurately detect desertification classes while reducing both omission and commission errors.
Stable and well-balanced results characterize the RF model, where performance metrics consistently reach nearly 90%. Its relatively high F1-score (88.64%) further supports its dependability for mapping desertification. In contrast, lower recall (81.08%), accuracy (84.71%), and F1-score (79.10%) are observed in the DT model. These values indicate a diminished generalization capacity and greater vulnerability to data fluctuations. Earlier research [40] corroborates these findings by emphasizing the way by which ensemble and kernel-based methods outperform single-tree classifiers. Such trends are common during intricate environmental classification tasks.
Overall, the results identify SVM as the most effective model for desertification mapping in the Tissint oasis, while RF remains a strong and consistent alternative, reinforcing the value of ensemble learning approaches in arid land degradation studies.
Conclusions
Arid and semi-arid regions face a significant environmental and socio-economic challenge in desertification. This issue is particularly intense within oasis systems. In these specific locations, severe climatic constraints shape the interaction between human activities and finite natural resources. Soil quality, vegetation sustainability, and local livelihoods in the Tissint oasis of southeastern Morocco currently face direct threats from land degradation. Such pressures eventually undermine both environmental stability and socio-economic resilience. Effective mitigation and sustainable land management strategies therefore require a thorough understanding of the spatial patterns and severity of desertification.
A methodological framework combining high-resolution remote sensing and machine learning was established to evaluate desertification intensity in the Tissint oasis. Various spectral indices characterizing vegetation condition, soil exposure, moisture stress, salinity, and surface reflectance derived from Sentinel-2 imagery were utilized for the development of RF, SVM, and DT models. Google Earth Engine provided the platform for processing these 10 m spatial resolution data.
Coherent spatial patterns are revealed by the results across all models. These patterns feature a relatively stable vegetated core linked to irrigated agriculture. Surrounding this center are zones of progressive degradation and vast desertified regions at the oasis edges. The dominant role of vegetation indices (NDVI and MSAVI) and surface albedo is highlighted by the variable importance analysis. This outcome confirms that vegetation loss and soil exposure function as the main spectral markers of desertification in oasis settings. The highest predictive performance was achieved by SVM among the tested algorithms. Meanwhile, RF showed significant robustness and consistency.
Spatially explicit and decision-relevant information is supplied by the resulting desertification severity maps. These products allow for the identification of priority intervention areas. Land restoration planning is supported by this data, which also helps optimize water and agricultural management. Several constraints persist despite these findings, such as a heavy reliance on indices derived from satellites and a restricted density of field observations. Furthermore, imagery at a 10 m resolution cannot entirely capture fine-scale ecological processes. Thus, more granular ground data, information on land management, and climatic variables can assist in more reliable desertification mapping attempts in the future. These studies should also utilize longer time series and more sophisticated machine learning architectures. Ultimately, this work proves that combining multi-index remote sensing with machine learning creates a dependable and functional framework for evaluating desertification in oasis settings.
Conflict of interest statement
The authors declared no conflict of interest.
Funding statement
The authors declared that no funding was received in relation to this manuscript.
Data availability statement
The authors declared that all data sources are cited in the text, and the dataset used in this study will be made available by the corresponding author upon reasonable request.
References
- Xi L, Qi Z, Feng Y, Cao X, Cui M, Zou J, Feng S. Construction of a Desertification Composite Index and Its Application in the Spatiotemporal Analysis of Land Desertification in the Ring-Tarim Basin over 30 Years. Remote Sens. 2025;17(4):644. DOI
- Jiang Z, Ni X, Xing M. A Study on Spatial and Temporal Dynamic Changes of Desertification in Northern China from 2000 to 2020. Remote Sens. 2023;15(5):1368. DOI
- Briassoulis H. Combating Land Degradation and Desertification: The Land-Use Planning Quandary. Land. 2019;8(2):27. DOI
- Peters DP, Havstad KM, Archer SR, Sala OE. Beyond desertification: new paradigms for dryland landscapes. Front. Ecol. Environ. 2015;13(1):4-12. DOI
- Becerril-Piña R, Díaz-Delgado C, Mastachi-Loza CA, González-Sosa E. Integration of remote sensing techniques for monitoring desertification in Mexico. Hum. Ecol. Risk Assess. Int. J. 2016;22(6):1323-40. DOI
- Hamzeh NH, Karami S, Opp C, Fattahi E, Jean-François V. Spatial and temporal variability in dust storms in the Middle East, 2002–2018: three case studies in July 2009. Arabian J. Geosci. 2021;14(7):538. DOI
- Li W, El-Askary HM, Qurban M, Allali M, Manikandan KP. On the Drying Trends Over the MENA Countries Using Harmonic Analysis of the Enhanced Vegetation Index. In: Advances in Science, Technology and Innovation. Springer International Publishing. 2018. DOI
- Bouzekri A, Alexandridis TK, Toufik A, Rebouh NY, Chenchouni H, Kucher D, Dokukin P, Said Mohamed E. Assessment of the spatial dynamics of sandy desertification using remote sensing in Nemamcha region (Algeria). Egypt. J. Remote Sens. Space Sci. 2023;26(3):642-53. DOI
- Laamouri A, Khattabi A. Estimating the Economic Cost of Land Degradation and Desertification in Morocco. Land. 2025;14(4):837. DOI
- Labbaci A, Bouchaou L. Assessing land degradation and sensitivity to desertification using MEDALUS model and Google Earth Engine in a semi-arid area in Southern Morocco: Case of Draa watershed. Front. Sci. Eng. Int. J. 2021;11(2). DOI
- Han L, Zhang Z, Zhang Q, Wan X. Desertification assessments in the Hexi corridor of northern China’s Gansu Province by remote sensing. Nat. Hazard. 2014;75(3):2715-31. DOI
- Song X, Wang T, Xue X, Yan C, Li S. Monitoring and analysis of aeolian desertification dynamics from 1975 to 2010 in the Heihe River Basin, northwestern China. Environ. Earth Sci. 2015;74(4):3123-33. DOI
- Duan H, Wang T, Xue X, Yan C. Dynamic monitoring of aeolian desertification based on multiple indicators in Horqin Sandy Land, China. Sci. Total Environ. 2019;650:2374-88. DOI
- Sandholt I, Rasmussen K, Andersen J. A simple interpretation of the surface temperature/vegetation index space for assessment of surface moisture status. Remote Sens. Environ. 2002;79(2-3):213-24. DOI
- Ait Naceur H, Igmoulan B, Namous M, Amrhar M, Bourouay O, Ouayah M, Jadoud M. A comparative study of different machine learning methods coupled with GIS for landslide susceptibility assessment: a case study of N’fis basin, Marrakesh High Atlas (Morocco). Arabian J. Geosci. 2022;15(11):1100. DOI
- Lassiane Y, El Wahidi F, Ait Naceur H, Benazun H. An integrated approach based on ecological and geo-environmental indicators for the spatio-temporal monitoring of desertification: The case of the Skoura oasis (Morocco). J. Bulg. Geogr. Soc. 2025;53:187-220. DOI
- Anh DT, Pandey M, Mishra VN, Singh KK, Ahmadi K, Janizadeh S, Tran TT, Linh NTT, Dang NM. Assessment of groundwater potential modeling using support vector machine optimization based on Bayesian multi-objective hyperparameter algorithm. Appl. Soft Comput. 2023;132:109848. DOI
- Yang Q, Chen J, Yang G, Xie H, Li M, Sun J. Dynamic evolution of rocky desertification and vegetation restoration and analysis of driving forces in Southwest Karst Region from 2000 to 2020. PLoS ONE. 2025;20(11):e0332644. DOI
- Xu X, Liu L, Han P, Gong X, Zhang Q. Accuracy of Vegetation Indices in Assessing Different Grades of Grassland Desertification from UAV. Int. J. Environ. Res. Public Health. 2022;19(24):16793. DOI
- Derdour A, Jodar Abellan A, Melian-Navarro A, Bailey R. Assessment of Land Degradation and Droughts in an Arid Area Using Drought Indices, Modified Soil-Adjusted Vegetation Index and Landsat Remote Sensing Data. CCuad. Investig. Geogr. 2023;49(2):65-81. DOI
- Welikhe P, Quansah JE, Fall S, McElhenney W. Estimation of soil moisture percentage using LANDSAT-based moisture stress index. J. Remote Sens. GIS. 2017;6(2):1-5.
- Kumar BP, Babu KR, Rajasekhar M, Ramachandra M. Assessment of the Visual Disaster of Land Degradation and Desertification Using TGSI, SAVI, and NDVI Techniques. In: Geospatial Modeling for Environmental Management. CRC Press. 2022:261-79. DOI
- Pashaei M, Rashki A, Sepehr A. An Integrated Desertification Vulnerability Index for Khorasan-Razavi, Iran. Nat. Resour. Conserv. 2017;5(3):44-55. DOI
- Abdulwahid WM, Feizizadeh B, Blaschke T, Karimzadeh S. A Geoinformation Approach for Spatiotemporal Mapping of Climate Change Environmental Impacts on Sustainable Food Production in Iraq. Int. J. Environ. Res. 2025;19(5):175. DOI
- Anum S, Nasar-u-Minallah M, Abdullah M, Ashiq S, Nuskiya MHF. Geospatial Assessment of Land Degradation and Desertification in the Semi-Arid Areas of Balochistan, Pakistan. GeoJournal. 2025;90(6):295. DOI
- Alghababsheh A. A multi-scale assessment of desertification severity in the Eastern Mediterranean region based on albedo-MSAVI feature space. Environ. Monit. Assess. 2024;196(12):1163. DOI
- Mohammad AH, Ghanem M, De La Hera-rica PA, Al Rowwad AA, Shatanawi K. Satellite-based drought indicators for supporting sustainable water management. Glob. J. Environ. Sci. Manag. 2025;11(4):1493-508. DOI
- Feng K, Wang T, Liu S, Kang W, Chen X, Guo Z, Zhi Y. Monitoring Desertification Using Machine-Learning Techniques with Multiple Indicators Derived from MODIS Images in Mu Us Sandy Land, China. Remote Sens. 2022;14(11):2663. DOI
- Berdyyev A, Al-Masnay YA, Juliev M, Abuduwaili J. Desertification Monitoring Using Machine Learning Techniques with Multiple Indicators Derived from Sentinel-2 in Turkmenistan. Remote Sens. 2024;16(23):4525. DOI
- Bag R, Mondal I, Dehbozorgi M, Bank SP, Das DN, Bandyopadhyay J, Pham QB, Fadhil Al-Quraishi AM, Nguyen XC. Modelling and mapping of soil erosion susceptibility using machine learning in a tropical hot sub-humid environment. J. Cleaner Prod. 2022;364:132428. DOI
- Sarailidis G, Wagener T, Pianosi F. Integrating scientific knowledge into machine learning using interactive decision trees. Comput. Geosci. 2023;170:105248. DOI
- Thanh Noi P, Kappas M. Comparison of Random Forest, k-Nearest Neighbor, and Support Vector Machine Classifiers for Land Cover Classification Using Sentinel-2 Imagery. Sensors. 2017;18(1):18. DOI
- Khosravi K, Shahabi H, Pham BT, Adamowski J, Shirzadi A, Pradhan B, Dou J, Ly H, Gróf G, Ho HL. A comparative assessment of flood susceptibility modeling using Multi-Criteria Decision-Making Analysis and Machine Learning Methods. J. Hydrol. 2019;573:311-23. DOI
- Costache R, Pham QB, Sharifi E, Linh NTT, Abba S, Vojtek M, Vojteková J, Nhi PTT, Khoi DN. Flash-Flood Susceptibility Assessment Using Multi-Criteria Decision Making and Machine Learning Supported by Remote Sensing and GIS Techniques. Remote Sens. 2019;12(1):106. DOI
- Mirzaeitalarposhti R, Shafizadeh-Moghadam H, Taghizadeh-Mehrjardi R, Demyan MS. Digital Soil Texture Mapping and Spatial Transferability of Machine Learning Models Using Sentinel-1, Sentinel-2, and Terrain-Derived Covariates. Remote Sens. 2022;14(23):5909. DOI
- Yao X, Guo Q, Li A, Shi L. Optical remote sensing cloud detection based on random forest only using the visible light and near-infrared image bands. Eur. J. Remote Sens. 2022;55(1):150-67. DOI
- Boali A, Asgari HR, Mohammadian Behbahani A, Salmanmahiny A, Naimi B. Remotely sensed desertification modeling using ensemble of machine learning algorithms. Remote Sens. Appl. Soc. Environ. 2024;34:101149. DOI
- Cao J, Wen X, Zhang M, Luo D, Tan Y. Information Extraction and Prediction of Rocky Desertification Based on Remote Sensing Data. Sustainability. 2022;14(20):13385. DOI
- Sultan M, Saleous N, Issa S, Dahy B, Sami M. Optimizing Land Use Classification Using Google Earth Engine: A Comparative Analysis of Machine Learning Algorithms. ISPRS Ann. Photogramm. Remote Sens. Spatial Inf. Sci. 2025;X-G-2025:863-9. DOI
- Kavzoglu T, Teke A. Predictive Performances of Ensemble Machine Learning Algorithms in Landslide Susceptibility Mapping Using Random Forest, Extreme Gradient Boosting (XGBoost) and Natural Gradient Boosting (NGBoost). Arabian J. Sci. Eng. 2022;47(6):7367-85. DOI
- Youssef AM, El‑Haddad BA, Skilodimou HD, Bathrellos GD, Golkar F, Pourghasemi HR. Landslide susceptibility, ensemble machine learning, and accuracy methods in the southern Sinai Peninsula, Egypt: Assessment and Mapping. Nat. Hazard. 2024;120(15):14227-58. DOI
- Vicente-Serrano S, Cabello D, Tomás-Burguera M, Martín-Hernández N, Beguería S, Azorin-Molina C, Kenawy A. Drought Variability and Land Degradation in Semiarid Regions: Assessment Using Remote Sensing Data and Drought Indices (1982–2011). Remote Sens. 2015;7(4):4391-423. DOI
- Yang Z, Gao X, Lei J, Meng X, Zhou N. Analysis of spatiotemporal changes and driving factors of desertification in the Africa Sahel. CATENA. 2022;213:106213. DOI
- Lamqadem A, Saber H, Pradhan B. Quantitative Assessment of Desertification in an Arid Oasis Using Remote Sensing Data and Spectral Index Techniques. Remote Sens. 2018;10(12):1862. DOI
Cite this article:
Ait Naceur, H., El Wahidi, F., Lassiane, Y., Benazun, H., Maged, A., Rashid, M. Monitoring oasis desertification in southern Morocco: a comparative analysis of machine learning algorithms. DYSONA – Applied Science, 2026;7(2):228-42. doi: 10.30493/das.2026.011903