Ioannis Kotaridis 1*
1, Faculty of Engineering, School of Civil Engineering, Aristotle University of Thessaloniki, 54124, Thessaloniki, Greece
E-mail:
iskotarid@civil.auth.gr
Received: 10/02/2026
Acceptance: 29/03/2026
Available Online: 31/03/2026
Published: 01/07/2026

Manuscript link
http://dx.doi.org/10.30493/DAS.2026.013103
Abstract
Rapid and reliable methodologies for identifying areas susceptible to rainfall-induced water accumulation are necessitated by frequent flood events in downstream regions. These techniques are especially vital where such zones intersect with critical infrastructure. For that purpose, remote sensing, Geographic Information Systems (GIS), and topographical analysis are usually integrated within a methodological framework to detect flood-prone areas. This research focuses on the man-made environment of Kassandra, Greece, while emphasizing road infrastructure. Sentinel-2A satellite imagery was utilized by Object-Based Image Analysis (OBIA) and Support Vector Machine (SVM) algorithms for land cover classification. An overall land cover classification accuracy of 84% was obtained. The Topographic Wetness Index (TWI) was calculated from ALOS digital elevation model data to identify areas with high water accumulation potential, and values exceeding 9 were classified as critical. A negative correlation (-0.24) between the Normalized Difference Tillage Index (NDTI) and TWI was revealed by statistical analysis. This result confirmed that areas with elevated water accumulation potential correspond to man-made surfaces. The results showed that approximately 19.5% of the total man-made environment and 21% of the road network are located within zones susceptible to water accumulation. Spatial analysis identified critical intersections between road segments and stream networks, which provides actionable intelligence for flood risk mitigation. However, digital elevation model resolution limits the accuracy of the methodology. Thus, future risk assessment would benefit from the integration of additional hydrological variables.
Keywords: Water accumulation, Man-made environment, Topographic Wetness Index, Image segmentation
Introduction
Downstream regions often experience inundation as a direct consequence of high-intensity precipitation within a drainage basin. This frequent natural disaster occurs when the terrestrial surface is overwhelmed by overland flow. Significant damage to both the natural and man-made landscapes typically follows such events [1-3]. Specifically, the destruction of property, loss of life, and the failure of essential utilities like bridges, power grids, and road networks often result from water overflow in populated zones. Recognition of sites with a high capacity for water storage is therefore essential for disaster mitigation. This prioritization is especially critical when these locations intersect with human infrastructure.
Catastrophic consequences for transportation and road infrastructure networks often follow periods of heavy precipitation. This vulnerability remains a primary concern because rural road designs frequently lack the capacity to withstand the sudden onset of flash floods. Such events arise rapidly from excessive rainfall volumes. The assessment of regional flood risk requires the synthesis of multiple environmental variables. Specifically, researchers must integrate data regarding soil composition, land cover, and topography [4]. Resilience within the infrastructure network is a high priority because these systems represent a vital component of the man-made environment [5].
Emergency responsiveness improves when authorities plan in advance for socioeconomic and environmental impacts. Potential harm to infrastructure, natural resources, and agriculture decreases significantly through the implementation of prevention and mitigation strategies. Consequently, effective management policies depend on the rigorous identification of regions susceptible to water collection [2]. Flood management benefits from recent technological progress in geographic information system (GIS) and remote sensing. These tools support diverse tasks such as damage assessment, prevention, preparation, and prediction [1]. Researchers utilize GIS for data manipulation and spatial analysis. Meanwhile, remote sensing offers radar imagery capable of day, night, and all-weather operation, alongside optical data.
Object-Based Image Analysis (OBIA) divides remote sensing imagery into meaningful image objects (in contrast to individual pixels) in an effort to overcome the limitations of traditional pixel-based methods that merely evaluate their spectral characteristics to obtain valuable thematic information [6-12]. A process resembling visual perception is facilitated by the OBIA workflow. Despite these functional similarities, the nuanced sophistication of human cognition is not replicated by such algorithms [13]. The creation of fundamental OBIA elements begins with image segmentation [14]. This process divides imagery into regions that are spatially adjoining and relatively homogenous. These segments serve as the essential groundwork for supplementary analysis [13][15]. Researchers often find that the specific goals of a study dictate the choice of segmentation method. A single, perfect technique for every satellite image remains elusive, according to common academic consensus [16].
Remote sensing studies have developed and implemented various image segmentation methods over the past several decades. However, selecting appropriate segmentation parameter values remains a significant challenge for researchers, as no definitive guide currently exists to assist in extracting segments that satisfy specific study requirements [14]. Traditional classification systems split image segmentation methods into two primary categories. Spectrally-based approaches encompass algorithms cantered on feature space clustering and thresholding. Conversely, spatially-based approaches consist of graph-based, region-based, and edge-based algorithms. A breakthrough in the semantic segmentation of remote sensing imagery was triggered by Deep Learning (DL) architectures in recent years [17]. Two principal procedures, image segmentation and object classification, generally constitute the OBIA workflow. Object classification is usually used to extract real-world objects [14]. Image classification studies have employed a wide variety of classifiers, among which Support Vector Machine (SVM) and Random Forest (RF) have demonstrated exceptional performance [18-20].
Hydrologically-based topographic indices are established on the conception that a terrain profile controls the distribution of water. Topographic Wetness Index (TWI) is a morphometric index that shows the impact of local topography on runoff flow direction and accumulation [21-23]. This index can provide valuable information for the identification of rainfall runoff patterns, regions of probable increased soil moisture, and ponding regions. These outputs can be produced at a low cost compared to in-depth hydrologic and hydraulic studies. Land use planners and drainage engineers need, among other valuable information, an intuitive map that defines areas adversely affected by flash flooding and ponding caused by rainfall events in order to approve residential development. To conclude, TWI can comprise a complementary and cost-effective source of information to conventional hydrological approaches [21].
Several researchers have employed satellite data and implemented remote sensing methods to identify areas susceptible to flooding. In particular, Pourali et al. [24] described an application of TWI to map regions subject to flood. Nandi et al. [25] implemented a GIS-based multicriteria statistical analysis to map flood hazard in Jamaica. For this purpose, the researchers employed several factors, including TWI. Similarly, Motevalli et al. [26] used a probabilistic approach to map flood hazard and investigated the contribution of TWI in hazard zoning. Koriche et al. [27] produced a flood index map by utilizing satellite remote sensing data and hydrological modelling, combining the Standard Precipitation Index (SPI) and Topographic Wetness Index (TWI). Aksoy et al. [28] calculated TWI in a flood susceptibility assessment procedure at a regional scale to prioritize the potential flood prone regions, considering the importance of the assets at risk.
The need for a rapid, reliable, and easily implementable method to identify flood-prone areas is paramount for protecting both communities and critical infrastructure. This study was therefore motivated by the necessity to move beyond traditional, time-intensive hydrological models and leverage widely available geospatial data to support local planning and emergency response efforts. The principal objective of this study is to provide an efficient methodological framework for the rapid and accurate extraction of regions prone to rainfall water accumulation in built-up environments of varying population density in Kassandra, Greece, with a special focus on major road infrastructure.
Material and Methods
Study area
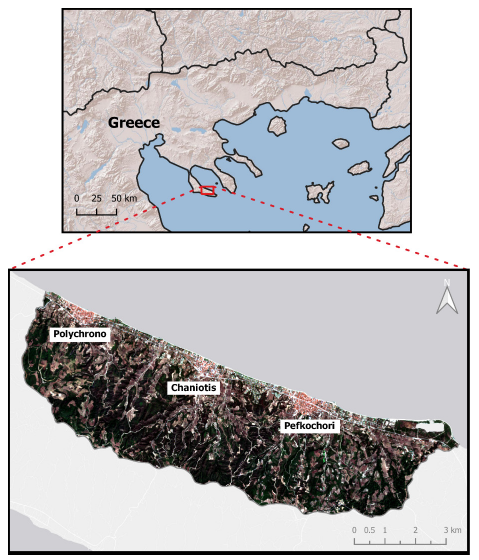
The region selected for this study covers an area of 49.4 km² located in Kassandra, the westernmost peninsula of the Regional Unit of Chalkidiki, Greece. The geological substrate is mostly composed of alluvial deposits in valleys, plains, and coastal areas [29]. The study region includes resort areas and three developed settlements, Polychrono, Chaniotis, and Pefkochori (Fig. 1). Therefore, the region under investigation represents a coastal area where several natural, social and economic features intersect. These intersections are accentuated by the demographic concentration. Given the history of flood events in the wider area [30], identifying zones with high flood risk is essential to prevent damage to infrastructure, property, and loss of life. In this context, water accumulation susceptibility maps can play a critical role.
Satellite and elevation data
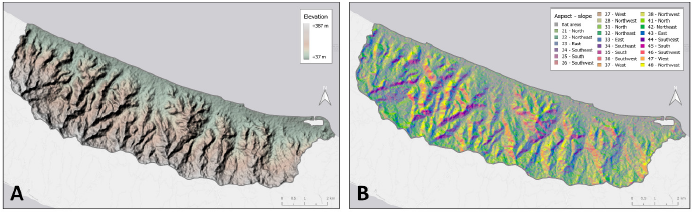
The investigation employed Sentinel-2A Level-2A (Bottom-Of-Atmosphere) corrected reflectance imagery with an acquisition date of August 31, 2020. Superior data quality and minimal cloud interference guided the selection of this specific scene. Furthermore, a digital elevation model (DEM) offered a detailed representation of the land surface in order to derive essential terrain attributes such as slope, aspect, and elevation. The Alaska Satellite Facility (ASF) Distributed Active Archive Center (DAAC) provided the ALOS DEM data. This dataset maintained a spatial resolution of 12.5 m × 12.5 m per cell.
The movement of water across the terrestrial surface is governed by slope. This variable remains a critical factor in hydrological processes. High slope or steep terrain promotes streamflow. Conversely, a higher potential for water ponding exists in flat terrain with a low slope. Slope direction is indicated by aspect (Fig. 2). Both variables appear simultaneously in this visualization where hue represents aspect categories and saturation defines the various slope classes.
Methodological procedure
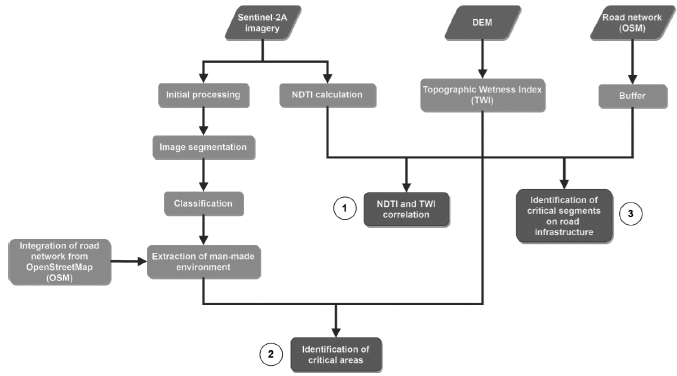
The methodology implemented to detect and extract regions prone to rainfall water accumulation is presented in Figure 3.
Tools
QGIS served as the primary tool for this study. It is a free and open-source Geographic Information System that supports the creation, editing, visualization, and publication of geospatial data [31]. Specifically, it was used for digital processing of the Sentinel-2 imagery and the DEM. In addition, the System for Automated Geoscientific Analyses (SAGA), a cross-platform open-source GIS software, was utilized for topographic index calculations. The Orfeo Toolbox (OTB), an open-source project designed for processing remote sensing data [32], was employed for image classification. Python was used for statistical analysis. Finally, spatial analysis, accuracy assessment, and visualization were also carried out in QGIS.
Calculation of indices and statistical analysis
NDTI calculation
Normalized Difference Tillage Index (NDTI) is a spectral index that can effectively highlight man-made surfaces and distinguish them from bare land [33]. In order to calculate NDTI, the SWIR sentinel-2 spectral bands (SWIR 1 and SWIR 2) were exploited [33][34]. The mathematical formula related to NDTI is the following:
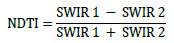
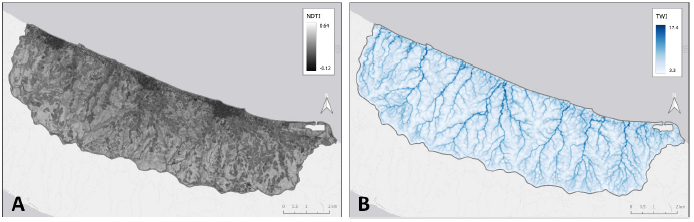
NDTI values close to zero correspond to man-made surfaces (Fig. 4 A). This observation led to the exploitation of this specific feature to investigate the relationship between NDTI and TWI.
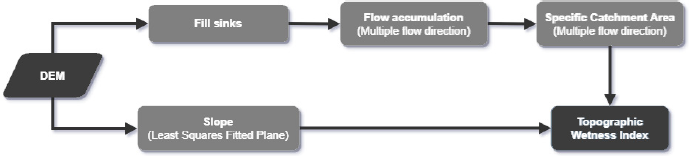
TWI calculation
A map presenting the distribution of TWI is a key element for spatially identifying areas with increased potential to generate surface runoff [27]. Initially, sinks were filled to eliminate areas of artificial depressions. This is a common procedure to perform any hydrological procedures. The depressionless DEM was used as input to compute the flow accumulation map. This comprises the total catchment area (TCA). Subsequently, the specific catchment area (SCA) was computed using the filled DEM and the TCA as input and considering the slope map of the studied area (In order to avoid errors, the unit of slope was set in radians). SCA and slope maps were used as input to calculate the TWI map. The exact methodological framework is presented in Figure 5.
The generated TWI is a raster layer that depicts areas with drainage depressions where water is likely to accumulate. TWI values are relative within the specific study area and cannot be compared with a different study area or when alternate datasets are utilized. Low TWI values are associated with areas of steep slope and indicate decreased potential for ponding development; high values are encountered in places with gentle local slope, where greater upslope areas are drained and there is increased runoff potential [21][23][25]. TWI values are non-dimensional and differentiate on the basis of the topographic profile of the area and the resolution of DEM. Common TWI values range from -3 to 30. The threshold value of TWI that discriminates low-risk from high-risk areas is determined manually by the user [21]. In this study, the threshold value was set by reviewing the histogram of TWI values and their relationship to the local topography. In order to avoid the scenario when single “wet” pixels are surrounded by “dry” areas, a smoothing procedure was carried out. The Gaussian filter from SAGA GIS was applied to make the final product easier to interpret. TWI values ranged from 3.3 to 17.4 (Fig. 4 B). Following a comprehensive review of TWI, the threshold value was set to 9. Thus, areas with TWI values greater than 9 were characterized as critical.
NDTI and TWI correlation
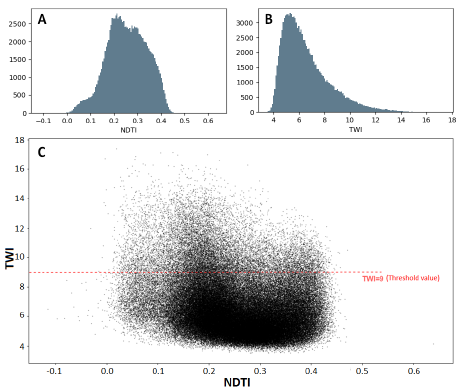
In some cases, investigating the relationship between two raster datasets may provide valuable information. For this reason, the relationship between NDTI and TWI was investigated. In order to achieve that, the TWI raster layer was resampled to adjust its spatial resolution. Next, the correlation matrix was computed, which depicts the values of the correlation coefficients. The correlation between two raster layers comprises a measure of dependency between the layers. A negative correlation value (-0.24) was calculated. This means that TWI changes inversely to NDTI. In other words, low NDTI values (man-made environment) correspond to high TWI values (areas prone to water accumulation).
Subsequently, a raveling procedure was carried out to produce one-dimensional arrays with a length of columns times rows. Ensuring that the raster data have the same number of columns and rows, prevents the extraction of incorrect results. Finally, the histograms (Fig. 6 A and B) and a scatter plot (Fig. 6 C) of the raveled data were produced. High NDTI values mainly correspond to low TWI values, while in the upper left part of the graph a significant number of points with low NDTI values (man-made environment) and high TWI vales (areas prone to water accumulation) can be identified. These observations highlight the need for spatial detection of areas prone to water accumulation.
Results
Satellite imagery processing
Initial processing of Sentinel-2A imagery includes resampling the 20 m bands to 10 m, clipping the scene to the boundaries of the area of interest and concatenating the spectral bands to produce a single stacked image.
The raster file generated from the initial processing of the Sentinel-2 imagery was used as input for the segmentation procedure. Image segmentation was performed using the Terminus QGIS plugin [35], a fast and straightforward tool that enables image segmentation on remote sensing data.
For the purpose of this study, the Felzenszwalb image segmentation algorithm was employed. In addition, mean and standard deviation statistics were included in the attribute table of the output vector file. Given that the aim of image segmentation is to extract internally homogeneous regions, the acceptance criterion for the segmentation results was the achievement of low standard deviation values. The segmentation process resulted in slight over-segmentation, which is preferable to under-segmentation, as splitting segments posteriori is more complex than merging them (Fig. 7).

Land cover is a key factor associated with water accumulation events, as natural and man-made land cover types differ significantly in terms of infiltration capacity. To produce a land cover map, object-based classification was carried out, with the aim of assigning a class label to each segment. The mean and standard deviation statistics served as optimal indicators for extracting land cover information and were therefore utilized throughout the classification process.
In this study, the Support Vector Machine (SVM) classification algorithm, available in the Orfeo ToolBox (OTB), was employed. SVM has demonstrated its effectiveness in numerous remote sensing studies [36]. As a supervised machine learning algorithm, it has been tested and compared against various classification approaches, and the results consistently show that it produces enhanced classification outputs with higher accuracy. Thus, it represents a robust methodological choice [16][37].
To train the SVM classifier, three fundamental thematic land cover classes were defined a priori: forest and vegetated areas, agricultural areas, and the man-made environment. This class scheme was adopted due to the study’s primary focus on extracting the man-made environment. It should be noted that the narrow strip of sand adjacent to inhabited areas was integrated into the man-made environment class, given its limited width and spectral characteristics, which make discrimination difficult in Sentinel-2 imagery.
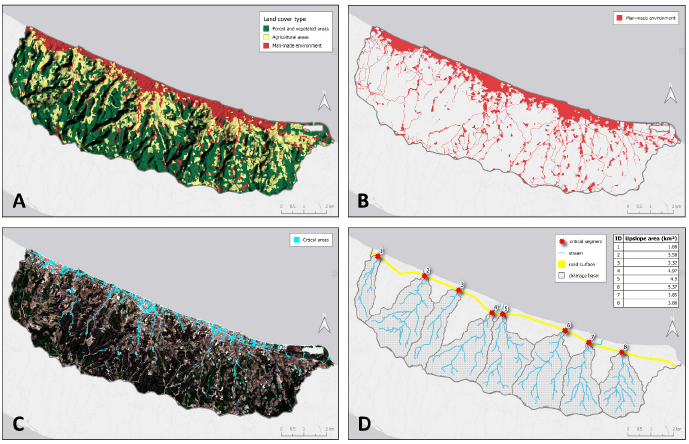
Several representative samples of confirmed land cover were selected from across the entire scene to train the classifier. The selection of training areas for each land cover class was based on personal knowledge of the study area and visual interpretation using fine spatial resolution satellite base maps. Following the application of the SVM classifier, a dissolve algorithm was implemented to merge features sharing the same classified value (i.e., belonging to the same class) and the final land cover map was obtained (Fig. 8 A).
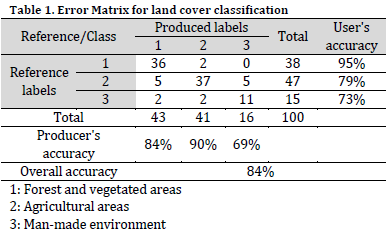
Quantitative accuracy assessment of the obtained classification results was carried out in AcATaMa QGIS plugin to investigate the validity of results. First, a simple random probability sampling design was implemented to estimate overall accuracy, user’s accuracy (commission error), and producer’s accuracy (omission error) and summarize them in a form of an error matrix. The sampling strategy was based on samples count and minimum distance between samples. Overall, 100 random samples were generated with a minimum distance of 50 m. Simple random selection is the proposed approach when working with imagery as a source of reference data or the sample size will need to be adjusted during the process of accuracy assessment [38]. The sources of reference data for this study were fine spatial resolution satellite base-maps that ensure the high quality of samples. The classification is excellent at distinguishing Forest from Non-Forest cover, but it struggles to cleanly separate Agriculture from Man-made environments, leading to significant confusion in Class 3 (man-made environment). This discrepancy is mainly attributed to the rural characteristics of the study area, which, under the satellite imagery resolution, might have caused confusion in man-made environment detection using conventional classification algorithms [39]. However, the overall accuracy was 84% (Table 1), which is above the 80% threshold recognized as a benchmark for landcover image classification [40].
Extraction of man-made environment
Man-made environment obtained from the classification procedure includes built-up areas and parts of the road transportation network. As mentioned before, and considering the spatial resolution of sentinel-2 imagery and the rural character of the area, unpaved roads with parts of the main road network were not adequately identified. Thus, the road network was obtained from the freely available OpenStreetMap dataset and was integrated into the man-made classified land cover (Fig. 8 B). A 5 m buffer zone was created around the linear road features.
Identification of areas prone to water accumulation
In order to identify the parts of man-made environment that are prone to rainfall water accumulation, the clip feature was utilized. A new thematic layer was created that includes a geographic subset of man-made features with the preassigned TWI>9 threshold value (Fig. 6 C). The analysis showed that these areas comprise 19.5% of total man-made environment (Fig. 8 C). The majority of these vulnerable zones are concentrated in the flatter low-lying portions of the drainage basin (Fig. 2), where gentle slopes reduce surface runoff velocity and promote infiltration.
Identification of critical segments on road infrastructure
It is commonly accepted that water accumulation can adversely affect road and transport infrastructure. Α secondary road passes through the study area, where high volumes of traffic are encountered, especially during the summer. Thus, the parts of the road with high TWI values (over 9) were identified. Overall, 21% of the road surface is related to high TWI values, which means that it is susceptible to water accumulation.
These critical parts of the road intersect with the stream network of the study area. In order to investigate the magnitude of the situation, further analysis was carried out. Initially, the stream network was extracted from the DEM. Next, the intersections between the road and the most important streams were identified. Finally, for each critical road segment, the upslope contributing area was calculated. This area includes the total runoff that corresponds to each critical road segment (Fig. 8 D), highlighting specific locations where targeted drainage improvements would be most effective in mitigating flood risk.
Discussion
The methodology presented in this study offers a scalable and efficient framework that can be readily integrated into broader flood risk management strategies, aligning with contemporary geo-computational approaches for disaster resilience [41]. By pinpointing specific zones where man-made infrastructure intersects with high water accumulation potential, the analysis provides planners with a powerful visual and quantitative tool. This information is invaluable not only for prioritizing targeted drainage improvements in existing developments but also for guiding the strategic site selection of future infrastructure projects and the responsible planning of new residential areas to avoid high-risk zones from the outset.
However, the accuracy and level of detail of this approach are inherently dependent on the spatial resolution of the underlying Digital Elevation Model (DEM), as it directly governs the quality of the derived Topographic Wetness Index (TWI). Research consistently demonstrates that DEM resolution significantly influences slope, drainage area, and TWI calculations, with coarser resolutions failing to capture microtopographic features critical for accurate hydrological modeling [42][43]. The analysis would undoubtedly benefit from a high-resolution DEM derived from Light Detection and Ranging (LiDAR) data, which captures microtopographic elements—such as hedgerow banks, roads, and agricultural drains—that act as topographic barriers or channels diverting overland flow [42].
Furthermore, while TWI is effective for initial topographic wetness assessment, a comprehensive flood risk evaluation must integrate non-topographical variables. Factors such as soil hydrological properties, vegetation cover, degree of antecedent saturation, and evapotranspiration play a crucial role [42], particularly in the flatter low-lying areas identified in this study as vulnerable zones. In such landscapes, where topographic relief is minimal, the standard TWI formulation inherently struggles, as it relies primarily on slope and upstream contributing area. Therefore, TWI should serve as a valuable preliminary guide for more in-depth, process-based modeling rather than a definitive standalone predictor. Additionally, broader landscape changes, especially vegetation loss and deforestation, must be considered as they can significantly reduce evapotranspiration and increase surface runoff, thereby elevating flood risk and altering flood dynamics [44].
In the context of operational flood management, an approach that balances accuracy with timeliness is paramount. This study demonstrates the feasibility of using freely available Sentinel-2 and DEM data to efficiently detect areas susceptible to water accumulation. By adopting an object-based image analysis (OBIA) approach—which leverages not just pixel values but also their spectral context, including mean, variance, and standard deviation—a more precise and thematically rich land cover inventory can be obtained. Object-oriented methods have been shown to outperform traditional pixel-based classification, particularly in complex environments where distinguishing between built-up and vegetated areas is critical for accuracy [45]. Ultimately, this research underscores the effectiveness of integrating remote sensing and GIS techniques to conduct a spatial analysis that is both practical and sufficiently detailed for supporting informed decision-making in flood-prone environments.
Conclusion
In this work, a methodological framework for identifying rainfall water accumulation zones was successfully completed through the integration of open-source geospatial tools, ALOS digital elevation model data, and Sentinel-2A imagery. The man-made environment of Kassandra, Greece, served as the primary focus for this analysis. Zones characterized by high Topographic Wetness Index values were found to intersect 19.5% of the total man-made environment and 21% of the road network. Such data facilitates the guidance of risk mitigation strategies and informs future development initiatives. While cost-effective flood susceptibility mapping can be achieved using freely available data—as evidenced by the notable 84% classification accuracy—significant opportunities for model refinement exist. Future investigations should focus on assimilating high-resolution LiDAR topography and additional hydrological parameters. Crucially, key physical factors such as rainfall characteristics and soil infiltration capacity remain to be integrated to develop fully comprehensive, probabilistic flood hazard assessments.
Conflict of interest statement
The author declared no conflict of interest.
Funding statement
The author declared that no funding was received in relation to this manuscript.
Data availability statement
The author declared that all data sources and software are cited in the text.
References
- Mojaddadi H, Pradhan B, Nampak H, Ahmad N, Ghazali AHB. Ensemble machine-learning-based geospatial approach for flood risk assessment using multi-sensor remote-sensing data and GIS. Geomat. Nat. Hazards Risk. 2017;8(2):1080-102. DOI
- Samanta S, Pal DK, Palsamanta B. Flood susceptibility analysis through remote sensing, GIS and frequency ratio model. Appl. Water Sci. 2018;8(2):66. DOI
- Tien Bui D, Khosravi K, Shahabi H, Daggupati P, Adamowski J, Melesse AM, Thai Pham B, Pourghasemi H, Mahmoudi M, Bahrami S. Flood Spatial Modeling in Northern Iran Using Remote Sensing and GIS: A Comparison between Evidential Belief Functions and Its Ensemble with a Multivariate Logistic Regression Model. Remote Sens. 2019;11(13):1589. DOI
- Kalantari Z, Cavalli M, Cantone C, Crema S, Destouni G. Flood probability quantification for road infrastructure: Data-driven spatial-statistical approach and case study applications. Sci. Total Environ. 2017;581-582:386-98. DOI
- Pregnolato M, Ford A, Wilkinson SM, Dawson RJ. The impact of flooding on road transport: A depth-disruption function. Transp. Res. Part D Transp. Environ. 2017;55:67-81. DOI
- Blaschke T, Hay GJ, Kelly M, Lang S, Hofmann P, Addink E, Queiroz Feitosa R, van der Meer F, van der Werff H, van Coillie F. Geographic Object-Based Image Analysis – Towards a new paradigm. ISPRS J. Photogramm. Remote Sens. 2014;87:180-91. DOI
- Chehata N, Orny C, Boukir S, Guyon D, Wigneron J. Object-based change detection in wind storm-damaged forest using high-resolution multispectral images. Int. J. Remote Sens. 2014;35(13):4758-77. DOI
- Derivaux S, Forestier G, Wemmert C, Lefèvre S. Supervised image segmentation using watershed transform, fuzzy classification and evolutionary computation. Pattern Recognit. Lett. 2010;31(15):2364-74. DOI
- Hay GJ, Castilla G. Object-based image analysis: Strengths, weaknesses, opportunities and threats (SWOT). In: Proceedings of 1st International Conference on Object-Based Image Analysis – Bridging Remote Sensing and GIS. Vol. XXXVI. Salzburg: Salzburg University. 2006.
- Lang S. Object-based image analysis for remote sensing applications: modeling reality–dealing with complexity. In: Object-based image analysis: Spatial concepts for knowledge-driven remote sensing applications. Berlin, Heidelberg: Springer Berlin Heidelberg. 2008:3-27. DOI
- Moskal LM, Styers DM, Halabisky M. Monitoring Urban Tree Cover Using Object-Based Image Analysis and Public Domain Remotely Sensed Data. Remote Sens. 2011;3(10):2243-62. DOI
- Navulur K. Multispectral image analysis using the object-oriented paradigm. CRC press. 2006.
- Nussbaum S, Menz G. Object-based image analysis and treaty verification: new approaches in remote sensing-applied to nuclear facilities in Iran. Springer Science & Business Media. 2008. DOI
- Cheng G, Han J. A survey on object detection in optical remote sensing images. ISPRS J. Photogramm. Remote Sens. 2016;117:11-28. DOI
- Blaschke T, Burnett C, Pekkarinen A. Image Segmentation Methods for Object-based Analysis and Classification. In: Remote Sensing and Digital Image Processing. Springer Netherlands. 2004. DOI
- Thenkabail PD, Prasad S. Remotely sensed data characterization, classification, and accuracies. Taylor & Francis Group, LLC. 2015.
- Kotaridis I, Lazaridou M. Remote sensing image segmentation advances: A meta-analysis. ISPRS J. Photogramm. Remote Sens. 2021;173:309-22. DOI
- Belgiu M, Csillik O. Sentinel-2 cropland mapping using pixel-based and object-based time-weighted dynamic time warping analysis. Remote Sens. Environ. 2018;204:509-23. DOI
- Zhang H, Li Q, Liu J, Du X, Dong T, McNairn H, Champagne C, Liu M, Shang J. Object-based crop classification using multi-temporal SPOT-5 imagery and textural features with a Random Forest classifier. Geocarto Int. 2017;33(10):1017-35. DOI
- Zhong L, Hu L, Zhou H. Deep learning based multi-temporal crop classification. Remote Sens. Environ. 2019;221:430-43. DOI
- Ballerine C. Topographic wetness index urban flooding awareness act action support, Will & DuPage Counties, Illinois. ISWS Contract Report CR-2017-02. 2017.
- Kopecký M, Macek M, Wild J. Topographic Wetness Index calculation guidelines based on measured soil moisture and plant species composition. Sci. Total Environ. 2021;757:143785. DOI
- Mattivi P, Franci F, Lambertini A, Bitelli G. TWI computation: a comparison of different open source GISs. Open Geospat. Data Softw. Stand. 2019;4(1):6. DOI
- Pourali SH, Arrowsmith C, Chrisman N, Matkan AA, Mitchell D. Topography Wetness Index Application in Flood-Risk-Based Land Use Planning. Appl. Spat. Anal. Policy. 2014;9(1):39-54. DOI
- Nandi A, Mandal A, Wilson M, Smith D. Flood hazard mapping in Jamaica using principal component analysis and logistic regression. Environ. Earth Sci. 2016;75(6):465. DOI
- Motevalli A, Vafakhah M. Flood hazard mapping using synthesis hydraulic and geomorphic properties at watershed scale. Stoch. Environ. Res. Risk Assess. 2016;30(7):1889-900. DOI
- Koriche SA, Rientjes TH. Application of satellite products and hydrological modelling for flood early warning. Phys. Chem. Earth Parts A/B/C. 2016;93:12-23. DOI
- Aksoy H, Kirca VSO, Burgan HI, Kellecioglu D. Hydrological and hydraulic models for determination of flood-prone and flood inundation areas. Proc. Int. Assoc. Hydrol. Sci. 2016;373:137-41. DOI
- Bornovas J, Rondoyanni-Tsiambaou T. Geological map of Greece. Scale: 1: 500,000. Athens: Institute of Geology and Mineral Exploration. 1983.
- Kastridis A, Stathis D. The Effect of Rainfall Intensity on the Flood Generation of Mountainous Watersheds (Chalkidiki Prefecture, North Greece). In: Springer Atmospheric Sciences. Springer International Publishing. 2016. DOI
- Rosas-Chavoya M, Gallardo-Salazar JL, López-Serrano PM, Alcántara-Concepción PC, León-Miranda AK. QGIS a constantly growing free and open-source geospatial software contributing to scientific development. Cuad. Investig. Geogr. 2022;48(1):197-213. DOI
- Grizonnet M, Michel J, Poughon V, Inglada J, Savinaud M, Cresson R. Orfeo ToolBox: open source processing of remote sensing images. Open Geospat. Data Softw. Stand. 2017;2(1):15. DOI
- Ettehadi Osgouei P, Kaya S, Sertel E, Alganci U. Separating Built-Up Areas from Bare Land in Mediterranean Cities Using Sentinel-2A Imagery. Remote Sens. 2019;11(3):345. DOI
- dos Santos NV, Demattê JAM, Silvero NEQ. Improving the monitoring of sugarcane residues in a tropical environment based on laboratory and Sentinel-2 data. Int. J. Remote Sens. 2020;42(5):1768-84. DOI
- Kotaridis I, Lazaridou M. Terminus plugin (QGIS). 2020 [Accessed in 2021 Mar 20]. Available from: Link
- De Luca G, N. Silva JM, Cerasoli S, Araújo J, Campos J, Di Fazio S, Modica G. Object-Based Land Cover Classification of Cork Oak Woodlands using UAV Imagery and Orfeo ToolBox. Remote Sens. 2019;11(10):1238. DOI
- Kavzoglu T, Tso B, Mather PM. Classification methods for remotely sensed data. CRC press. 2024.
- Olofsson P, Foody GM, Herold M, Stehman SV, Woodcock CE, Wulder MA. Good practices for estimating area and assessing accuracy of land change. Remote Sens. Environ. 2014;148:42-57. DOI
- Zhang K, Fiwa L, Kurata M, Okazawa H, Luweya KA, Mandal MSH, Sakai T. Precise LULC classification of rural area combining elevational and reflectance characteristics using UAV. Sci. Afr. 2024;26:e02431. DOI
- Ma L, Li M, Ma X, Cheng L, Du P, Liu Y. A review of supervised object-based land-cover image classification. ISPRS J. Photogramm. Remote Sens. 2017;130:277-93. DOI
- Jain H. Leveraging geo-computational innovations for sustainable disaster management to enhance flood resilience. Discov. Geosci. 2024;2(1):33. DOI
- Hasan A, Pilesjö P, Persson A. On generating digital elevation models from lidar data – resolution versus accuracy and topographic wetness index indices in northern peatlands. Geod. Cartogr. 2012;38(2):57-69. DOI
- Thomas I, Jordan P, Shine O, Fenton O, Mellander P, Dunlop P, Murphy P. Defining optimal DEM resolutions and point densities for modelling hydrologically sensitive areas in agricultural catchments dominated by microtopography. Int. J. Appl. Earth Obs. Geoinf. 2017;54:38-52. DOI
- Oo TZ, Humphries UW. Hydrological modeling of flood impacts under land use and land cover change: A systematic review of tools, trends, and challenges. MethodsX. 2026;16:103724. DOI
- Titilade AS. Comparative Assessment of Pixel-Based and Object-Oriented Classification Techniques using Sentinel-2 Imagery of the Federal University of Technology, Akure (FUTA) Campus. J. Spat. Inf. Sci. 2025;2(3).
Cite this article:
Kotaridis, I. Integrating remote sensing and topographic modeling to identify rainfall-induced water accumulation zones in man-made environment of Kassandra, Greece. DYSONA – Applied Science, 2026;7(2): 243-54. doi: 10.30493/das.2026.013103