
A decadal analysis of land surface temperature dynamics in response to urban expansion and vegetation loss in Faridpur
Saikat Dey Munna 1*; Sajjad Hussain 2
1, Department of Urban and Regional Planning, Khulna University of Engineering & Technology (KUET), Khulna, Bangladesh
2, Department of Environmental Sciences, COMSATS University Islamabad, Vehari Campus, 61100, Islamabad, Punjab, Pakistan
E-mail:
saikatdeym@gmail.com
Received: 25/04/2026
Acceptance: 13/08/2026
Available Online: 14/08/2026
Published: 01/01/2027

Manuscript link
http://dx.doi.org/10.30493/DAS.2026.011408
Abstract
Land-atmosphere interactions, urban thermal environments, and the impacts of land-use and land-cover (LULC) alterations are effectively grasped through the precise measurement of land surface temperature (LST). In this work, Landsat-8 OLI/TIRS imagery from 2014 and 2024 was utilized to track ten-year variations in LST and plant health across Faridpur District of Bangladesh. Supervised classification was used to categorize the landscape into four specific LULC categories: vegetation, bare soil, built-up areas, and water bodies. Each examined year featured calculations for both LST and the Normalized Difference Vegetation Index (NDVI). Between 2014 and 2024, a massive urban expansion from 21.35% to 45.25% was recorded. Conversely, total vegetated area was reduced from 41.09% down to 25.87% over the same timeframe. A widespread surface warming pattern was clearly established by the thermal metrics. Specifically, the regional maximum LST increased from 42.69 °C to 45.33 °C, alongside a minimum LST increase from 15.55 °C to 21.31 °C. The deterioration of thick ecological canopies was signaled by a drop in peak NDVI scores from 0.999 to 0.883 over the past decade. Built-up and bare-soil surfaces primarily showed the highest LST values, according to spatial mapping. Meanwhile, cooler microclimates were sustained by water-covered zones and vegetated patches. These outcomes highlight the urgency of conserving green cover in Faridpur. Moreover, establishing small-scale urban green areas in the rapidly expanding towns and cities across the region is necessary to counteract the thermal consequences of ongoing urbanization.
Keywords: Land surface temperature, LULC, Urban expansion, Vegetation
Introduction
Land Surface Temperature (LST), defined as the radiometric temperature of the Earth’s surface derived from satellite-based thermal sensors, is a fundamental variable for analyzing surface-atmosphere energy exchanges, urban climatology, and the thermal impacts of land use and land cover (LULC) transformations [1]. Spatial variability in LST arises due to differences in surface properties such as emissivity, heat storage capacity, and evapotranspiration among various land cover types, including vegetation, impervious surfaces, bare soil, and water bodies. Long-term monitoring using satellite-derived thermal data has established LST as a core variable for tracking environmental change across diverse landscapes over time [2]. Previous studies have consistently shown that the reduction of vegetative cover and the expansion of impervious surfaces significantly increase LST, thereby intensifying the Urban Heat Island (UHI) effect [3]. Comparable evidence from rapidly developing cities confirms that unmanaged urban growth similarly elevates thermal loads and adverse microclimatic conditions [4].
Remote sensing has become a widely adopted approach for mapping LULC and retrieving LST over large areas using medium-resolution satellite imagery such as Landsat [5]. The Landsat-8 OLI/TIRS sensor provides thermal infrared data suitable for computing LST with reasonable spatial detail at 30 m resolution [6]. Alternative single-channel and mono-window algorithms have also been developed to retrieve LST directly from a single thermal band, which is the configuration available for Landsat-8 TIRS Band 10 [7]. Its operational continuity since 2013 makes it particularly valuable for temporal change detection spanning more than a decade.
The relationship between LULC transformation and LST has been extensively documented in rapidly urbanizing regions [8]. In Bangladesh, unplanned urban expansion, coupled with the loss of green spaces and wetlands, has contributed to increasing surface temperatures and aggravated UHI conditions in major cities [9]. Cellular Automata-Artificial Neural Network (CA-ANN)-based modelling in Dhaka has shown that continued conversion of vegetated and water surfaces into built-up land is likely to intensify LST hotspots in the coming decades [10]. These changes are particularly critical in developing countries, where rapid land transformation often occurs without adequate environmental planning [11].
Vegetation plays a vital role in mitigating surface temperature through evapotranspiration, shading, and albedo regulation [12]. Numerous empirical studies have established a strong inverse relationship between the Normalized Difference Vegetation Index (NDVI) and LST, indicating that areas with dense vegetation tend to exhibit lower surface temperatures [13]. This relationship highlights the importance of preserving and enhancing urban and peri-urban green infrastructure to regulate thermal environments [14]. Supervised maximum likelihood classification (MLC) has been extensively used to produce accurate LULC maps from Landsat data due to its statistical robustness and ease of implementation in platforms such as Google Earth Engine (GEE) [15]. GEE has increasingly been adopted for large-area land cover mapping and environmental monitoring owing to its cloud computing infrastructure and freely accessible satellite archives [16].
Despite a growing body of research on LST-LULC interactions, limited attention has been given to district-level analyses in semi-urban and rural transitional regions of Bangladesh. Faridpur District represents a compelling case study due to its ongoing rural-urban transformation, characterized by expanding agricultural activities, infrastructural development, reduction in water bodies, and evolving land cover patterns [8]. Comparable floodplain districts elsewhere in Bangladesh show that the loss of surface water bodies is closely linked to localized LST increases, underscoring the relevance of monitoring water body change alongside vegetation and built-up dynamics [17]. Consequently, a decadal analysis of LST in relation to NDVI and LULC can provide critical insights for developing thermally adaptive and climate-resilient land management strategies [3].
In this context, the present study utilizes Landsat-8 OLI/TIRS imagery in 2014 and 2024 to analyze Faridpur District with three primary objectives: (i) to characterize temporal changes in LULC patterns, (ii) to quantify spatial and temporal variations in LST and NDVI [6], and (iii) to examine the relationship between vegetation density and surface temperature. The findings are expected to support evidence-based planning and sustainable land management strategies in order to mitigate thermal stress and improve environmental resilience in rapidly transforming landscapes.
Material and Methods
Description of the study area
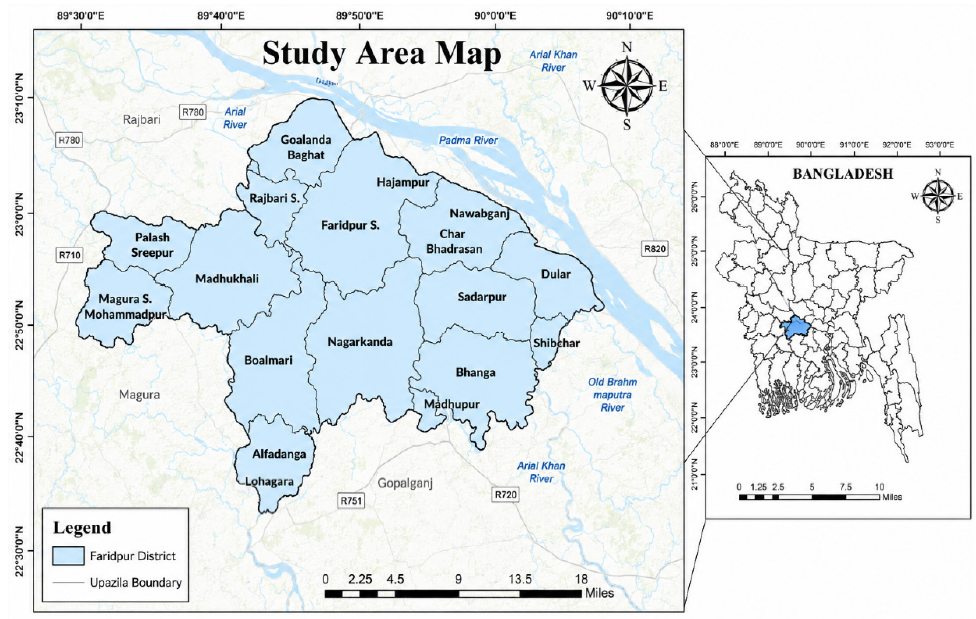
Faridpur District, located in central Bangladesh within the Padma River floodplain, covers approximately 2,033 km² (Fig. 1). The area experiences a tropical monsoon climate, characterized by hot, humid summers, a distinct rainy season, and mild winters. Its economy is largely agrarian, with rice and jute cultivation alongside fisheries and small-scale trade. Due to its dynamic floodplain setting, Faridpur is highly vulnerable to seasonal flooding, riverbank erosion, and climate variability, which significantly influence LULC, vegetation dynamics, and LST. These characteristics render the district a suitable case study for analyzing the relationship between LULC change, vegetation indices, and surface thermal patterns using satellite remote sensing.
Data acquiring
To ensure reliable spatial comparison across the study period, satellite imagery with minimal to no cloud contamination was carefully selected for both 2014 and 2024 over Faridpur District (Table 1). Landsat-8 OLI/TIRS imagery (path 137, row 043) was utilized for both epochs to maintain methodological consistency. The 2014 image was acquired on 12 March 2014, and the 2024 image on 15 February 2024, both during the dry season to minimize the confounding effects of seasonal variability on vegetation phenology and soil moisture conditions. Data was sourced from the USGS Earth Explorer platform [18]. Prior to index computation, standard atmospheric correction procedures were considered to minimize the influence of atmospheric scattering and absorption on surface reflectance values [19].

Methodology
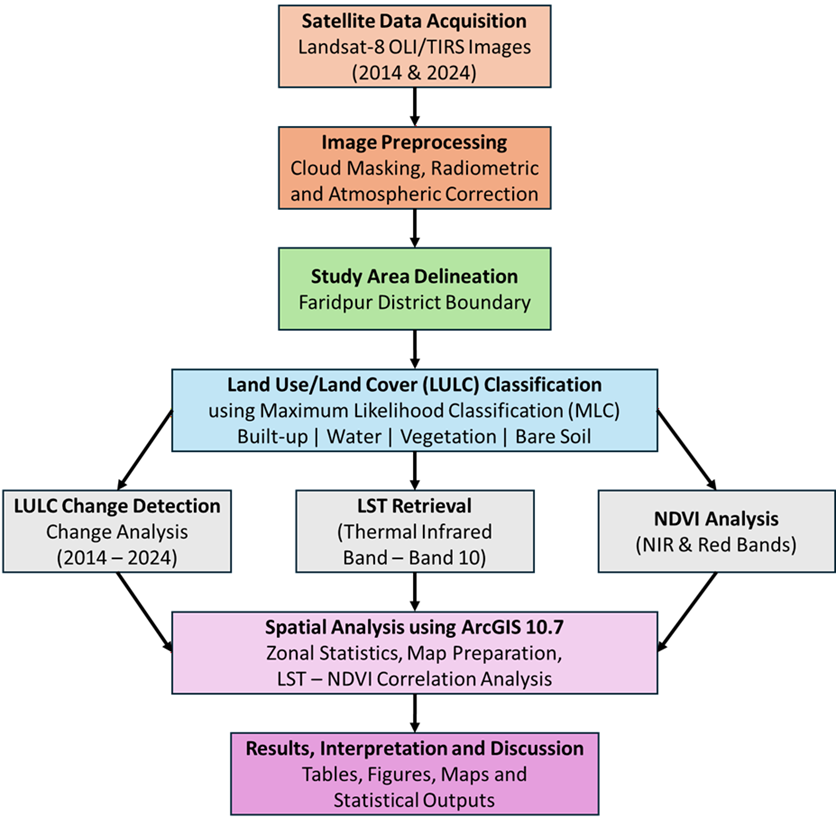
The district boundary shapefile of Faridpur was sourced from GitHub and subsequently integrated into Google Earth Engine (GEE) to delineate the spatial extent of the study area. Within the GEE platform, essential biophysical and environmental parameters (NDVI, LST, and LULC) were derived from satellite imagery. The resulting raster datasets were subsequently imported into ArcMap 10.7.1, where comprehensive spatial analyses were conducted, thematic maps were produced, and charts were constructed to facilitate visual interpretation of the findings. Satellite data were acquired from the USGS EarthExplorer [18]. The full workflow used in the current study is depicted in Figure 2.
Land cover maps
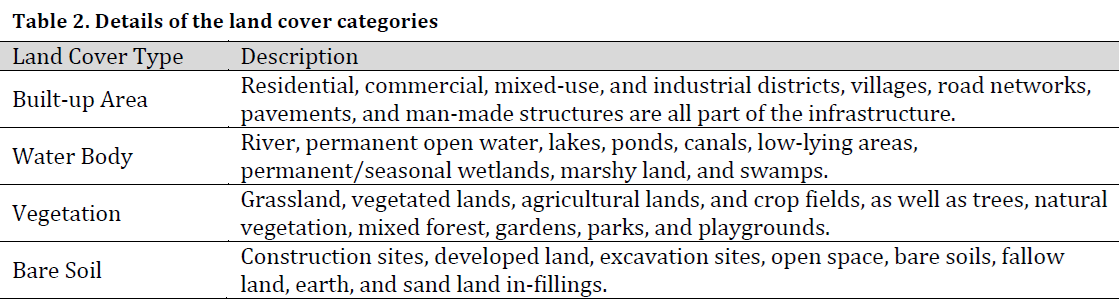
To classify land use and land cover (LULC) for 2014 and 2024, a supervised classification approach was applied [20]. Drawing on the spectral characteristics of the imagery and local knowledge of the Faridpur area, four mainland-cover categories were identified [21] (Table 2). Training samples for each class were prepared using high-resolution images and locally sourced reference data. These samples were then used to generate spectral signatures, which served as the basis for applying a maximum likelihood classifier (MLC), with equal prior probability assumed for all classes [22]. After classification, post-classification filtering was carried out to smooth class boundaries and remove isolated misclassified pixels [23]. The final classified maps for both years formed the foundation for the subsequent LULC change analysis. Although a full confusion-matrix-based accuracy assessment was beyond the scope of this decadal comparison, the classification followed established best-practice principles for evaluating thematic map reliability [24]. Training samples for each land cover class were prepared using high-resolution Google Earth imagery and local knowledge of the study area. A total of 100 ground truth sample points (25 samples for each of the four land cover classes) were used for training and validation of the supervised Maximum Likelihood Classification (MLC). The classification accuracy was assessed using an independent validation dataset. The classified map achieved an overall accuracy of 83.0% with a Kappa coefficient of 0.78, indicating good agreement and satisfactory classification performance for subsequent LULC change analysis.
NDVI calculation
To assess vegetation cover for both 2014 and 2024, the Normalized Difference Vegetation Index (NDVI) was derived using the red and near-infrared (NIR) spectral bands, as expressed in the following formula:
NDVI = (NIR − RED) / (NIR + RED)
Where NIR refers to the reflectance recorded in the near-infrared portion of the spectrum, and RED denotes reflectance captured in the visible red range. NDVI serves as a key indicator of vegetation presence and health by exploiting the contrasting response of vegetated surfaces, which strongly reflect near-infrared light while absorbing red light. The index produces values within the range of −1 to +1, where higher positive values indicate denser and healthier vegetation cover.
Land Surface Temperature (LST) extraction
For both 2014 and 2024 Landsat-8 imagery, LST was retrieved from the thermal infrared band (Band 10) in three main steps: conversion of raw digital numbers (DN) to spectral radiance, conversion of radiance to brightness temperature, and correction for surface emissivity [1]. This mono-window approach follows methodological precedents established for Landsat 8 data in other South Asian contexts [25].
Conversion of DN to spectral radiance:
Lλ = ML × Qcal + AL
where Lλ is the spectral radiance (W·m⁻²·sr⁻¹·μm⁻¹), ML and AL are the band-specific radiance multiplicative and additive scaling factors obtained from the metadata, and Qcal is the quantized calibrated pixel value (DN) .
Conversion of radiance to sensor brightness temperature:
T = K2 / ln(K1/Lλ + 1)
where T is the brightness temperature in Kelvin, and K1 and K2 are thermal conversion constants for the band taken from the metadata.
Estimation of land surface emissivity (LSE) using NDVI-based vegetation proportion:
Pv = (NDVI − NDVImin) / (NDVImax − NDVImin)
ε = 0.004Pv + 0.986
where Pv is the vegetation proportion and ε is the surface emissivity. The linear relationship between vegetation proportion and surface emissivity applied here follows the NDVI threshold method [26].
Conversion of brightness temperature to LST:
LST (K) = T / [1 + (λT/ρ) ln(ε)]
where λ is the effective wavelength of the thermal band (μm), and ρ = hc/σ = 1.438 × 10⁻² m·K, with h as Planck’s constant, c as the speed of light, and σ as the Boltzmann constant [27]. Finally, LST in Celsius was obtained as:
LST (°C) = LST (K) − 273.15
Results
Pattern of land cover changes
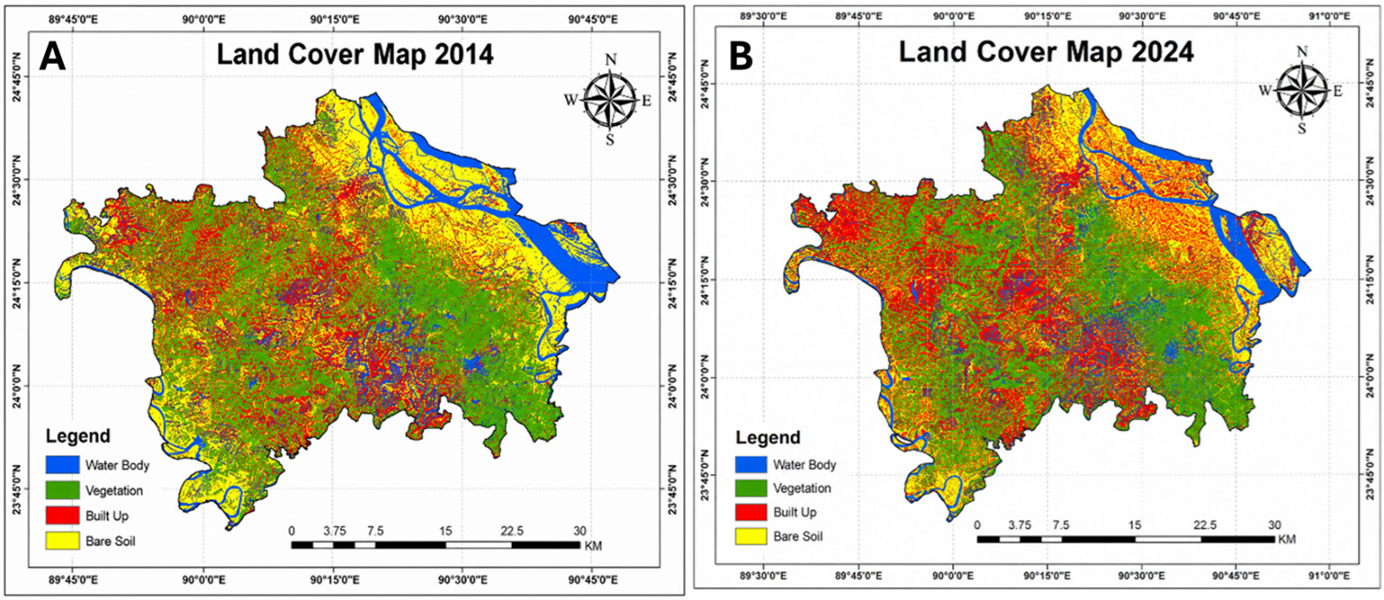
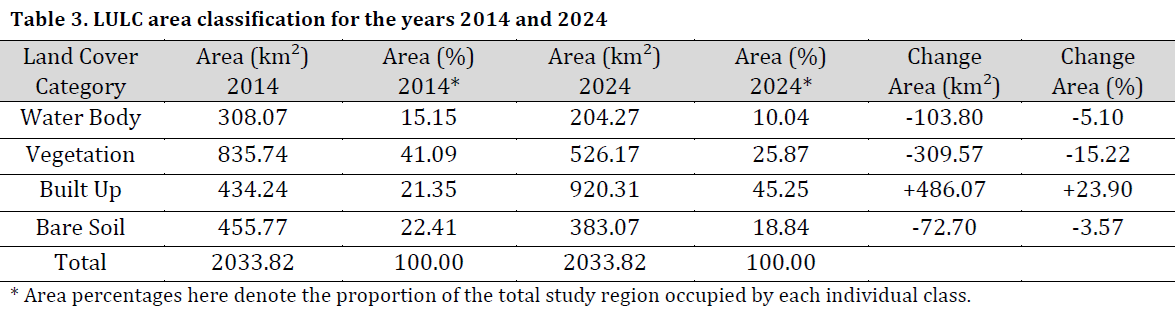
By comparing the obtained LULC maps of 2014 and 2024 (Fig. 3), the main land cover changes were deduced. Over the ten-year period, the built-up area expanded by approximately 486.07 Km2, adding 24% of the total study area. On the other hand, vegetated land experienced a decrease of about 309.57 Km2, which represent losing 15.22% of the total studied area previously classified as vegetated land to other classes. Similarly, water bodies experienced a notable reduction of 5.10% (Table 3). It is worth noting that 72.7 Km2 of barren land registered in 2014 were converted to other land cover categories, particularly built-up areas, as can be seen in the north-eastern zones adjacent to Padma River. Urban expansion in the central and north-western parts of the study area has exacted a different toll, with agricultural land bearing the brunt of the losses there (Fig. 3).
Land surface temperature (LST) changes
The spatial pattern of Land Surface Temperature (LST) across Faridpur District for 2014, showed that LST values spanned a range of roughly 15.55 °C to 42.69 °C (Fig. 4 A). Moderate to high temperatures prevailing across much of the district and relatively cooler surfaces confined to vegetated zones. By 2024, thermal conditions had worsened considerably, with LST values extending to a broader range of approximately 21.31 °C to 45.33 °C (Fig. 4 B). Areas of elevated temperature became more widespread and spatially concentrated, particularly over built-up zones and their surrounding fringes, while cooler surface patches experienced a slight contraction. This decade-long shift points to a general intensification of surface heating across the district, suggesting that continued urban expansion and the associated transformation of land cover have played a significant role in amplifying local thermal stress in Faridpur.
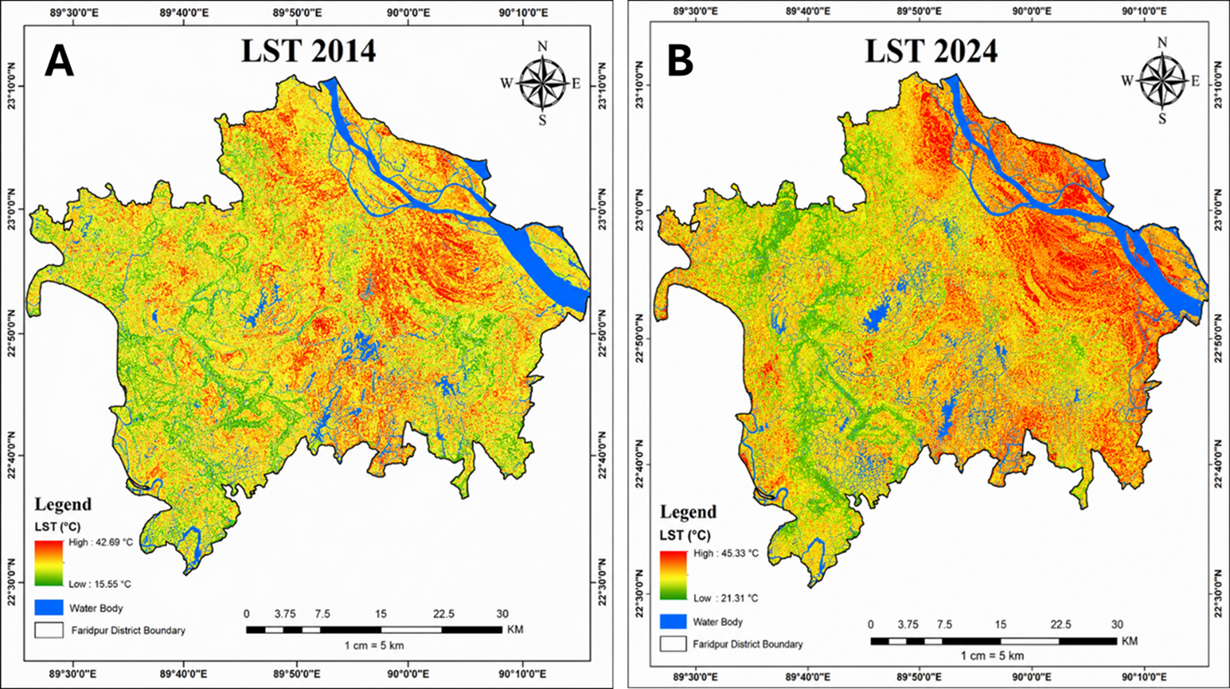
Figure 4. Spatial distribution land surface temperature (LST) variation in Faridpur District for the years 2014 (A) and 2024 (B)
Normalized Difference Vegetation Index (NDVI)
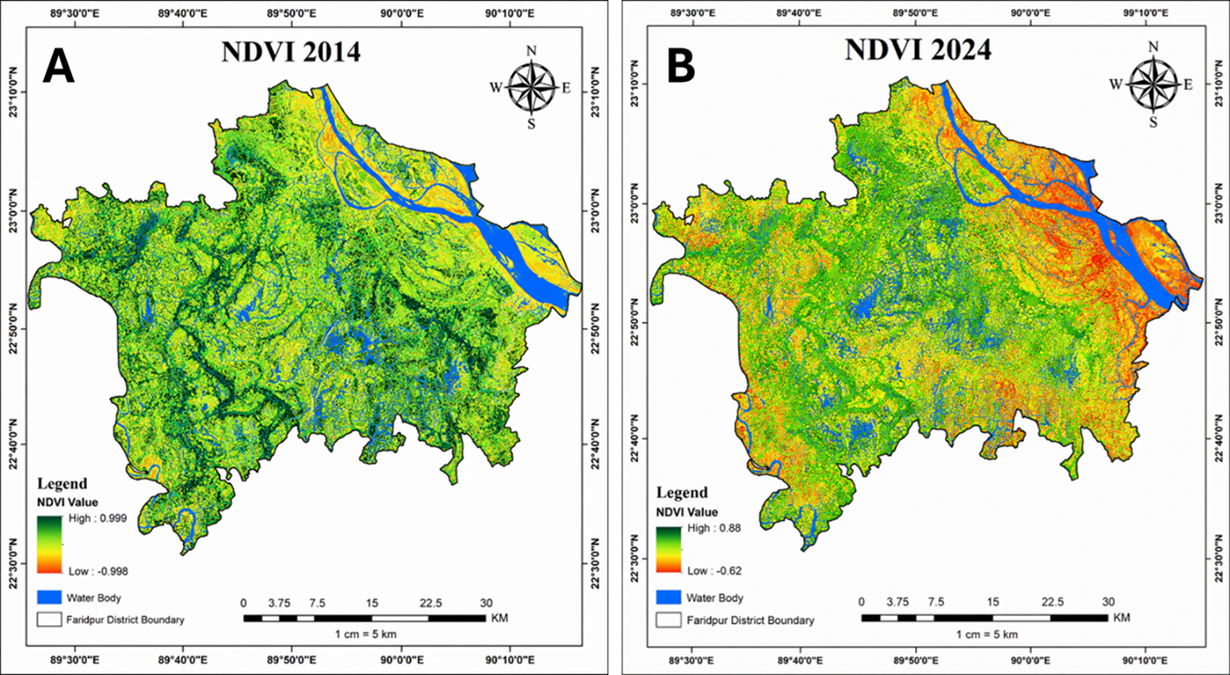
An analysis of NDVI values across Faridpur District over the ten-year period reveals notable shifts in vegetation cover and condition. In 2014, the maximum NDVI value of 0.999 indicated the presence of dense, healthy vegetation, while the minimum value of –0.998 corresponded to surfaces with little or no vegetation, such as bare land or water-covered areas (Fig. 5 A). By 2024, the peak NDVI had dropped to 0.883, reflecting a notable decline in the density and vitality of the densest vegetative cover across the district. The minimum NDVI of –0.618 recorded in 2024 still points to the existence of unvegetated or water-covered surfaces, though the extent of severely barren areas appeared to have diminished relative to 2014 (Fig. 5 B).
Discussion
The rise in Land Surface Temperature (LST) in study area, especially across urban zones, corresponds closely with the growing extent of impervious surfaces such as roads, buildings, and paved areas. This trend is consistent with findings from other rapidly urbanizing districts in Bangladesh and comparable South Asian contexts [28]. Similar warming trends associated with LULC change have been reported in Khulna City, located within the same south-western floodplain region as Faridpur [29]. Comparable relationships between urban expansion and surface warming have also been documented in rapidly growing cities outside South Asia, such as Greater Cairo, Egypt, reinforcing the generality of this pattern across diverse arid and sub-humid urbanizing regions [30]. Such land-cover transitions are also associated with measurable declines in the value of regulating ecosystem services provided by natural land cover, as documented for other rapidly urbanizing Bangladeshi districts [31].
The spatial distribution of land cover change across Faridpur District from 2014 to 2024 reveals the most prominent shift was the approximately 24% expansion of built-up areas, driven primarily by ongoing urbanization. Water bodies contracted by around 5%, a trend corroborated by similar studies documenting wetland loss in Bangladesh’s floodplain districts [32]. This contraction of water bodies is particularly relevant given that surface water strongly moderates adjacent LST, with even small water bodies shown to lower surrounding surface temperatures [33]. Vegetation cover, on the other hand, decreased by nearly 15%, suggesting that certain areas previously classified as vegetated areas gradually transitioned into built-up land. Taken together, these changes point to a pattern of rapid urban growth accompanied by shrinkage of green cover and water.
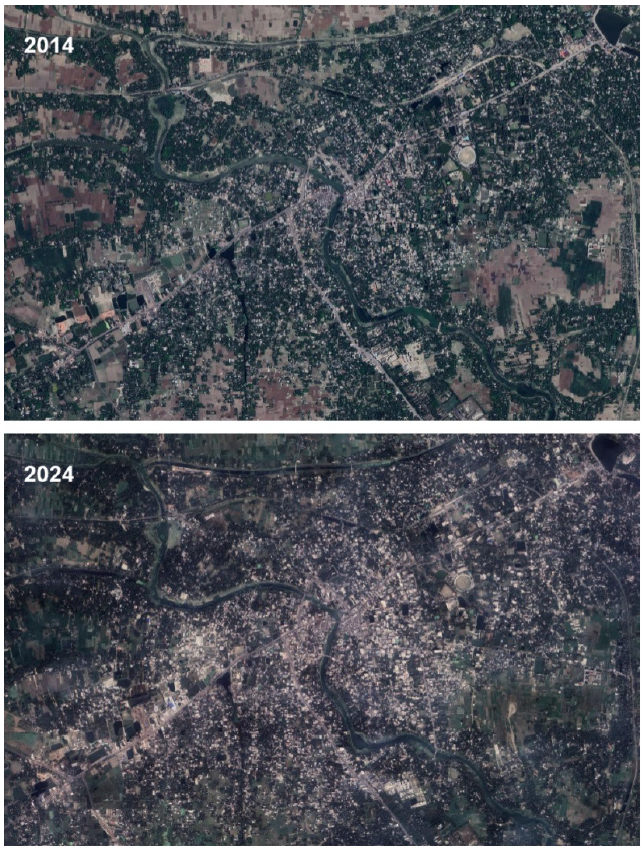
One of the principal developed zones exhibiting elevated land surface temperatures is Faridpur city, situated to the north of the study area. A comparative analysis of satellite imagery from 2014 and 2024 (Fig. 6) reveals a marked expansion of the urban extent over this period. The observed magnitude and pattern of warming closely parallel LST increases documented in nearby Rajshahi City over a comparable period, where built-up expansion likewise drove district-wide surface warming [34], and are consistent with decadal LST trends reported for the neighboring Kushtia District [35].
The overall decline in vegetated areas between 2014 and 2024 was accompanied by a notable decline in maximum NDVI from 0.999 to 0.883 suggesting a degradation of the densest canopy cover. This might be explained by the conversion of some mature forests or dense natural vegetation into agricultural land or sparse woody vegetation, with these areas (e.g., croplands or young plantations) have lower biomass and leaf area index [36].
To slow the ongoing rise in LST and avoid further environmental damage, nature-based green infrastructure should be prioritized. Recommended measures include urban tree planting, creating parks and green roofs, restoring degraded water bodies, and enforcing building restrictions in ecologically valuable vegetated areas. These actions can help lower surface temperatures, improve air quality, and make the district more resilient to climate change. Establishing small scale green spaces and planting shrubs in urban areas provides an affordable and practical way to manage and reverse the surface warming trend observed in Faridpur District [37]. Quantitative modelling tools such as the InVEST Urban Cooling Model [38] might offer a promising avenue for future work to design and prioritize green infrastructure interventions in Faridpur.
Conclusions
The analysis of land cover changes in Faridpur District showed that a 24% expansion of built-up areas replaced vegetated land and water bodies between 2014 and 2024. A sharp escalation in land surface temperatures was directly driven by this physical alteration. Expanding and dense clusters of thermal hotspots clearly demonstrate the heating effect accompanying this urban expansion in the district. Furthermore, this localized warming predominantly occurred across impervious surfaces and adjacent to major cities. Concurrently, failing vegetation health and density were indicated by the notable decrease in maximum NDVI values. The connection between land cover conversion and environmental warming is firmly supported by this biological decline over the past decade. These findings highlight the urgent need for targeted green infrastructure interventions to mitigate further thermal stress and ecological degradation in the district.
Conflict of interest statement
The authors declared no conflict of interest.
Funding statement
The authors declared that no funding was received in relation to this manuscript.
Data availability statement
The authors stated that all data sources used in this study are publicly accessible and have been cited in the text.
References
- Wang F, Qin Z, Song C, Tu L, Karnieli A, Zhao S. An Improved Mono-Window Algorithm for Land Surface Temperature Retrieval from Landsat 8 Thermal Infrared Sensor Data. Remote Sens. 2015;7(4):4268-89. DOI
- Solanky V, Singh S, Katiyar SK. Land Surface Temperature Estimation Using Remote Sensing Data. In: Water Science and Technology Library. Springer Singapore. 2018. DOI
- Miah MT, Fariha JN, Jodder PK, Al Kafy A, Raiyan R, Usha SA, Hossan J, Rahaman KR. Urban Heat Island and Environmental Degradation Analysis Utilizing a Remote Sensing Technique in Rapidly Urbanizing South Asian Cities. World. 2024;5(4):1023-53. DOI
- Weng Q, Yang S. Managing the adverse thermal effects of urban development in a densely populated Chinese city. J. Environ. Manag. 2004;70(2):145-56. DOI
- Sresto MA, Siddika S, Fattah MA, Morshed SR, Morshed MM. A GIS and remote sensing approach for measuring summer-winter variation of land use and land cover indices and surface temperature in Dhaka district, Bangladesh. Heliyon. 2022;8(8):e10309. DOI
- Rongali G, Keshari AK, Gosain AK, Khosa R. A mono-window algorithm for land surface temperature estimation from Landsat 8 thermal infrared sensor data: a case study of the Beas River Basin, India. Pertanika J. Sci. Technol. 2018;26(2):829-40.
- Jiménez‐Muñoz JC, Sobrino JA. A generalized single‐channel method for retrieving land surface temperature from remote sensing data. J. Geophys. Res. Atmos. 2003;108(D22):2003JD003480. DOI
- Akter T, Gazi MY, Mia MB. Assessment of Land Cover Dynamics, Land Surface Temperature, and Heat Island Growth in Northwestern Bangladesh Using Satellite Imagery. Environ. Processes. 2021;8(2):661-90. DOI
- Sheikh N, Popy S, Jihan MAT, Rasul G, Ansary AJ. Geospatial assessment of urban heat island and land use land cover dynamics in Khulna City corporation, Bangladesh. Theor. Appl. Climatol. 2026;157(4):237. DOI
- Kafy A-A, Dey NN, Al Rakib A, Rahaman ZA, Nasher NMR, Bhatt A. Modeling the relationship between land use/land cover and land surface temperature in Dhaka, Bangladesh using CA-ANN algorithm. Environ. Challenges. 2021;4:100190. DOI
- Islam R, Morshed R, Islam M, Alauddin M. Spatiotemporal Changes of Wetlands over Gazipur District Bangladesh: A GIS-Based Analysis. DUET J. 2025;10(1):167–74.
- Salam M, Islam MK, Jahan I, Chowdhury MA. Assessing the impacts of vegetation loss and land surface temperature on Surface Urban Heat Island (SUHI) in Gazipur District, Bangladesh. Comput. Urban Sci. 2024;4(1):24. DOI
- Weng Q, Lu D, Schubring J. Estimation of land surface temperature–vegetation abundance relationship for urban heat island studies. Remote Sens. Environ. 2004;89(4):467-83. DOI
- Faisal A, Kafy A-A, Al Rakib A, Akter KS, Jahir DMA, Sikdar MS, Ashrafi TJ, Mallik S, Rahman MM. Assessing and predicting land use/land cover, land surface temperature and urban thermal field variance index using Landsat imagery for Dhaka Metropolitan area. Environ. Challenges 2021;4:100192. DOI
- Gorelick N, Hancher M, Dixon M, Ilyushchenko S, Thau D, Moore R. Google Earth Engine: Planetary-scale geospatial analysis for everyone. Remote Sens. Environ. 2017;202:18-27. DOI
- Velastegui-Montoya A, Montalván-Burbano N, Carrión-Mero P, Rivera-Torres H, Sadeck L, Adami M. Google Earth Engine: A Global Analysis and Future Trends. Remote Sens. 2023;15(14):3675. DOI
- Khan N, Shahid S, Chung E, Kim S, Ali R. Influence of Surface Water Bodies on the Land Surface Temperature of Bangladesh. Sustainability. 2019;11(23):6754. DOI
- Tamiminia H, Salehi B, Mahdianpari M, Quackenbush L, Adeli S, Brisco B. Google Earth Engine for geo-big data applications: A meta-analysis and systematic review. ISPRS J. Photogramm. Remote Sens. 2020;164:152-70. DOI
- Rahman H, Dedieu G. SMAC: a simplified method for the atmospheric correction of satellite measurements in the solar spectrum. Int. J. Remote Sens. 1994;15(1):123-43. DOI
- Abbas Z, Jaber HS. Accuracy assessment of supervised classification methods for extraction land use maps using remote sensing and GIS techniques. IOP Conf. Ser.: Mater. Sci. Eng. 2020;745(1):012166. DOI
- Prayogo LM, Widyantoro BA, Yuliardi AY, Hanif M, Spanton PI, Joesidawati MI. Land Cover Classification Assessment Using Decision Trees and Maximum Likelihood Classification Algorithms on Landsat 8 Data. DoubleClick: Journal of Computer and Information Technology 2023;6(2):69. DOI
- Sisodia PS, Tiwari V, Kumar A. Analysis of supervised maximum likelihood classification for remote sensing image. In: International conference on recent advances and innovations in engineering (ICRAIE-2014). IEEE. 2014. DOI
- Gong W, Yuan L, Fan W, Wang X, Stott P. Comparison to supervised classification modelling in land use cover using Landsat 8 OLI data: an example in Miyun county of North China. Nat. Environ. Pollut. Technol. 2016;15(1):243.
- Congalton RG. A review of assessing the accuracy of classifications of remotely sensed data. Remote Sens. Environ. 1991;37(1):35-46. DOI
- Rajeshwari A, Mani ND. Estimation of land surface temperature of Dindigul district using Landsat 8 data. Int. J. Res. Eng. Technol. 2014;3(5):122-6.DOI
- Sobrino J. A Comparative Study of Land Surface Emissivity Retrieval from NOAA Data. Remote Sens. Environ. 2001;75(2):256-66. DOI
- Sobrino JA, Jiménez-Muñoz JC, Paolini L. Land surface temperature retrieval from LANDSAT TM 5. Remote Sens. Environ. 2004;90(4):434-40. DOI
- Hasan I, Goni O, Katha ZT, Rabby MI, Hossain S, Banik A, Hasan S, Rahman I. Prediction modeling of land surface temperature in relation to land cover dynamics and health risk perception analysis in barishal city of Bangladesh. Sci. Rep. 2025;15(1):30730. DOI
- Suborna NJ, Evan RI, Rabby MJ, Rahman M, Khan A, Rakib MMH, Khan R, Hasan I, Roy DK. Urbanization induced heat wave risk assessment of Khulna City, Bangladesh: A 30-years analysis of land surface temperature, climate trends and forecasting. Geosyst. Geoenviron. 2026;5(1):100448. DOI
- Aboelnour M, Engel BA. Application of Remote Sensing Techniques and Geographic Information Systems to Analyze Land Surface Temperature in Response to Land Use/Land Cover Change in Greater Cairo Region, Egypt. J. Geogr. Inf. Syst. 2018;10(01):57-88. DOI
- Rahman M, Szabó G. Impact of Land Use and Land Cover Changes on Urban Ecosystem Service Value in Dhaka, Bangladesh. Land. 2021;10(8):793. DOI
- Habiba U, Haider F, Ishtiaque A, Mahmud MS, Masrur A. Remote Sensing & GIS Based Spatio-Temporal Change Analysis of Wetland in Dhaka City, Bangladesh. J. Water Resour. Prot. 2011;03(11):781-7. DOI
- Uddin MJ, Mondal C. Effect of Earth Covering and Water Body on Land Surface Temperature (LST). J. Civ. Eng. Sci. Technol. 2020;11(1):45-56. DOI
- Marufuzzaman M, Khanam MM, Hasan MK. Monitoring the Land Cover Change and Its Impact on the Land Surface Temperature of Rajshahi City, Bangladesh using GIS and Remote Sensing Techniques. J. Geogr. Environ. Earth Sci. Int. 2021:1-19. DOI
- Uddin MJ, Swapnil FJ. Land Surface Temperature (LST) Estimation at Kushtia District, Bangladesh. J. Civ. Eng. Sci. Technol. 2021;12(2):213-27. DOI
- Kafy A-A, Al Rakib A, Akter KS, Rahaman ZA, Faisal A, Mallik S, Nasher NMR, Hossain MI, Ali MY. Monitoring the effects of vegetation cover losses on land surface temperature dynamics using geospatial approach in Rajshahi City, Bangladesh. Environ. Challenges. 2021;4:100187. DOI
- Nawar N, Sorker R, Chowdhury FJ, Mostafizur Rahman M. Present status and historical changes of urban green space in Dhaka city, Bangladesh: A remote sensing driven approach. Environ. Challenges. 2022;6:100425. DOI
- Rahman MM, Hasan J. Evaluating the Impact of Green Spaces on Urban Heat Reduction in Rajshahi, Bangladesh Using the InVEST Model. Land. 2024;13(8):1284. DOI
Cite this article:
Munna SD, Hussain S. A decadal analysis of land surface temperature dynamics in response to urban expansion and vegetation loss in Faridpur. DYSONA-Applied Science. 2027;8(1):33-43. doi: 10.30493/das.2026.011408