Rumpa Jana 1*; Narayan C. Jana 1
1, Department of Geography, The University of Burdwan, Burdwan, W.B. -713104, India
E-mail:
janarumpa19@gmail.com
Received: 16/06/2025
Acceptance: 06/09/2025
Available Online: 07/09/2025
Published: 01/01/2026

Manuscript link
http://dx.doi.org/10.30493/DAS.2025.530500
Abstract
Coastal West Bengal, a heavily populated agricultural center dependent on fertile deltaic plains, confronts increasing cyclone hazards that jeopardize livelihoods and food security. This research assesses agricultural susceptibility to cyclones in Purba Medinipur district through a multi-dimensional framework that incorporates exposure, sensitivity, and adaptive capacity. Analysis of 31 years (1991–2022) of cyclone track data from the Joint Typhoon Warning Centre involved assessing cyclone frequency using the Cox-Stuart test and evaluating intensity through Accumulated Cyclone Energy (ACE) and Power Dissipation Index (PDI). Although the frequency of yearly cyclones has diminished, the intensity during the pre-monsoon period has exhibited an upward tendency, in contrast to the decreased severity observed in the post-monsoon phase. Vulnerability was assessed using 12 factors, such as elevation, slope, cropping system, literacy rates, and population density. Principal Component Analysis (PCA) identified literacy rate, slope, and coastline proximity as the most significant determinants. The results indicated that Nandigram-I, Khejuri-II, and Ramnagar-I are significantly vulnerable due to their low elevation, susceptibility to storm surges, and reliance on monocropping during the cyclone season (July–November), exacerbated by low literacy rates. In contrast, Contai-III and Ramnagar-II shown resilience due to elevated literacy rates and diverse agriculture. This study demonstrates that agricultural vulnerability arises not only from hazard exposure but also from socio-agricultural characteristics, notably single crop dependency and educational deficiencies. Consequently, it is advisable to implement policy integration of literacy initiatives, crop diversification (such as triple-cropping systems), and elevation-based land-use planning to alleviate cyclone effects on coastal agriculture.
Keywords: Agricultural vulnerability, Cyclones, Principal component analysis, West Bengal
Introduction
The Indian subcontinent demonstrates a notable vulnerability to cyclonic occurrences [1], with a considerable portion of the Indian coastline being prone to such phenomena. Coastal regions generally provide advantageous living environments, characterized by convenient access to aquatic resources for transportation, commerce, and fishing, as well as arable land suitable for agriculture [2]. Proximity to aquatic environments fosters economic opportunities in sectors such as fisheries and tourism. Moreover, coastal regions generally experience more temperate climatic conditions, rendering them appealing to inhabitants [3]. Furthermore, the establishment of port cities and trade centers have significantly influenced the demographic expansion in these regions. West Bengal, situated in India, ranks as one of the most densely populated states, holding the fourth position in the nation [4]. Rice cultivation serves as a fundamental activity in the coastal areas of West Bengal, where agriculture plays a crucial role [5].
The existence of nutrient-rich alluvial soil, along with accessible water resources from nearby rivers, positions this area as a significant agricultural hub, facilitating the growth of rice, legumes, and numerous other crop varieties. However, cyclones represent a notable coastal hazard impacting the Indian coastline, leading to substantial devastation as a result of heavy rainfall and subsequent flooding [3]. Approximately eighty percent of cyclones impacting India have been concentrated along the eastern coastline, which has functioned as the focal point [6]. In recent years, the vulnerability of coastal areas has intensified due to population expansion, leading to an increased number of individuals living in perilous environments [7].
Consequently, it is imperative to conduct an evaluation to determine the risks associated with cyclones that may affect both the land and its inhabitants [8]. In the past two decades, a notable rise in the occurrence of catastrophic storms has been observed. Prominent examples consist of Aila (2009), Phailin (2013), Hudhud (2014), Titli (2018), Fani (2018), Bulbul (2019), and Amphan (2020), among others. The occurrence of Cyclone ‘SIDR’ in West Bengal transpired from November 11 to 16, 2007, leading to the destruction of 46 villages and profoundly influencing the lives of thousands, as vast regions of land suffered considerable crop damage. The aftermath of ‘Aila’ led to a significant decline in vegetation, with nearly 90% of plant life in the affected region of West Bengal being lost. Additionally, more than 90% of agricultural land was submerged, alongside over 95% of homesteads, culminating in an overall reduction of approximately 4324 hectares [9].
The intricate relationship between extreme weather phenomena and the delicate balance of coastal ecosystems underscores the urgent necessity for holistic strategies that integrate disaster preparedness, robust agricultural practices, and sustainable land use to alleviate the impacts of cyclones on coastal farming [10]. Consequently, a thorough understanding of the susceptibility of the coastal region of West Bengal to the impacts of cyclonic events is needed. For this purpose, an in-depth examination that addresses multiple dimensions of vulnerability is needed, taking into account both natural and anthropogenic influences.
This investigation analyses historical cyclone data to evaluate the frequency, intensity, and geographical distribution of cyclones. This study seeks to evaluate the susceptibility of agricultural systems to cyclonic events in the coastal region of Purba Medinipur by examining at-risk areas, utilizing geographical characteristics, coastal landforms, and patterns of land use.
Material and Methods
Description of the study area
The region of Purba Medinipur (Fig. 1) is characterised by its coastal and deltaic plains, shaped by marine processes including wave action and tidal variations. The western region consists of a low-lying coastal plain, while the eastern segment is characterised by a deltaic plain shaped by the Subarnarekha River and its distributaries.
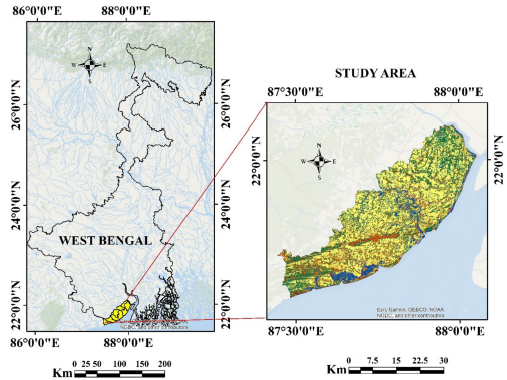
The southern coastal blocks within the study area display a unique topographical profile, with an average elevation between 5 and 7 meters and a gentle slope that varies from 0 to 4 degrees. The specific topographical features of this region contribute significantly to its susceptibility to cyclonic activity, especially regarding the risks of storm surges and flooding. The research site is located on the floodplains of major rivers, including the Rupnarayan, Hooghly, Kangsabati, and Haldi, which play a crucial role in the deposition of considerable amounts of clay particles within the soil matrix. This area includes a diverse range of geomorphological features, such as dunes, beach ridges, and tidal floodplains. Moreover, inadequate drainage infrastructure, obstructed drainage pathways, and the absence of appropriate channels intensify the region’s susceptibility to inundation during cyclonic occurrences.
Data source
Track data from the Joint Typhoon Warning Centre (JTWC) were employed to evaluate tropical cyclones (TCs) in the Bay of Bengal over a period from 1991 to 2022, encompassing a total of 31 years (The data can be accessed through the following website: www.npmoc.navy.mil/jtwc.html) [10].
The assessment of agricultural vulnerability to tropical cyclones was conducted by analysing various factors. The geographical data utilised for evaluating the criteria were acquired via geospatial methodologies. Moreover, a total of twelve indicators were systematically classified into three distinct components: exposure, sensitivity, and adaptive capacity (Table 1).
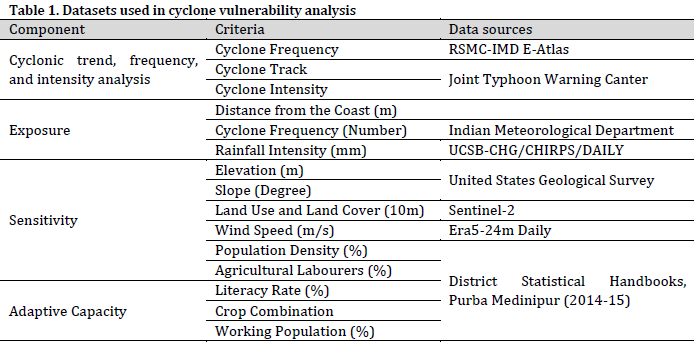
Each component was meticulously chosen based on a range of influencing factors (Fig. 2). Three criteria have been established for exposure, one of which pertains to the distance from the shore. The closeness to the coastline plays a crucial role in determining the degree of susceptibility to cyclones. Coastal regions exhibit a heightened vulnerability to storm surges, elevated winds, and flooding, which intensifies their risk profile [11]. The occurrence rate of cyclones represents a significant factor influencing exposure levels. An increased frequency could lead to enhanced exposure and vulnerability, as populations may not have adequate time to recover or adapt between events [1][12]. Extensive rainfall and deviation from typical precipitation patterns could intensify the vulnerability of coastal regions to flooding, storm surges, and the diverse risks associated with cyclones.
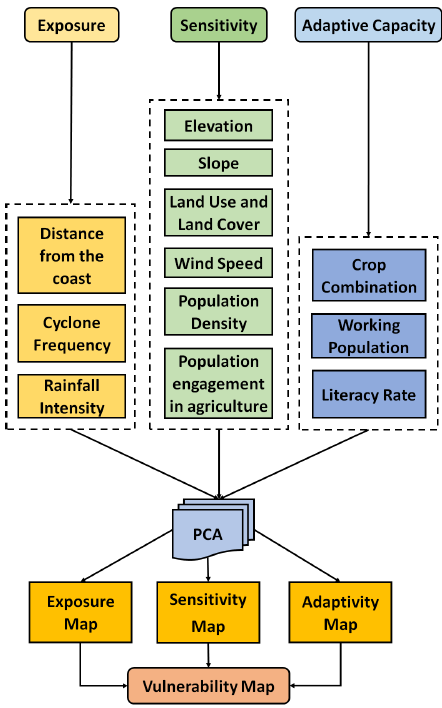
The sensitivity analysis includes six variables: wind speed, elevation, slope, population density, agricultural workforce, and land use/cover. The bands chosen for categorisation are derived from Sentinel-2 imagery, utilised for the classification of Land Use and Land Cover (LULC). Furthermore, information concerning population density and the proportion of individuals involved in agricultural activities was sourced from the District Statistical Handbook. The map depicting population density, in conjunction with the map showing the percentage of the population engaged in agricultural activities, was produced using a Geographic Information System (GIS) tool [13].
The assessment of adaptive capacity was based on three key criteria: crop combination, literacy rate (%), and working population (%). Data obtained from the District Statistical Handbook facilitated the calculation of the literacy rate and the working-age population, while a map was generated utilising ArcGIS software. The crop combination was determined utilising the Weaver’s Crop Combination method [14]. This methodology delineates and classifies areas according to the specific types of crops grown in those regions. This methodology holds significant importance within the domain of agricultural geography, particularly for the analysis of cropping patterns and the delineation of agricultural regions.
Data processing
The Cox-Stuart test was employed to identify statistically significant temporal patterns in assessing tropical storm frequency in the Bay of Bengal. The results indicated a modest decline in the frequency of tropical cyclones over time [15]. The Cox-Stuart test statistic is calculated using the following formula:
T=∑Sign {x(i+n/2)-x(i)}
Where:
X(i) is the ith observation in the time series
n is the total number of observations
Sign(x) = 1 if x > 0, 0 if x=0, and -1 if x<0
To measure the strength of the cyclone over the last 30 years, the Accumulated Cyclone Energy (ACE) and Power Dissipation Index (PDI) are computed [16-18]. ACE is a quantitative measure of the total energy generated by tropical cyclones within a specific time frame, usually the lifetime of the cyclone [19]. The calculation entails summing the squares of the maximum sustained wind speeds (Vmax) of tropical cyclones every 6 hours, provided the cyclone maintains a minimum intensity of tropical storm (≥ 34 knots). This metric is expressed in units of 104 kt2 [20]. The equation for ACE is defined as the sum of Vmax’s squares, denoted as:
ACE = ∑(Vmax2)
PDI, which stands for Power Dissipation Index, measures the destructive potential of tropical cyclones [21]. The calculation adds the cubes of the maximum sustained wind speeds (Vmax) observed every 6-hour period when the tropical cyclone achieves at least tropical storm status (≥ 34 knots). This metric is expressed in units of 106 kt3. The formula for PDI is expressed as the summation of the cube of Vmax, denoted as:
PDI = ∑(Vmax3)
The following formula was used to normalize the data:
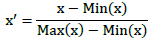
Where, x’ is the Normalized data of a Block, x is the Mean data of a Block, Min(x) is the minimum value among the Blocks, and Max(x) is the maximum value among the blocks.
Principal Component Analysis (PCA) was used to minimize dataset dimensionality while maintaining its most important variance. This analysis converts the originally correlated variables into a new group of uncorrelated variables known as principal components (PCs), which encapsulate the data’s maximum variance. Rather than being affected by value sizes, normalization ensures that every factor contributes equally to the analysis. This facilitates PCA’s ability to assess the significance of each component in identifying vulnerability.
To identify the predominant patterns of variability in each dataset, principal component analysis (PCA) is performed independently for exposure, sensitivity, and adaptive capacity. The major components, which account for over 80% of the variance in each category, are identified by the PCA results. It computes the weights using the variance explained by these chosen components. The loading values and the variance explained for each primary component are multiplied to determine the weights. PCA analysis of each category (exposure, sensitivity, and adaptive capacity) was used to generate cyclone exposure, sensitivity, and adaptivity maps for the studied region. These maps were generated utilizing the Euclidean distance and natural breaks tools within the GIS framework [12]. Then, these maps were collectively used to generate the final vulnerability map (Fig. 2).
Results and Discussion
Cyclonic trend analysis
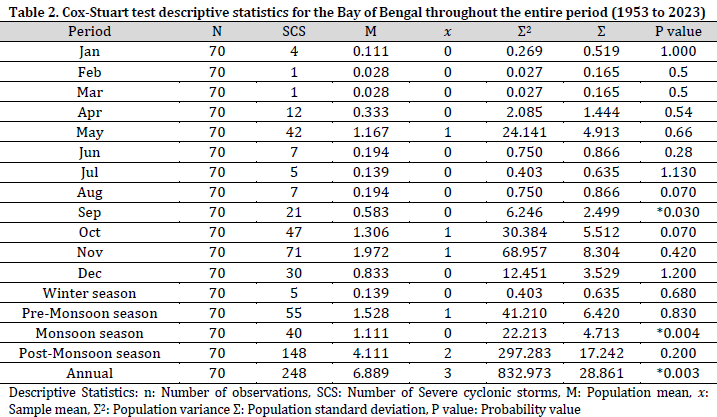
A summary of descriptive statistics regarding cyclones that have transpired in the Bay of Bengal over the past 70 years was prepared (Table 2). The calculated variance and standard deviation values elucidate the degree of variability present in cyclone occurrences. In this instance, October demonstrates the greatest variance (30.384) and standard deviation (5.512), indicating a higher level of unpredictability relative to the other months.
The results from the Cox-Stuart statistical test demonstrated an annual p-value of 0.003, suggesting a reliable trend in the annual frequency of cyclones. A low p-value indicates a significant non-random pattern or trend within the data, underscoring the necessity of investigating long-term cyclone patterns and their potential effects on the Bay of Bengal region.
Cyclonic intensity analysis
The strength of the cyclone is primarily assessed using the accumulated cyclonic energy and the power dissipation index. The primary objective of the Accumulated Cyclone Energy (ACE) index is to assess the intensity of cyclones. In contrast, the Power Dissipation Index (PDI) predominantly evaluates the destructive capacity of these storms. However, both ACE and PDI are typically utilized to gauge the strength of cyclonic activities.
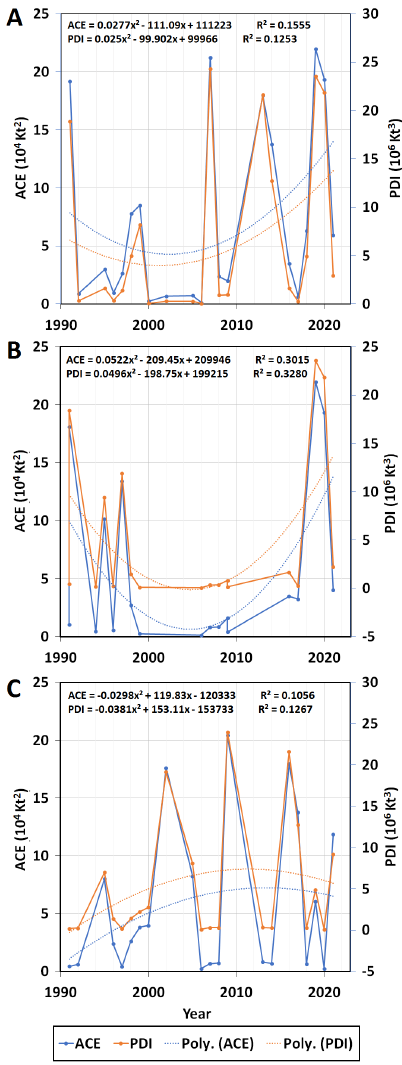
To evaluate the intensity of the cyclone on an annual basis and during various seasons from 1991 to 2022, including the pre- and post-monsoon periods, a polynomial curve was employed instead of a linear regression curve (Fig. 3 A). This selection is warranted as polynomial regression possesses the ability to capture nonlinear trends within the data, whereas linear regression operates under the assumption of a constant rate of change. The correlation between ACE and time may not follow a straight line, and a polynomial curve may provide a more accurate representation of the curved pattern. The polynomial regression has an R² value of 0.156 for ACE and 0.125 for PDI. The pre-monsoon ACE and PDI values for R2 were 0.302 and 0.328, respectively (Fig. 3 B). For the post-monsoon period, the values were 0.106 and 0.127 (Fig. 3 C). The pre-monsoon cyclones intensity has progressively increased over the years, albeit not significantly. Nevertheless, the intensity of post-monsoon cyclones was diminished, as can be seen in the polynomial curve.
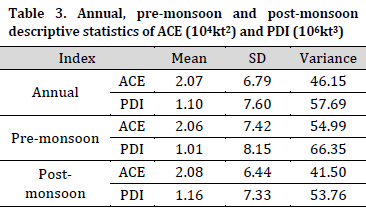
The average value of the pre-monsoon ACE was 2.06 with a standard deviation of 7.42, while the pre-monsoon PDI has an average value of 1 with a standard deviation of 8.15. The average values for the post-monsoon ACE and PDI are 2.08 and 1.16, with standard deviations of 6.44 and 7.33, respectively. The variations span from 41.5 for post-monsoon ACE to 66.35 for pre-monsoon PDI, highlighting the significant fluctuations in tropical storm strength over the monsoon seasons (Table 3).
Cyclone vulnerability analysis
Description of the exposure parameter
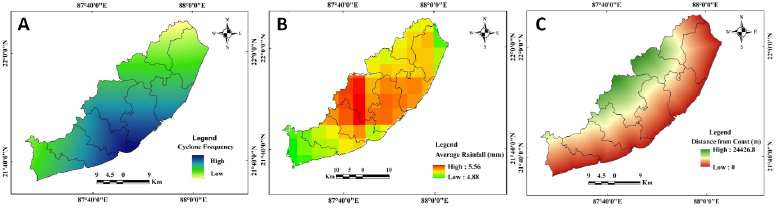
The exposure parameter comprises three factors: cyclone frequency, rainfall, and distance from the coast (Fig. 4). The proximity to the coastline significantly affects the level of susceptibility to cyclonic events (Fig. 4 C). Coastal regions exhibit a heightened vulnerability to storm surges, elevated winds, and flooding, thereby increasing their susceptibility [22]. The frequency of cyclones represents a significant variable affecting exposure levels. This may suggest the probability and intensity of forthcoming calamities. The escalation in frequency may result in greater exposure and susceptibility (Fig. 4 A), as communities may lack adequate time for recovery or adaptation between occurrences [1]. Intense precipitation and deviations from established climatological patterns could heighten the vulnerability of coastal regions to flooding, storm surges, and various hazards associated with cyclones. Regions characterized by considerable fluctuations in precipitation are at a heightened risk of encountering severe flooding events [13]. The magnitude of precipitation additionally functions as a parameter for exposure assessment. A map illustrating rainfall intensity was created utilizing data from CHIRPS, which stands for Climate Hazards Group InfraRed Precipitation with Station data. This gridded dataset boasts a spatial resolution of 0.05° (approximately 5.57 meters) and combines satellite imagery with in-situ station observations (Fig. 4 B).
Explanation of sensitivity parameter
The factors evaluated in the analysis of agricultural sensitivity to cyclones include land use and land cover, elevation, slope, wind speed, population density, and the demographic engaged in agriculture, all of which were integrated as elements of sensitivity (Fig. 5). The research site encompasses 269.54 Km2 of urban areas, 520.07 Km2 of agricultural land, 414.70 Km2 of vegetation cover, 111.57 Km2 of water bodies, and 16.97 Km2 of bare land (Fig. 5 A). The impacts of cyclones exhibit a pronounced susceptibility on agricultural terrain. The average wind velocity is a crucial factor in assessing the susceptibility of cyclones, as higher wind speeds are directly associated with a greater probability of inflicting damage to agricultural production systems (Fig. 5 B). The region exhibits a subtle gradient, generally ranging from 0 to 4 degrees (Fig. 5 D), which contributes to a gradual drainage process and an almost level terrain. Unlike the uniform landscape found in other regions of the district, the southern coastal plains present a distinctive geomorphological profile, characterised by the development of dunes along the coastal zones [23]. The elevation within the coastal area exhibits an average range of 5 to 7 meters above mean sea level, with the maximum point recorded at 49 meters and the minimum at -19 meters (Fig. 5 C). Areas located at reduced elevations exhibit a higher susceptibility to flooding, which has the potential to devastate agricultural yields and contribute to salt accumulation in the soil [12]. Areas with elevated population densities are likely to experience greater economic losses as a result of the concentration of agricultural activities and infrastructure [24]. The proportion of individuals actively involved in agricultural activities was most significant in the blocks of Ramnagar-II, Nandigram-I, and Khejuri-II, with figures ranging from 15% to 18% (Fig. 5 E). Agricultural communities demonstrate heightened susceptibility to cyclones due to the detrimental impacts on livelihoods and food security that arise from the destruction of crops and land.
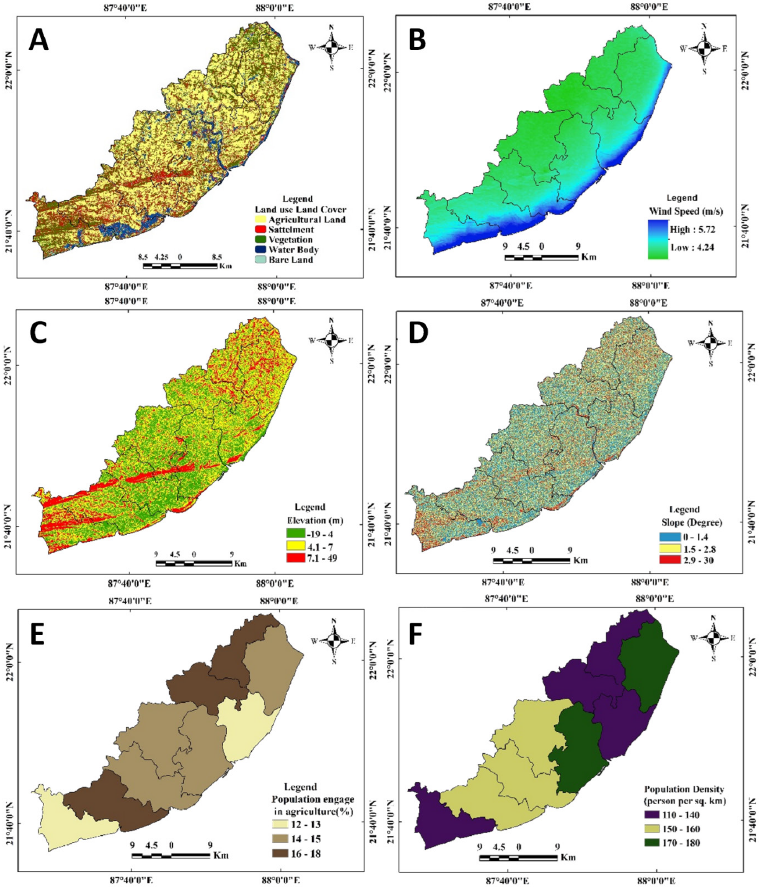
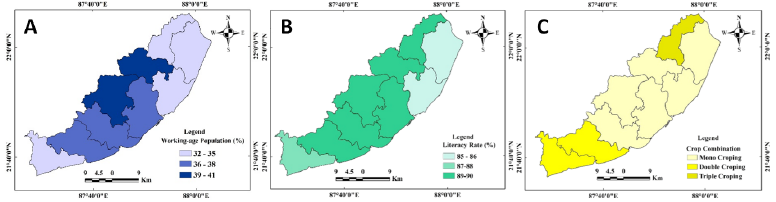
Description of adaptivity parameter
Three criteria were identified for the adaptation estimation: the working population, the crop combination, and the literacy rate (Fig. 6). In the designated study area, the predominant agricultural practice is monocropping (Fig. 6 C), with a specific emphasis on the cultivation of Aman crops. This crop is characterized by a growing season spanning from July to August, with the harvesting phase occurring in October and November. This period coincided with the peak occurrence of post-monsoon cyclones, rendering the mono cropping regions particularly vulnerable to such meteorological events. A correlation often exists between improved literacy rates and an enhanced comprehension of cyclone hazards and preparedness strategies. A workforce characterised by diversity and not solely dependent on agricultural practices demonstrates greater resilience to economic disruptions induced by storms [25]. Alternative income sources may exhibit greater resilience in the aftermath of a disaster, thereby reducing their overall vulnerability.
Principal component analysis outputs
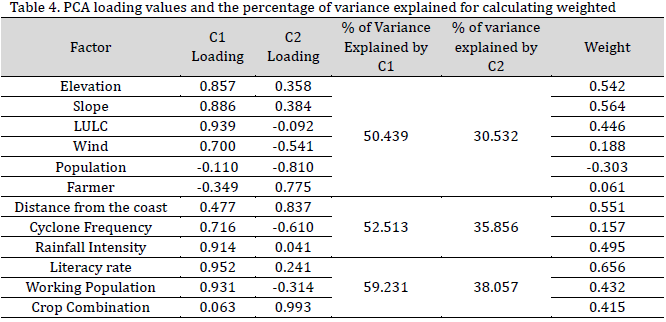
Principal component analysis (PCA) for each parameter showed that the combined effect for the first and second components can explain more than 80% of the total variance (Table 4). Utilising the loading values of components 1 and 2, the weighted values were computed. Literacy rate, Slope, and Distance from cost recorded the highest weights among the studied factors of adaptivity, sensitivity, and exposure parameters, respectively.
The exposure map (Fig. 7 A) demonstrates that Nandigram-I and Ramnagar-I show an increased exposure to cyclones. Nonetheless, all coastal regions exhibited heightened exposure to cyclones in contrast to non-coastal regions (Khejuri-I and Contai-III).
Contai-I, Contai-III, Deshapran, and Khejuri-II exhibited heightened sensitivity to cyclonic events (Fig. 7 B). This observation mainly resulted from the flat topography of these blocks and their minimal altitudes (Fig. 5 C and D), as slope and elevation received the highest weights among the sensitivity factors (Table 4). This finding holds significant relevance within the framework of this investigation, as these regions predominantly consist of agricultural zones (Fig. 5 A). Conversely, Ramnagar-I exhibited reduced sensitivity in comparison to other blocks, attributed to its elevated altitudes and varied topographical features.
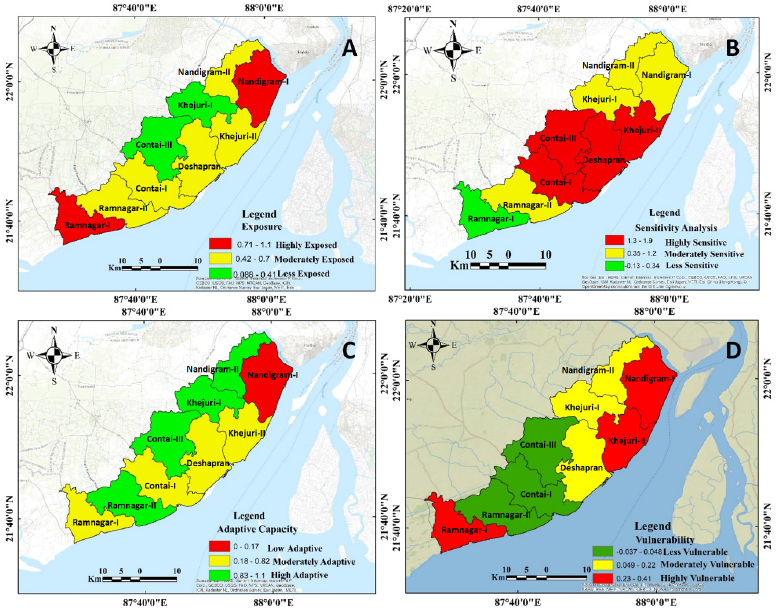
Reduced adaptivity was noted in Nandigram-I (Fig. 7 C), primarily due to the comparatively lower literacy rates (Fig. 6 B), coupled with a smaller workforce (working-age population) and a dependence on mono cropping systems (Fig. 6 A and C). Conversely, the regions of Contai-III, Khejuri-I, Ramnagar-II, and Nandigram-II exhibited higher adaptivity to cyclones. This adaptability is significantly linked to the elevated literacy rates observed in these areas (Fig. 6 B), along with a growing workforce in Contai-III, Khejuri-I, and Ramnagar-II (Fig. 6 A). Additionally, Nandigram-II’s reliance on triple cropping systems further contributes to this resilience (Fig. 6 C).
The vulnerability map indicates that Nandigram-I, Khejuri-II, and Ramnagar-I exhibit the highest levels of vulnerability, whereas Contai-I, Contai-III, and Ramnagar-II demonstrate the greatest resistance to coastal cyclones. Consequently, it is essential to further develop policies for cyclone mitigation in the regions most susceptible to their impacts in order to alleviate the consequences. Emphasising the enhancement of literacy rates alongside the promotion of double and triple cropping systems can significantly bolster cyclone adaptability in these regions.
Conclusions
This study identifies Nandigram-I, Khejuri-II, and Ramnagar-I as critical cyclone risk hotspots in Purba Medinipur, due to low elevation, monocropping during cyclone season, and comparatively lower literacy rates than neighboring regions. Despite a minor reduction in the frequency of cyclones in the Bay of Bengal, the intensification occurring before the monsoon poses escalating hazards to those dependent on agriculture. Vulnerability mapping indicates that socio-agricultural factors, particularly crop diversification and education, are more significant than hazard exposure in determining resilience. Highlighting literacy activities and diverse agricultural methods, such as triple-cropping, is essential to reduce agricultural losses from forthcoming storms. Evidence-based strategies must be integrated into coastal zone management to safeguard food security and livelihoods in climate-sensitive deltas.
Acknowledgments
The authors extend their sincere gratitude to the National Oceanic and Atmospheric Administration (NOAA), the Joint Typhoon Warning Center (JTWC), the Indian Meteorological Department’s Regional Specialized Meteorological Centre, the District Statistical Handbook of west Bengal, and the United States Geological Survey for providing the requisite datasets in digital format.
Conflict of interest statement
The authors declared no conflict of interest.
Funding statement
The authors declared that no funding was received in relation to this manuscript.
Data availability statement
The authors declared that all used data and data sources are mentioned in the manuscript. All datasets will be available upon reasonable request from the corresponding author.
References
- Basheer Ahammed KK, Pandey AC. Coastal social vulnerability and risk analysis for cyclone hazard along the Andhra Pradesh, East Coast of India. KN J. Cartogr. Geogr. Inf. 2019;69(4):285-303. DOI
- Ghorai D, Devulapalli S, Paul AK. Cyclone vulnerability assessment of Tamil Nadu Coast, India using remote sensing and GIS techniques. J. Remote Sens. Technol. 2017;5(1):32-43.
- Bernard A, Long N, Becker M, Khan J, Fanchette S. Bangladesh’s vulnerability to cyclonic coastal flooding. Nat. Hazards Earth Syst. Sci. 2022;22(3):729-51. DOI
- Dhara S, Paul AK. Impact of cyclone and flood on social vulnerability “A case study at Kakdwip Block, South 24 Parganas, West Bengal.”. Int. J. Innov. Sci. 2016;3(3).
- Gayen S, Villalta LI, Haque SM. Comparative social vulnerability assessment in Purba medinipur district, West Bengal, India. Eur. J. Geogr. 2020;11(1):93-107. DOI
- Hoque MA, Pradhan B, Ahmed N, Roy S. Tropical cyclone risk assessment using geospatial techniques for the eastern coastal region of Bangladesh. Sci. Total Environ. 2019;692:10-22. DOI
- Billah M, Sarker S, Ansary MA. Cyclone Evacuation Route Identification Using GIS for Coastal Communities in Mirzaganj Union, Patuakhali, Bangladesh. preprints.org. 2018. DOI
- Poompavai V, Ramalingam M. Geospatial analysis for coastal risk assessment to cyclones. J Indian Soc. Remote Sens. 2013;41(1):157-76. DOI
- Mallick B, Rahaman KR, Vogt J. Coastal livelihood and physical infrastructure in Bangladesh after cyclone Aila. Mitig. Adapt. Strateg. Glob. Change. 2011;16(6):629-48. DOI
- Das HP. Agrometeorological impact assessment of natural disasters and extreme events and agricultural strategies adopted in areas with high weather risks. In Natural disasters and extreme events in agriculture: impacts and mitigation. Berlin, Heidelberg: Springer Berlin Heidelberg. 2005:93-118. DOI
- Rahman MM, Hossain MA, Ali MR, Ahmed Z, Hedayutul Islam AH. Assessing vulnerability and adaptation strategy of the cyclone affected coastal area of Bangladesh. Geoenviron. Disasters. 2022;9(1):1-20. DOI
- Sarkar SK, Rudra RR, Santo MM. Cyclone vulnerability assessment in the coastal districts of Bangladesh. Heliyon. 2024;10(1). DOI
- Ghosh S, Mistri B. Cyclone-induced coastal vulnerability, livelihood challenges and mitigation measures of Matla–Bidya inter-estuarine area, Indian Sundarban. Nat. Hazards. 2023;116(3):3857-78. DOI
- Weaver JC. Crop-combination regions in the Middle West. Geogr. Rev. 1954;44(2):175-200. DOI
- Rutkowska A. Properties of the Cox–Stuart test for trend in application to hydrological series: The simulation study. Commun. Stat. Simul. Comput. 2015;44(3):565-79. DOI
- Bell GD, Halpert MS, Schnell RC, Higgins RW, Lawrimore J, Kousky VE, Tinker R, Thiaw W, Chelliah M, Artusa A. Climate assessment for 1999. Bull. Amer. Meteor. Soc. 2000;81(6):S1-50. DOI
- Emanuel K. Increasing destructiveness of tropical cyclones over the past 30 years. Nature. 2005;436(7051):686-8. DOI
- Fritz AM, Belanger JI, Curry JA. The impact of tropical cyclone size on North Atlantic ACE and PDI. In AGU Fall Meeting Abstracts. 2008;2008:U11A-0005.
- Chu PS, Murakami H. Climate variability and tropical cyclone activity. Cambridge University Press. 2022. DOI
- Bhardwaj P, Singh O. Climatological characteristics of Bay of Bengal tropical cyclones: 1972–2017: P. Bhardwaj, O. Singh. Theor. Appl. Climatol. 2020;139(1):615-29. DOI
- Villarini G, Vecchi GA. Statistical Modeling of the Power Dissipation Index (PDI) and Accumulated Cyclone Energy (ACE). J. Clim. 2012. DOI
- Rahman MS, Di L, Yu E, Lin L, Yu Z. Remote sensing based rapid assessment of flood crop damage using novel disaster vegetation damage index (DVDI). Int. J. Disaster Risk Sci. 2021;12(1):90-110. DOI
- Wilson KM, Baldwin JW, Young RM. Estimating tropical cyclone vulnerability: A review of different open-source approaches. Hurricane Risk in a Changing Climate. 2022:255-81. DOI
- Alam E, Collins AE, Islam AR, Paul A, Islam MK. Change in cyclone disaster vulnerability and response in coastal Bangladesh. Disasters. 2024;48(2):e12608. DOI
- Bahinipati CS. Assessment of vulnerability to cyclones and floods in Odisha, India: a district-level analysis. Curr. Sci. 2014:1997-2007.
Cite this article:
Jana, R., Jana, N. C. Agricultural vulnerability to cyclones in coastal West Bengal. DYSONA – Applied Science, 2026;7(1): 61-72. doi: 10.30493/das.2025.530500