Huda Jamal Jumaah 1*; Maha Adnan Dawood 2; Takwaa Alaa Abd Alreza 3; Maha Adnan Meteab 4
1, Department of Environment and Pollution Engineering, Technical Engineering College of Kirkuk, Northern Technical University, Kirkuk, 36001, Iraq
2, Department of Fuel and Energy Engineering, College of Oil and Gas Techniques Engineering of Kirkuk, Northern Technical University, Kirkuk, 36001, Iraq
3, Department of Mechanical Engineering, Engineering College, Sumer University, Iraq
4, Department of Architecture and Construction Engineering, Technical Engineering College of Kirkuk, Northern Technical University, Kirkuk, 36001, Iraq
E-mail:
huda80@ntu.edu.iq
Received: 07/08/2025
Acceptance: 22/09/2025
Available Online: 23/09/2025
Published: 01/01/2026

Manuscript link
http://dx.doi.org/10.30493/DAS.2025.539377
Abstract
Iraq is ranked among the nations most adversely affected by increased air pollution. This research utilized Sentinel-5P imagery and Geographic Information Systems (GIS) to monitor and assess gaseous pollutants, as well as to delineate the spatial distributions of these pollutants across Iraq. The methodology involved the systematic mapping of sulphur dioxide (SO₂), nitrogen dioxide (NO₂), and aerosol index (AI). The research findings demonstrated robust monitoring capabilities and precise outcomes, juxtaposed with historical data and prior investigations. The observed concentration values ranged between 0 and 240.2 μg/m² for SO₂, from 0 to 4.6 μg/m² for NO₂, and from -1 to 2.75 for AI. A few provinces, such as Baghdad in the center, Basra in the south, in addition to Kirkuk and Nineveh in the north, were recognized as the most severely impacted by air pollution. The current study emphasizes the importance of air pollution monitoring in Iraq, particularly in the highlighted hotspots. Such observations are crucial in formulating pollution-mitigating strategies and improving air quality in affected areas.
Keywords: Sentinel-5P, Sulfur dioxide, Nitrogen dioxide, Aerosol Index, Iraq
Introduction
The processes of urbanization, energy consumption, transportation, and motorization play significant roles in the introduction of various pollutants into the atmosphere, resulting in air pollution that adversely affects the ecosystem [1]. The pollutants identified encompass a range of substances, including but not limited to Particulate Matter (PM2.5, PM10), Sulfur dioxide (SO₂), Nitrogen dioxide (NO₂), Ozone (O3), Carbon monoxide (CO), and Carbon dioxide (CO2) [1-4].
The growing recognition of the detrimental impacts on human health and ecological stability has led to a heightened emphasis on the monitoring of air quality parameters in recent years [5][6]. Consequently, air pollution can be accurately considered one of the most critical and urgent challenges, particularly for nations in the developing world [7-9]. The global implications of air pollution on human health encompass respiratory and cardiovascular diseases that affect individuals across all age demographics, with particular attention given to vulnerable populations including children, women, and the elderly [1][2]. Furthermore, the World Health Organization has indicated that air pollution represents the most significant environmental health threat on a global scale [3][4], with over 90% of the world’s population living in regions characterized by hazardous air quality [1].
The measurement of chemical concentration is increasingly significant in the context of air quality analysis, particularly when examining the Earth’s surface in relation to human activities [10][11]. In recent years, numerous space satellites have been utilized to evaluate atmospheric conditions. Among the most advanced of these is the Sentinel-5 Precursor, a mission conducted by the European Space Agency as part of the Copernicus Earth observation initiative, which was launched in October 2017 [6]. This satellite provides reliable point cloud data across various spatial and temporal scales. The Sentinel-5P is widely recognized for its capabilities in quantifying air pollutants, while the Copernicus data are employed for the assessment of aerosol optical depth [10].
Satellite data present certain limitations; for example, cloud cover can obstruct observations, and measurements are typically available only during the satellite’s overhead passage, reported as the vertically integrated volume density of specific contaminants. Currently, numerous satellite-derived air quality products are extensively utilized for diverse environmental applications; however, due to their coarse spatial resolution, these products are unsuitable for assessing air pollution within urban areas [12]. These systems provide detailed insights into the potential concentrations of various airborne pollutants, their probable sources, and the anticipated dispersion patterns. Nonetheless, the constraints related to the integration of these two forms of information are primarily linked to terrestrial monitoring systems, which inherently restrict the quantity of distinct spatiotemporal observations [6].
The Air Quality Life Index (AQLI), developed by the University of Chicago, indicates that Iraq was ranked 12th globally in 2022 concerning particulate matter pollution, with a PM2.5 level of 32.42 μg/m³ and a corresponding loss of life expectancy of -2.69 years [13]. Furthermore, the IQAir 2023 World Air Quality Ranking positioned Iraq at 13th globally in terms of PM2.5 concentration (μg/m³) for the period spanning 2018 to 2024 [14]. Consequently, a multitude of research efforts have focused on the critical issue of air pollution in Iraq, highlighting its significant relevance [15-18].
The considerable variability in air pollution levels, coupled with the ongoing rise in urbanization, poses substantial challenges to the monitoring of near-surface air quality. Consequently, the approach to achieving effective warnings involves the amalgamation of various data sources, with remote sensing being a significant component. Satellite data provides insights into pollution levels and offers a comprehensive overview, enabling the monitoring of air pollution movement to and from urban areas. Therefore, this research focused on detailing the monitoring of air pollution across Iraq, utilizing data on SO₂, NO₂, and AI obtained from the Sentinel-5P satellite.
Material and Methods
Study area
Iraq is situated within the geographical coordinates of 30° to 36° N latitude and 39° to 48° E longitude, with a total area of 438,320 Km². Iraq exhibits a predominantly continental climate; however, it also encompasses subtropical and semi-arid characteristics, particularly in its northern and northeastern regions, which feature mountainous areas exhibiting Mediterranean climatic conditions.
It is evident that Iraq is among the nations facing significant climate risks. Recent years have witnessed temperature increases that have contributed to the emergence of sand and dust storms as some of the most destructive catastrophic events. Sand and dust pollution is a recurring phenomenon, particularly prevalent during the early summer months of May through July. As a result, the country is positioned among those worldwide exhibiting high concentrations of PM2.5 pollution [13][14].
Data
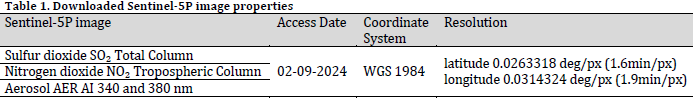
The data utilized in this investigation were acquired through the online application of the Sentinel Hub EO Browser. The acquired data included measurements of sulfur dioxide (SO₂) total column, nitrogen dioxide (NO₂) tropospheric column, and AER AI at wavelengths of 340 and 380 nm (Table 1).
The Sentinel-5P/TROPOMI instrument conducts surface mapping of Earth with a spatial resolution of one hundred twenty-six kilometers, following an orbital pattern that repeats every day. This configuration allows for the detection of fine details, including minor emissions of SO₂. The data is represented in units of (mol/m²) on the map.
The tropospheric column of nitrogen dioxide (NO₂) indicates the levels of this gas that are introduced into the atmosphere due to human activities and certain natural processes. All data are presented in units of (mol/m²) on the map.
The Aerosol Index (AI) serves as a qualitative measure that assesses the presence of elevated layers of aerosols in the atmosphere. The application can be utilized to ascertain the likelihood of the presence of aerosols, such as desert dust and volcanic ash plumes, that absorb UV radiation. Positive values indicate the presence of UV-absorbing aerosols, with the corresponding color spectrum extending from light blue to red. The absorption and scattering of incoming solar radiation by aerosols result in an elevation of optical depth and a reduction in visibility. Aerosols exert a significant influence on public health, meteorological conditions, and climatic patterns. Additional natural contributors to aerosol formation include emissions from industrial facilities, combustion byproducts from fires, particulate matter generated by meteorological events such as dust storms, marine aerosols from sea salts, volcanic particulates, and atmospheric haze. The calculations for AI are conducted within the wavelengths of 340/380 nm and 354/388 nm.
Applied approach
The research employs the GIS Spatial Analyst tool and Geo-processing techniques to analyze the acquired data and produce the final mapped results. The subsequent phase involves determining the concentration of gaseous pollutants expressed in micrograms per square meter (μg/m²).
The equations employed for the calculations of concentration are delineated in the subsequent expressions:
SO₂ (μg/m²) = SO₂ (mmol/m²) × Molar Mass × 103
NO₂ (μg/m²) = NO₂ (mmol/m²) × Molar Mass × 103
Where SO₂ (μg/m²) and NO₂ (μg/m²) represent the calculated concentrations in micrograms per square meter (regardless of column height), SO₂ (mmol/m²) and NO₂ (mmol/m²) are values from the Sentinel-5P data. The Molar masses of SO₂ and NO₂ are 64.066g and 46.0055g, respectively.
Results and Discussion
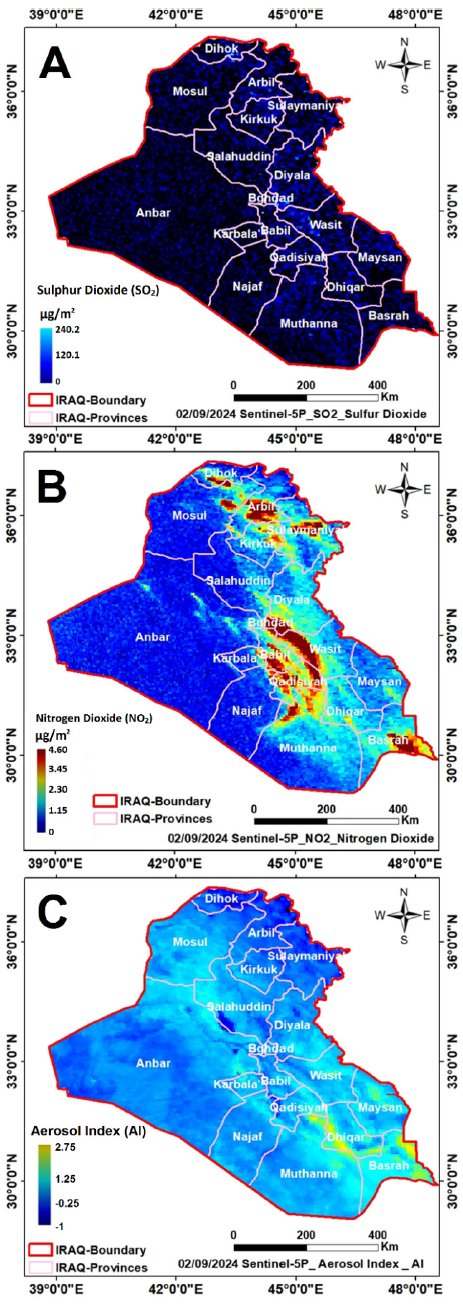
This study illustrates the spatial distributions of important atmospheric contaminants over Iraq on September 2, 2024, based on Sentinel-5P satellite data. The Sulfur dioxide (SO₂) distribution map (Fig. 1 A) showed consistently low levels across the country, often below 120 µg/m². The highest amounts were found in specific locations of central provinces (Baghdad and Wasit) and northern provinces (Arbil and Kirkuk), reaching 240.2 µg/m², most likely due to industrial operations. Since the data was collected in summer, a mixing height of 2 Km can be assumed, resulting in most of the examined region being below 60 µg/m³. Despite mainly being below the WHO’s 24-hour air quality gridline (AQG) of 40 µg/m³ [19], special attention should be given to areas with increased SO₂ emission levels in central and northern provinces, as even short-term SO₂ exposure increases mortality risks [20].
Nitrogen dioxide (NO₂) concentrations (Fig. 1 B) are more unevenly distributed, with higher levels concentrated in urban and industrial areas. High NO₂ levels (4.6 µg/m²) were found in the southern regions, especially near Basrah, as well as in the central urban corridor, which includes Baghdad, Wasit, Diyala, Babil, and Qadisiyah. These hotspots are associated with high levels of automotive traffic, fossil fuel combustion, and industrial activity. The spatial pattern indicates that anthropogenic sources dominate NO₂ emissions in these areas, considerably contributing to regional air quality decline. At a mixing height of 2 km, the highest NO₂ concentration was less than 2.3 µg/m³, significantly lower than the WHO AQG criteria of 10 µg/m³ over 24 hours [19]. However, additional precautions should be taken in areas with high NO₂ levels, taking into account the climatic nature of these areas, because elevated temperatures and stable weather conditions can inhibit horizontal and vertical air mixing, causing pollutants to accumulate close to the ground [21].
The aerosol index (AI) map (Fig. 1 C) reveals the presence of aerosols, such as dust and pollution particles, in the atmosphere. AI values ranged from -1 to 2.75, with positive anomalies concentrated near Iraq’s southern and southeastern borders, particularly in Basrah and Dhiqar provinces. These elevated AI values suggest the presence of airborne particulate matter, which could be attributed to dust storms from nearby arid regions or local industrial and agricultural operations. Northern provinces, such as Dihok and Arbil, have lower AI values, indicating reduced aerosol loading. However, these findings are most likely connected to the data acquisition date, as other central and northern areas have been known to have significant pollution incidents due to fine particle pollutants [23]. Collectively, these findings reveal considerable regional differences in air quality across Iraq, underscoring the importance of targeted air quality monitoring and mitigation initiatives, particularly in densely populated and industrially active areas.
The results presented in the current study are limited by the moderate data resolution as acquired from the Sentinel-5P satellite. Therefore, small-scale pollution changes are unaccounted for, especially in densely populated urban or industrial areas. Also, assumptions about air mixing height and homogenous distribution are applied in the conversion of column densities to surface concentrations, which might contribute to estimation inaccuracies. These restrictions can have an impact on the accuracy of pollutant concentration estimates.
As a result, more study on a longer-term dataset is required to improve accuracy in metropolitan areas, as well as a more precise prediction of mixing heights in order to estimate key air pollutant concentrations throughout the year reliably. Using data from a higher-resolution satellite or a combination of sensors could improve spatial detail. In future studies, the use of ground-based air quality monitoring stations would improve the validation and accuracy of satellite data. Moreover, incorporating meteorological factors can help achieve a better understanding of pollution dispersion dynamics in the area. An analysis spanning multiple years would enable the identification of seasonal and long-term patterns. Finally, expanding the study to include other pollutants, such as PM2.5 and ozone, would assist in providing a more accurate assessment of air quality.
Overall, Iraq’s air quality is substandard, especially in densely populated areas like Baghdad, Basra, Kirkuk, and Nineveh. As a result, there is a crucial need to develop more effective pollution control strategies, such as reducing industrial emissions, improving transportation policy, and enacting stronger environmental laws. There is a need to integrate pollution control tactics with creative solutions for managing health consequences and air quality in the country.
Conclusion
This study reveals significant spatial variability in SO₂, NO₂, and aerosol pollution in Iraq. As expected, industrial and urban centers, such as Baghdad, Basrah, and Kirkuk, represented the main pollution hotspots. Although SO₂ and NO₂ concentrations were mainly below WHO thresholds, localized exceedances and meteorological stagnation pose serious public health risks. In this regard, satellite-derived data, though it can serve the general monitoring purpose, is limited by resolution and mixing height assumptions. These limitations necessitate ground validation and higher-resolution monitoring. Additionally, long-term, multi-seasonal analyses and the integration of meteorological data can aid in accurate trend detection. Iraq urgently requires targeted emission controls, updated environmental regulations, and integrated air quality and health policies. Therefore, enhancing monitoring infrastructure and regional cooperation will be key to mitigating pollution in this climate-vulnerable nation.
Conflict of interest statement
The authors declared no conflict of interest.
Funding statement
The authors declared that no funding was received in relation to this manuscript.
Data availability statement
The authors declared that all used data and data sources are mentioned in the manuscript.
References
- Hassaan MA, Abdallah SM, Shalaby ES, Ibrahim AA. Assessing vulnerability of densely populated areas to air pollution using Sentinel-5P imageries: a case study of the Nile Delta, Egypt. Sci. Rep. 2023;13(1):17406. DOI
- Makri A, Stilianakis NI. Vulnerability to air pollution health effects. Int. J. Hyg. Environ. Health. 2008;211(3-4):326-36. DOI
- Chen B, Kan H. Air pollution and population health: a global challenge. Environ. Health Prev. Med. 2008;13(2):94-101. DOI
- Manisalidis I, Stavropoulou E, Stavropoulos A, Bezirtzoglou E. Environmental and health impacts of air pollution: a review. Front. Public Health. 2020;8:14. DOI
- Chen F, Zhang W, Mfarrej MF, Saleem MH, Khan KA, Ma J, Raposo A, Han H. Breathing in danger: Understanding the multifaceted impact of air pollution on health impacts. Ecotoxicol. Environ. Saf. 2024;280:116532. DOI
- Tabunschik V, Gorbunov R, Gorbunova T. Unveiling air pollution in crimean mountain rivers: analysis of sentinel-5 satellite images using google earth engine (GEE). Rem. Sens. 2023;15(13):3364. DOI
- Jumaah HJ, Mansor S, Pradhan B, Adam SN. UAV-Based PM2.5 Monitoring for Small-Scale Urban Areas. Int. J. Geoinformatics. 2018;14(4).
- Jumaah HJ, Kalantar B, Halin AA, Mansor S, Ueda N, Jumaah SJ. Development of UAV-based PM2.5 monitoring system. Drones. 2021;5(3):60. DOI
- Ameen MH, Jumaah HJ, Kalantar B, Ueda N, Halin AA, Tais AS, Jumaah SJ. Evaluation of PM2. 5 particulate matter and noise pollution in Tikrit University based on GIS and statistical modeling. Sustainability. 2021;13(17):9571. DOI
- Halder B, Ahmadianfar I, Heddam S, Mussa ZH, Goliatt L, Tan ML, Sa’adi Z, Al-Khafaji Z, Al-Ansari N, Jawad AH, Yaseen ZM. Machine learning-based country-level annual air pollutants exploration using Sentinel-5P and Google Earth Engine. Sci. Rep. 2023;13(1):7968. DOI
- Seesaard T, Kamjornkittikoon K, Wongchoosuk C. A comprehensive review on advancements in sensors for air pollution applications. Sci. Total Environ. 2024;951:175696. DOI
- Mejía D, Alvarez H, Zalakeviciute R, Macancela D, Sanchez C, Bonilla S. Sentinel satellite data monitoring of air pollutants with interpolation methods in Guayaquil, Ecuador. Rem. Sens. Appl. Soc. Environ. 2023;31:100990. DOI
- The Air Quality Life Index (AQLI). UChicago. 2022. Retrieved 2025-09-14. Link
- World’s Most Polluted Countries in 2023 – PM2.5 Ranking. IQAir. 2025. Retrieved 2025-09-14. Link
- Salman NA, Al-Mishrey MK, Al-Saad HT, Rushdi A. Air pollution in the southern part of Iraq and its health risks. Aerosol optical depth and precipitation: measuring particle concentration, health risks and environmental impacts. Springer, Cham. 2024:107-22. DOI
- Tao H, Jawad AH, Shather AH, Al-Khafaji Z, Rashid TA, Ali M, Al-Ansari N, Marhoon HA, Shahid S, Yaseen ZM. Machine learning algorithms for high-resolution prediction of spatiotemporal distribution of air pollution from meteorological and soil parameters. Environ. Int. 2023;175:107931. DOI
- Ali SH, Al-Shiha AA, Qubaa AR. Spatial Analysis of the PM2.5 Air Pollution in Iraq by using R Language. I IOP Conf. Ser. Earth Environ. Sci. IOP Publishing. 2023;1223:012014. DOI
- Salih ZR, Othman BA, Aweez SJ. Assessment of heavy metals in rainfall as an indicator of air pollution from Erbil Steel Factory in Iraq. Environ. Monit. Assess. 2024;196(3):319. DOI
- World Health Organization. WHO global air quality guidelines: particulate matter (PM2.5 and PM10), ozone, nitrogen dioxide, sulfur dioxide and carbon monoxide. World Health Organization. 2021.
- Orellano P, Reynoso J, Quaranta N. Short-term exposure to sulphur dioxide (SO2) and all-cause and respiratory mortality: A systematic review and meta-analysis. Environ. Int. 2021;150:106434. DOI
- Das M, Das A, Singha S. The heat-pollution paradox: understanding the relationship between land surface temperature and air pollution in a heavily polluted megacity. Atmos. Pollut. Res. 2025;16(8):102531. DOI
- Al Ameri ID, Briant RM, Engels S. Drought severity and increased dust storm frequency in the Middle East: A case study from the Tigris-Euphrates alluvial plain, central Iraq. Weather. 2019;74(12):416-26. DOI
Cite this article:
Jumaah, H. J., Dawood, M. A., Abd Alreza, T. A., Meteab, M. A. Air pollution landscape in Iraq: A Sentinel-5P based assessment of key atmospheric pollutants. DYSONA – Applied Science, 2026;7(1): 82-87. doi: 10.30493/das.2025.539377