Arman Niknam 1*; Mehrnoosh Taherizadeh 2; Javid Hojabri Khushemehr 3; Thong Nguyen-Huy 4,5; Reza Sarli 6
1, Department of Geoinformatics physical and Environmental Geography, University of Szeged, Szeged, Hungary
2, Centre for Global Food and Resources, University of Adelaide, Adelaide 5005, Australia
3, Department of Remote Sensing and GIS, University of Tehran, Tehran, Iran
4, Centre for Applied Climate Sciences, University of Southern Queensland, Toowoomba, QLD, Australia
5, Faculty of Information Technology, Thanh Do University, Kim Chung, Hoai Duc, Ha Noi, Vietnam
6, Department of Forest Resources Management, Faculty of Forestry, University of Agriculture in Krakow, Krakow, Poland
E-mail:
armanniknaam@gmail.com
Received: 29/08/2025
Acceptance: 10/11/2025
Available Online: 13/11/2025
Published: 01/01/2026

Manuscript link
http://dx.doi.org/10.30493/DAS.2025.011311
Abstract
This study investigates the effectiveness of integrating meteorological and remotely sensed indicators for drought monitoring and zoning in four provinces of Iran. Specifically, the standardized precipitation index (SPI) derived from the existing meteorological stations was utilized to identify changes in precipitation during the crop growing season (April, May, and June). P-value statistics were applied to establish the significance of any precipitation trend changes and classify climate divisions. In addition, the vegetation health index (VHI), vegetation condition index (VCI), and temperature condition index (TCI) obtained from MODIS satellite images were employed to detect drought conditions from 2000 to 2019. The studied indices reveal a pronounced dryness trend in the eastern part of the examined provinces. Correlation analysis also indicates a robust correlation between TCI and SPI compared to other indices. This study contributes to the body of knowledge on drought monitoring and zoning by providing valuable insights into the usefulness of combining meteorological and remotely sensed indicators, as well as by identifying the areas most susceptible to drought and the indicators most suitable for assessing drought conditions in the studied provinces.
Keywords: Agricultural drought, Drought monitoring, Remote sensing, Climate change, Arid
Introduction
Drought is a complex phenomenon, as its onset and end are often difficult to predict, and its intensity depends on the region’s climatic conditions and the state of the water and energy balance. Drought events can last from several months to several decades, affecting multiple sectors such as economy, agriculture, and social aspects of society. Furthermore, the affected area can change over time. Drought has a significant impact on crop yields and subsequently on global food security, especially in the context of climate change, where the frequency and severity of droughts may increase [1].
Generally, droughts are classified as meteorological, hydrological, agricultural, and socio-economic [2]. A meteorological drought is characterized by a prolonged period of reduced precipitation in a specific region. On the other hand, a hydrological drought occurs when there is an insufficient amount of water available. An agricultural drought occurs when crops are significantly affected as a result of meteorological and associated hydrological drought conditions. Lastly, Drought’s impact extends to humans and industries, leading to socio-economic consequences [3][4]. In this context, Iran indicated a notable rise in the average temperature spanning a period of 25 to 50 years [5]. Also, reduced rainfall and its impact on surface and subsurface water flows, together with poor water management, have made Iranian farmers more vulnerable to drought [6].
Precipitation and temperature are the two most important weather indicators for meteorological drought monitoring. While precipitation directly reflects water availability, temperature can affect it by controlling evaporation and transpiration rates. These drought indicators can indicate different characteristics of drought [7]. On the other hand, vegetation condition is associated with agricultural drought. Vegetation is highly dependent on prevailing weather conditions and closely relates to weather indicators. Plant stress occurs when the water source (precipitation) cannot meet the plant’s water needs, leading to a lack of soil moisture and plant damage [8][9].
Remote sensing has been established as a useful method for studying plant growth, disease spreading, moisture content, dryness, and freshness [10][11], as it allows researchers to differentiate between living and non-living coverings based on their differential responses to electromagnetic waves. The use of remote sensing for drought monitoring can be traced back to its application in obtaining information from the earth’s vegetation. The calibration of satellite data with ground observations facilitates the use of satellite data in detecting drought onset, vegetation response to drought, and post-stress recovery [12].
Monitoring drought spread, severity, and environmental impacts over time is a challenging task. Therefore, drought indices are commonly used to identify drought [13]. Many drought indices have been developed in recent decades, mainly based on spectral canopy reflectance, soil surface temperature, plant water content, and vegetation condition [12]. Examples of such indices include the vegetation condition index (VCI), vegetation health index (VHI) [14], normalized difference vegetation index (NDVI) [15][16], temperature condition index (TCI) [12], and soil moisture index [17].
Scientific understanding of the correlation between different types of drought, such as meteorological and hydrological drought, is crucial for accurately predicting, preventing, and reducing the negative effects of drought on agriculture, water resources, the environment, and human life. Zhou et al. [18] recognized the impact of climate change and land use on the expansion from meteorological drought to hydrological drought in the Eastern Qaylan Mountains as one of the most destructive and costly natural disasters. The results showed that meteorological and hydrological drought occurred in the upper part of the Xiang River basin over the past 56 years. In particular, the intensity of hydrological drought was strongest in the 2000s, while the intensity of meteorological drought was weakest during that period, indicating an intensive expansion of meteorological drought to hydrological drought. However, the relationship between meteorological drought and hydrological drought varied spatially, with hydrological drought being more significant in the Huangyang River and its eastern tributaries than in its western tributaries.
Brown et al. [19] assessed the impacts of climate change, drought risk, and land suitability for agriculture as a result of land use in Scotland. The results of this case study indicated that drought risk will significantly impact future land use. This could limit livestock and crop production, thus reducing land capacity in some areas, unless strategic adaptation measures are developed that balance land use systems and water resources with the integration of the wider environment. Zhang and Jia [20] analyzed meteorological drought in the semi-arid region of northern China using remote sensing data from multiple microwave sensors. Their results showed that composite microwave indices perform better in drought monitoring. Liu et al. [21] investigated drought in China using composite indicators from a Moderate Resolution Imaging Spectroradiometer (MODIS) sensor data and concluded that drought is one of the most common disasters in northern China and has major impacts on agriculture, the environment, and the economy. In that study, Pearson correlation analysis was also conducted between satellite-derived drought indicators and standardized precipitation evapotranspiration index (SPEI) in different time scales to evaluate the ability of each indicator in drought monitoring Shandong Province. Orimoloye et al. [22] studied drought using MODIS sensor images in South Africa and emphasized ecosystem and environmental protection. They concluded that drought is one of the main factors limiting plant development in a variety of environments. In addition, they showed that the 16-day Terra-MODIS composite and enhanced vegetation index (EVI) products are sensitive to stressors associated with drought and the MODIS-based VCI is useful for drought monitoring. These findings demonstrate the suitability of MODIS data for assessing drought conditions and their potential environmental impacts.
Shad et al. [23] investigated drought in Isfahan Province, Iran, using vegetation indicators and MODIS data. The correlation coefficients of SPI and vegetation indices for monitoring drought in the research area showed that NDVI and VCI are reliable indicators. The sensitivity of the plants to drought has been assessed for the four major climatic types using remote sensing data. The findings showed that climatic and topographical variables have various effects on the vegetation susceptibility index, making it a valuable index for measuring this possibility. Hosseini et al. [24] evaluated the relationships between the vegetation condition and the meteorological drought indices in dry farming of the Lorestan province, Iran. Multivariate linear regression revealed a significant correlation between SPI and VCI over 9- and 12-month periods.
Drought is the result of prolonged dry and anomalous weather conditions, leading to a change in vegetation [25]. Plants respond rapidly to climate change, as evidenced by changes in phenology and plant production over time. Climate can cause changes in vegetation density and growth that may take decades to occur [26]. Agricultural productivity in arid and semi-arid regions is predicted to decline significantly due to climate change and drought, which presents a fundamental challenge to the living standards of rural households [27]. For these reasons, efforts should be directed toward drought detection and monitoring [28].
Iran’s climate can be characterized by arid and semiarid regions. The country has experienced both low- and high-intensity droughts due to its geographic region and natural features [29]. Since the start of the twenty-first century, Iran has endured prolonged drought resulting in the disappearance of wetlands and lakes, along with widespread extreme water stress [30]. Iran experiences less than one-third of the world’s average yearly precipitation, but more than three times as much evaporation [31]. Drought is a serious risk with far-reaching impacts on the soil and economy, and it poses threats to the livelihood and health of the local population. As an illustration, In the manner that, four million hectares of rainfed and 2.7 million hectares of irrigated land were devastated during the 2001 drought [32]. The phenomenon of climate change-induced migration has proliferated among rural communities, with rural movement being perceived as a means of adapting to environmental hazards, notably drought [33]. The recurrent and succeeding droughts in Iran that have reduced farmers’ thresholds and obliterated their livelihoods may be to blame for this outcome [34].
The eastern slopes of Zagros Mountain in Iran include several provinces – Chaharmahal and Bakhtiari, Qom, Markazi, and Isfahan. These areas showed a significant decrease in rainfall in recent years compared to the expected average. The Isfahan metropolitan area has had a notable influx of population over the past two decades due to job prospects and the influence of climate change, particularly drought, on agricultural activities [35]. Also, Chaharmahal and Bakhtiari, Qom and Markazi are the provinces most vulnerable to climate change, which will cause drought and agricultural degradation [36-38]. Nevertheless, there is lack of investigations into the spatial-temporal dynamics among different drought types and socio-economic impacts of drought, which are essential for geographic environment evaluation, planning, and management.
The objective of the current study is to measure and analyze the spatial-temporal relationship between agricultural drought and meteorological drought on the eastern slopes of Zagros Mountain. Agricultural drought indicators, including VCI, TCI, and VHI, are derived MODIS Terra satellite imagery, while the meteorological drought indicator, SPI, is based on the observed data from weather stations. Subsequently, this research also aims to determine the effectiveness of using remote sensing methods to represent drought conditions in data-scarce regions.
Materials and Methods
Study area
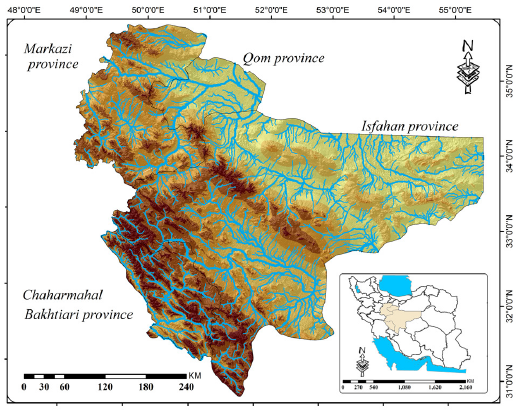
The study area consists of four provinces including Chaharmahal and Bakhtiari (Ch&B), Qom (Qm), Markazi (Ma), and Isfahan (Is) (Fig. 1). Chaharmahal and Bakhtiari (Ch & B) province is located in the central part of the Zagros Mountain Chains in southwestern Iran and covers an area of 16,332 km2. The annual rainfall in this province is 560 mm, and the average yearly temperature ranges from 8.5 to 200C. Ch & B province has an average height of 2,153 m, and its climate varies from hot and dry during summer to cold and wet in winters [39]. Qom province, with an area of 11,500 km2, is located in an arid and semi-arid region of Iran [40]. The province’s average elevation is 933 m above sea level. Two vast deserts with hot and dry weather are adjacent to this province [41]. Markazi province has an area of 29,530 km2, with elevations ranging between 1,200 m and 3,388 m above sea level [42]. The province has a semi-arid climate and experiences an average yearly temperature of 13.7°C and 209.5 mm of rainfall [43]. Isfahan province covers an area of 107,045 km2, accounting for approximately 6.57% of the country’s total area. It is located in the center of the Iranian plateau and comprises many mountainous and plain regions. The average annual rainfall in this province is 150 mm, which is indicative of an arid climate. The climate in this province can also be categorized as semi-humid, desert, or steppe [44].
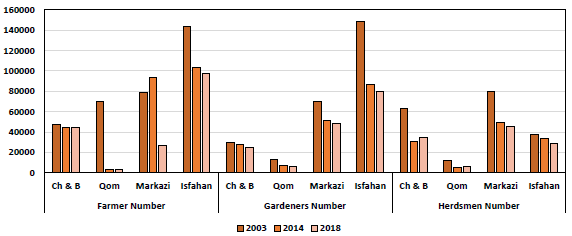
According to data obtained from the National Portal of Statistics in 2016, the estimated population residing within these provinces is roughly 8.8 million individuals, with 1.34 million of them (15.2%) living in the rural area. In addition, it is noteworthy that out of the total of 6590 villages in this area, 2702 villages (41%) are classified as deserted. The primary livelihoods of the majority of individuals residing within these regions revolve around agricultural activities, horticultural practices, and animal husbandry [45].
The statistical distribution of agricultural occupations in the rural areas (Fig. 2) showed that between 2003 and 2018, almost 44% of the rural population lost their jobs. the exacerbation of climate change may have diminished the prosperity of livelihoods and prompted migration from the community. Consequently, this phenomenon will result in a significant influx of individuals relocating from rural regions to metropolitan centers [46].
Data acquiring
Weather data
Total precipitation data for the three months of April, May, and June (AMJ) from 23 stations in Isfahan, 11 stations in Markazi, 5 stations in Qom, and 7 stations in Ch & B provinces for the same period from the National Meteorological Organization website. These months were selected due to their typically lower cloud cover compared to winter months (January, February, March), allowing for biomass conditions to be determined with minimal information loss. Additionally, vegetation is affected by the previous three months’ precipitation and shows higher spectral reflective characteristics during the growing season (AMJ), when tree leaves are green and pasture vegetation is present. In contrast, distinguishing between vegetation surfaces based on temperature and thermal conditions becomes difficult when plant water reserves are saturated during relatively wet winter months.
Satellite data
Although many sensors are used in drought monitoring research, this study used MODIS sensor data because it provides different bands and potential electromagnetic spectrum, which are more suitable for drought monitoring than other sensors [47][48]. MODIS Terra satellite images with a spatial resolution of 1 km × 1 km were obtained from the Earthdata Search data portal. A total of 120 MODIS satellite images, including 60 images of NDVI and 60 images of land surface temperature (LST), were acquired for all 3 months of each year over a period of 20 years (2000 – 2019). These satellite-derived data were used to investigate drought phenomena and inform about the state of vegetation in the study area.
Methods
Data processing and spatial-temporal analysis
The satellite data were processed and extracted to each meteorological station using ENVI and ArcGIS software. A coefficient of 0.0001 was applied to NDVI images to rescale their values to (-1,1) according to the MODIS product instruction. The calculations of all indices including SPI, TCI, VCI, and VHI are briefly described in the flowing sections. The spatial-temporal correlation analysis among drought indices were performed using the Pearson’s correlation coefficient at a significance level p<0.05.
Climate parameters undergo temporal and spatial changes influenced by various factors, and these changes can be analyzed through observations and statistical methods. Trend analysis using the p-value statistic is a commonly used statistical approach to assess the potential impact of climate change on time series data, such as precipitation observations across different parts worldwide. The p-values for the SPI were estimated for both three-month and the entire year using the hypothesis test that compares the mean of a sample with a series of numbers. The SPI trend is statistically significant if the p-value is less than 0.05 [49-51].
Selection of interpolation methods
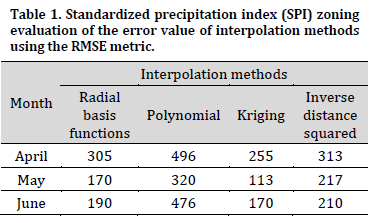
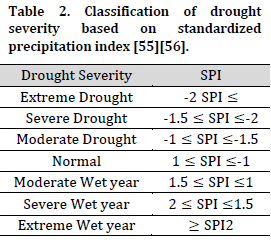
In order to match station-based meteorological drought (i.e., point values) with satellite-based agricultural drought (i.e., gridded values), this study applied various interpolation methods including inverse distance squared, polynomial, radial basis functions, and kriging methods to create the SPI map. Evaluation of the error indicated that the kriging algorithm yielded a lower error value compared to other interpolation methods (Table 1). Furthermore, the kriging method preserves the range of the climate index, making it advantageous for generating the interpolated SPI map. Consequently, the kriging method was selected, and the data were zoned according to the drought categories (Table 2).
Standardized precipitation index (SPI)
The standard precipitation index (SPI) is a fundamental metric used in drought research, and its calculation requires the long-term average and standard deviation of the precipitation values for the studied periods [52]. The purpose of this index is to define and monitor drought and wet years [53]. The SPI value for a desired period can be calculated using the following equation:
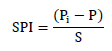
where Pi denotes the amount of precipitation, P is the long-term average of the precipitation, and S signifies the standard deviation of the precipitation. The gamma distribution is used to fit the precipitation data and determine the parameters for the SPI profile.
One key strength of the SPI is its capability to characterize meteorological drought across various timescales. This feature illustrates that a region can experience favorable conditions in the short term while simultaneously enduring the effects of a preceding prolonged drought [54]. Given that one of the research objectives was to explore the impact of drought during the growing season (AMJ), the SPI emerged as a reasonable input variable.
This study calculated the SPI-3 to account for the rainfall accumulation during the AMJ period. The resulting SPI value for each period is then classified into seven drought classes (Table 2) [55][56].
Vegetation condition index (VCI)
The vegetation condition index (VCI) is calculated and normalized using a range of long-term vegetation values. VCI values range from 0 to 100, with low values indicating plant stress. A VCI value approaching zero percent indicates a very dry month, while higher values indicate an improvement in drought conditions as vegetation levels increase. Low VCI values for successive time intervals indicate the increase in drought, as defined by the following equation [14][57]:
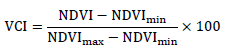
where NDVI is based on the ratio between the values of red (R) and near infrared (NIR) bands as:
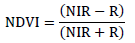
The numerical value of NDVI ranges from -1 to 1, where positive values correspond to dense vegetation, and values close to zero correspond to areas without vegetation [58].
Temperature condition index (TCI)
The vegetation in various parts of the study area experienced stress due to high temperatures combined with a lack of precipitation. Land surface temperature (LST) directly influences the temperature condition index (TCI), which can detect both excessive wetness and dryness in a specific location [59]:
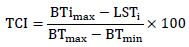
In this relation, the LST of the output image is measured in degrees Celsius, while BT represents the brightness temperature (band 31), and i denotes the evaluation year. The maximum and minimum BT values are determined based on long-term recorded data for each year. When the TCI value reaches 100%, the BT for that month corresponds to the lowest long-term BT value for the pixel. Low TCI values, approaching zero percent, indicate extremely hot weather for that specific year. Additionally, when TCI reaches zero percent, the BT for that year equals the maximum long-term BT value for the pixel.
Vegetation health index (VHI)
The VHI has been demonstrated to represent overall vegetation health by combining estimations of moisture and thermal conditions. VHI is computed using the relation with VCI and TCI as expressed in the following equation [60]:
VHI = (0.5 × VCI) + (0.5 × TCI)
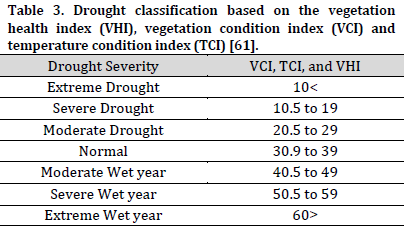
The drought categories based on the VHI, VCI, and TCI are presented in Table 3.
Results
Spatial-temporal analysis of meteorological and agricultural droughts
The analysis of the correspondence between the satellite-derived indices (VCI, TCI, and VHI) and the average SPI values at each station showed similarities in the reporting of drought and wet year events (Fig. 3). The results revealed an increasing trend in the average VHI values during the early months of the pasture growing season (April and May) in the western half of all provinces (Fig. 3 J-L). At the same time, the SPI values for these two months exhibited a positive trend in the western half of the provinces due to spring rainfall (Fig. 3 A-C). The TCI values were relatively high throughout all three months (Fig. 3 D-F). These observations can be explained by the small variations in surface temperatures and the large differences in the amount of vegetation cover across different months and areas within the provinces.
Vegetation, being highly influenced by drought, is directly influenced by precipitation, and inversely affected by temperature. In other words, an increase in temperature coupled with a decrease in precipitation is expected to intensify the impact of drought on vegetation in the study area.
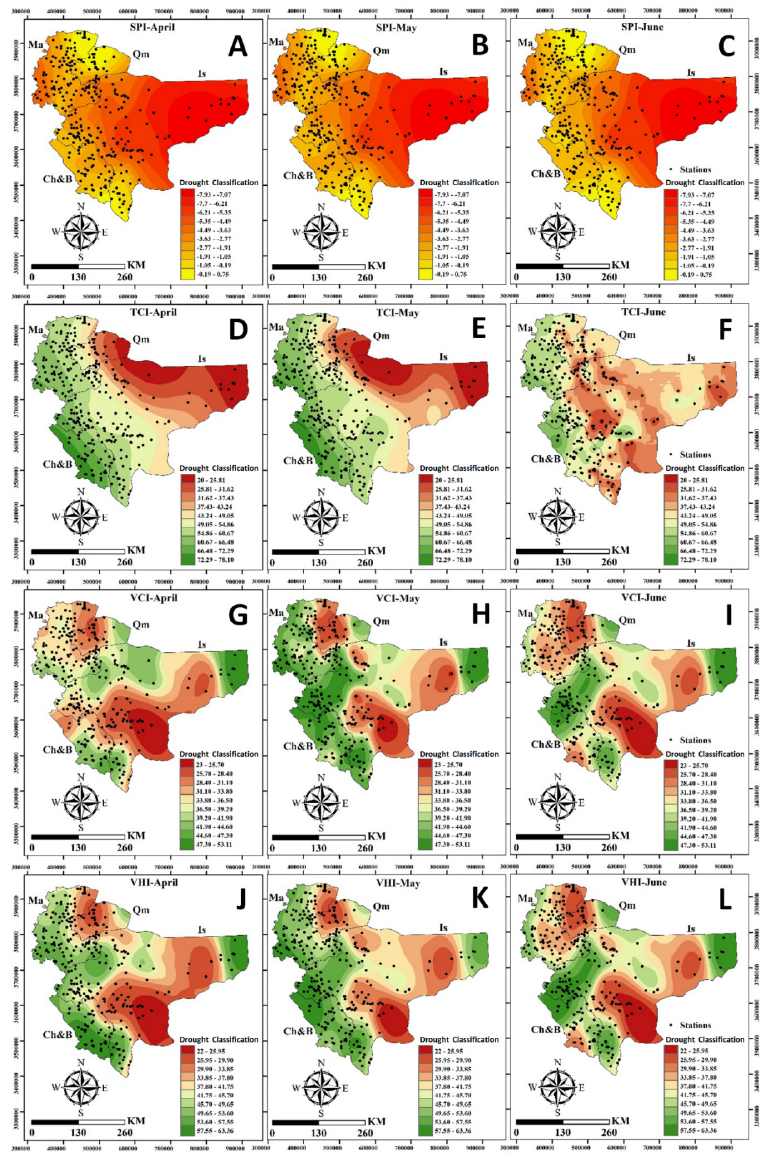
The SPI maps for April, May, and June (Fig. 3 A-C, respectively) depict a gradual spatial transition in drought severity across the area. During April, significant regions in the central and eastern zones (especially near Isfahan) are experiencing severe to extreme drought, while the western and northern regions (Markazi and Ch&B) exhibit milder, near-normal conditions. By May, these drought trends continue but show slight improvement in the northwest, implying localized recovery from rainfall. The central and eastern zones still face moderate to severe drought conditions, although the overall gradient has lessened compared to April. In June, there is a noticeable decrease in drought intensity. Most areas in the northern and western regions are shifting toward normal to moderately dry classifications, indicating a stabilization of rainfall, while remaining drought stress is confined to a few isolated eastern areas.
The TCI in April (Fig. 3 D) indicates high thermal stress dominates the northeastern and central plains (Qm–Is), where values drop below 31, signifying extreme heat conditions and elevated evapotranspiration. The southern highlands (Ch&B) and western slopes (Ma) show higher TCI (>55), benefiting from cooler microclimates and higher elevation. During May (Fig. 3 E), temperature stress slightly decreases, particularly across the southwest and mid-elevations, suggesting transient relief from early-season rains. Nonetheless, the northeastern and eastern parts remain hot and dry, maintaining low TCI values. By June (Fig. 3 F), widespread thermal stress reappears, covering much of the east and southeast, with TCI ranging from 20 to 33, reflecting the onset of the dry summer season. The persistence of high heat load aligns with vegetation decline observed in both VCI (Fig. 3 G-I) and VHI (Fig. 3 J-L) maps.
For the VCI in April (Fig. 3 G), extensive portions of the central and southern regions show low values (VCI 23–31), indicating moderate to severe drought stress, especially around the Ch&B and Isfahan areas. The northern highlands (Qm–Ma) exhibit slightly better vegetation conditions, though still under mild drought. By May (Fig. 3 H), vegetation conditions improve considerably, with most of the central and western regions transitioning to normal or moist categories (VCI >39). This improvement corresponds to seasonal rainfall and temperature moderation. However, pockets of stress persist in the southern plains, where vegetation remains vulnerable. In June (Fig. 3 I), vegetation health begins to decline again in the south-central belt, as indicated by the expansion of red and orange zones (VCI < 33), likely due to rising temperatures and reduced soil moisture. The western highlands zone remains relatively stable, with healthier vegetation.
The VHI index in April (Fig. 3 J) indicates that severe drought zones (VHI < 30) extend across southern Isfahan and northern Ch&B, while moderate drought conditions (30–38) dominate the northeastern plateau. Vegetation health remains comparatively better in Ma and western Qm, where VHI exceeds 47. In May (Fig. 3 K), improvements are evident, especially in the western and central regions, as rainfall and vegetation greenness recover. The proportion of moderately stressed areas decreases, and the spatial pattern becomes more heterogeneous, reflecting localized rainfall distribution. By June, however (Fig. 3 L), vegetation stress re-intensifies, particularly in the southern and central zones, where VHI values return to 22–33, highlighting a transition toward dry-season. In contrast, northwestern sectors maintain moderate to good vegetation health (VHI > 50), suggesting resilience due to terrain and microclimatic factors.
Pearson correlation between SPI and satellite indicators
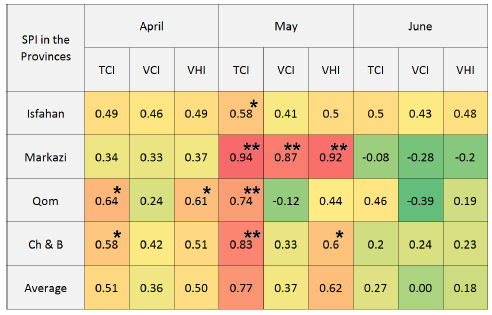
Significant correlation values were observed in April and May between SPI and TCI across all provinces. For instances, in May, highly significant positive correlation was observed in Markazi (r = 0.94**), Qom (r = 0.74**), Ch & B (r = 0.83**), and Isfahan (r = 0.58*) (Fig. 4). This observation highlights that the thermal stress as captured by TCI is most responsive to precipitation anomalies during mid-growing season. VHI also demonstrates robust correlations in May, especially in Markazi (r = 0.92**) and Ch & B (r = 0.6*), indicating its utility as an integrated drought metric during this critical period. Overall, TCI emerges as the most reliable satellite proxy for meteorological drought during spring, particularly in May, whereas VHI offers complementary value through its combined thermal-vegetative signal
Discussion
In order to gain a comprehensive understanding of drought events, it is important to investigate drought phenomena using a range of drought indices, while also conducting a thorough analysis of their interactions [62]. This research focused on four significant drought indices that represent different types of droughts, taking into consideration their usage, features, and data accessibility. Specifically, the study examined the standardized precipitation index (SPI) as an indicator of meteorological drought, while the vegetation condition index (VCI), temperature condition index (TCI), and vegetation health index (VHI) were analyzed as indices for agricultural drought. Validating the findings from satellite image estimations by comparing them against ground truth data obtained through in situ measurements (i.e., SPI) also demonstrates the reliability and significance of this research. The SPI, developed by McKee et al. [63] and endorsed by the World Meteorological Organization (WMO), is a widely accepted tool for assessing climatic drought conditions over different time periods in any given region [64]. In summary, indices such as SPI, VCI, TCI, and VHI serve as valuable instruments for monitoring and forecasting drought events. For that reason, they have been extensively employed in detecting droughts and evaluating agricultural health [65-71].
Remote sensing data on agricultural drought reveals various time-delayed responses to meteorological drought. The correlations between meteorological drought and remotely sensed drought exhibit a slow response in each area [72]. In this study, the results of the different indicators necessitate the use of a single criterion to validate their effectiveness. Based on the correlation analysis, the TCI demonstrates a stronger association with the SPI compared to the other indices. Specifically, the TCI exhibits the highest correlation with thermal indices in the short term, at a significance level of 1%. As the duration increases, the correlation between the climatic drought index, plant water content indices, and thermal indices also strengthens. This is because, in the case of a prolonged decrease in precipitation, the development of agricultural drought is influenced by factors such as the duration and location of meteorological drought, regional irrigation conditions, and crop composition [73]. The positive correlation observed between vegetation cover, plant water content indicators, and climatic dryness indicators suggests a corrective trend of changes. Therefore, the temperature index proves to be a more accurate indicator of drought conditions, making it a suitable method for drought estimation. The results of the study are consistent with the findings of Du et al. [25], Wilhite et al. [9], and Liu et al. [21], who showed that remote sensing indicators have good accuracy in drought monitoring.
The findings of this study will provide valuable insights for fellow researchers and local stakeholders in comprehending and discerning the hazards and vulnerabilities associated with both dry and rainy occurrences. The acquisition of this knowledge will have positive implications for various aspects of water resource management, sustainable development, information distribution, protection, prevention, and risk forecasting within the region. Additional investigation is necessary in order to build a robust scientific basis for the development of risk management techniques and monitoring instruments.
Drought indicators such as the SPI rely on data collected from specific sites, such as weather stations, which may not accurately represent the extent of drought in a given area. Therefore, the severity and spatial coverage of drought conditions may not be fully captured by these indicators. Additionally, they may lack detailed information about the factors contributing to or impacted by drought, which are essential for a comprehensive understanding of its full extent. Establishing a threshold level is necessary for classifying drought severity. Currently, most studies employ a fixed threshold level, often based on the long-term mean of the drought variable. However, the selection of an appropriate threshold is crucial for improving the understanding of drought parameters [74]. Consequently, further research is needed to determine suitable threshold levels for different hydroclimatic regions. Despite their potential usefulness in providing insights into vegetation dynamics, the accuracy of indices such as the VCI, VHI, and TCI is limited. These indices rely on assumptions regarding the relationship between vegetative factors and remote sensing data, which may not always hold true in diverse environments.
In order to enhance the effectiveness of drought research in areas without access to synoptic stations, it is crucial to expand and utilize remote sensing methods, while also comparing them with traditional meteorological approaches. This allows for a more comprehensive analysis of drought patterns and their impacts. Furthermore, investigating the process of climate change can aid in predicting the duration of drought events, enabling better preparedness and mitigation strategies. The application of Geographic Information System (GIS) technology in drought zoning is another valuable approach to minimize follow-up costs associated with drought management. By effectively delineating drought-prone areas, resources can be allocated more efficiently.
Conclusion
The study findings demonstrate that the impacts of drought on vegetation and surface temperature vary and are influenced by factors such as the month, vegetation type, and temperature conditions. The strong correlation observed between the SPI and satellite-derived information (specifically TCI, and VHI) indicates the valuable role of satellite imagery in monitoring and managing drought. Overall, the research results suggest that the eastern half of the studied provinces experienced more severe drought compared to the western half, potentially leading to significant threats such as the release of dust particles, environmental crises, and reductions in agricultural production in these regions. Thus, effective drought mitigation hinges on several interdependent strategies: tailoring adaptation measures to the specific climatic and socioeconomic conditions of the area, engaging communities in context-specific ways, adjusting data sources and technology to local availability, aligning policies with regional governance structures, promoting collaboration between neighboring areas, and emphasizing sustainable practices for long-term resilience.
Conflict of interest statement
The authors declared no conflict of interest.
Funding statement
The authors declared that no funding was received in relation to this manuscript.
Data availability statement
The authors declared that all used datasets will be available upon reasonable request from the corresponding author.
References
- Tian W, Liu X, Liu C, Bai P. Investigation and simulations of changes in the relationship of precipitation-runoff in drought years. J. Hydrol. 2018;565:95-105. DOI
- Hoque MA, Pradhan B, Ahmed N. Assessing drought vulnerability using geospatial techniques in northwestern part of Bangladesh. Sci. Total Environ. 2020;705:135957. DOI
- Ding Y, Gong X, Xing Z, Cai H, Zhou Z, Zhang D, Sun P, Shi H. Attribution of meteorological, hydrological and agricultural drought propagation in different climatic regions of China. Agric. Water Manag. 2021;255:106996. DOI
- Arabameri A, Chandra Pal S, Santosh M, Chakrabortty R, Roy P, Moayedi H. Drought risk assessment: integrating meteorological, hydrological, agricultural and socio-economic factors using ensemble models and geospatial techniques. Geocarto Int. 2021;37(21):6087-115. DOI
- Koocheki A, Nasiri M, Kamali GA, Shahandeh H. Potential Impacts of Climate Change on Agroclimatic Indicators in Iran. Arid Land Res. Manag. 2006;20(3):245-59. DOI
- Zarafshani K, Sharafi L, Azadi H, Hosseininia G, De Maeyer P, Witlox F. Drought vulnerability assessment: The case of wheat farmers in Western Iran. Glob. Planet. Change. 2012;98-99:122-30. DOI
- Tirivarombo S, Osupile D, Eliasson P. Drought monitoring and analysis: Standardised Precipitation Evapotranspiration Index (SPEI) and Standardised Precipitation Index (SPI). Phys. Chem. Earth. 2018;106:1-10. DOI
- Sheffield J, Goteti G, Wen F, Wood EF. A simulated soil moisture based drought analysis for the United States. J. Geophys. Res. Atmos. 2004;109(D24):2004JD005182. DOI
- Wilhite DA, Sivakumar MV, Pulwarty R. Managing drought risk in a changing climate: The role of national drought policy. Weather Clim. Extrem. 2014;3:4-13. DOI
- Huete A. Remote Sensing for Environmental Monitoring. In: Environmental Monitoring and Characterization. Elsevier. 2004. DOI
- Niknam A, Sarli R, Taherizadeh M, Attarroshan S, Pourmansouri F. REDD implementation for greenhouse gas reduction and climate change mitigation in Hyrcanian forests: a case study of the Kojoor Watershed, Northern Iran. Environ. Monit. Assess. 2024;196(5):474. DOI
- Bayarjargal Y, Karnieli A, Bayasgalan M, Khudulmur S, Gandush C, Tucker C. A comparative study of NOAA–AVHRR derived drought indices using change vector analysis. Remote Sens. Environ. 2006;105(1):9-22. DOI
- Liu X, Zhu X, Pan Y, Li S, Liu Y, Ma Y. Agricultural drought monitoring: Progress, challenges, and prospects. J. Geogr. Sci 2016;26(6):750-67. DOI
- Kogan F. Application of vegetation index and brightness temperature for drought detection. Adv. Space Res. 1995;15(11):91-100. DOI
- Ding S, Rulinda CM, Stein A, Bijker W. NDVI time series and markov chains to model the change of fuzzy vegetative drought classes. In 2011 6th International Workshop on the Analysis of Multi-temporal Remote Sensing Images (Multi-Temp). IEEE. 2011:201-4. DOI
- Taherizadeh M, Khushemehr JH, Niknam A, Nguyen-Huy T, Mezősi G. Revealing the effect of an industrial flash flood on vegetation area: A case study of Khusheh Mehr in Maragheh-Bonab Plain, Iran. Remote Sens. Appl. Soc. Environ. 2023;32:101016. DOI
- Gu L, Hanson PJ, Post WM, Kaiser DP, Yang B, Nemani R, Pallardy SG, Meyers T. The 2007 Eastern US Spring Freeze: Increased Cold Damage in a Warming World? BioScience. 2008;58(3):253-62. DOI
- Zhou J, Li Q, Wang L, Lei L, Huang M, Xiang J, Feng W, Zhao Y, Xue D, Liu C. Impact of Climate Change and Land-Use on the Propagation from Meteorological Drought to Hydrological Drought in the Eastern Qilian Mountains. Water. 2019;11(8):1602. DOI
- Brown I, Poggio L, Gimona A, Castellazzi M. Climate change, drought risk and land capability for agriculture: implications for land use in Scotland. Reg. Environ. Change. 2010;11(3):503-18. DOI
- Zhang A, Jia G. Monitoring meteorological drought in semiarid regions using multi-sensor microwave remote sensing data. Remote Sens. Environ. 2013;134:12-23. DOI
- Liu Q, Zhang S, Zhang H, Bai Y, Zhang J. Monitoring drought using composite drought indices based on remote sensing. Sci. Total Environ. 2020;711:134585. DOI
- Orimoloye IR, Belle JA, Ololade OO. Drought disaster monitoring using MODIS derived index for drought years: A space-based information for ecosystems and environmental conservation. J. Environ. Manag. 2021;284:112028. DOI
- Shad MS, Ildoromi AR, Akhzari D. Drought monitoring using vegetation indices and MODIS data (Case study: Isfahan Province, Iran). J. Rangel. Sci. 2017;7:148-59.
- Hosseini TS, Ghermezcheshmeh B, Hosseini SA. The Assessment of Meteorological Drought Impact on the Vegetation Health Index. Remote Sens. Earth Syst. Sci. 2022;5(3):185-92. DOI
- Yu H, Li L, Li J. Establishment of comprehensive drought monitoring model based on downscaling TRMM and MODIS data. J. Nat. Resour. 2020;35(10):2553. DOI
- Stow DA, Hope A, McGuire D, Verbyla D, Gamon J, Huemmrich F, Houston S, Racine C, Sturm M, Tape K. Remote sensing of vegetation and land-cover change in Arctic Tundra Ecosystems. Remote Sens. Environ. 2004;89(3):281-308. DOI
- Zhang P, Zhang J, Chen M. Economic impacts of climate change on agriculture: The importance of additional climatic variables other than temperature and precipitation. J. Environ. Econ. Manag. 2017;83:8-31. DOI
- Zhao H, Xu Z, Zhao J, Huang W. A drought rarity and evapotranspiration-based index as a suitable agricultural drought indicator. Ecol. Indic. 2017;82:530-8. DOI
- Zarei R, Sarajian M, Bazgeer S. Monitoring meteorological drought in Iran using remote sensing and drought indices. Desert. 2013;18(1):89-97.
- Ashraf S, Nazemi A, AghaKouchak A. Anthropogenic drought dominates groundwater depletion in Iran. Sci. Rep. 2021;11(1):9135. DOI
- Saatsaz M. A historical investigation on water resources management in Iran. Environ. Dev. Sustain. 2019;22(3):1749-85. DOI
- Fathi-Taperasht A, Shafizadeh-Moghadam H, Kouchakzadeh M. MODIS-based evaluation of agricultural drought, water use efficiency and post-drought in Iran; considering the influence of heterogeneous climatic regions. J. Clean. Prod. 2022;374:133836. DOI
- Sharafi L, Zarafshani K, Keshavarz M, Azadi H, Van Passel S. Drought risk assessment: Towards drought early warning system and sustainable environment in western Iran. Ecol. Indic. 2020;114:106276. DOI
- Savari M, Moradi M. The effectiveness of drought adaptation strategies in explaining the livability of Iranian rural households. Habitat Int. 2022;124:102560. DOI
- Suleimany M. Urban climate justice in hot-arid regions: Vulnerability assessment and spatial analysis of socio-economic and housing inequality in Isfahan, Iran. Urban Clim. 2023;51:101612. DOI
- Akhbari M, Basiri Sadr M. Mapping of Iran regions based on indicators of Climate Change impacts. J. Clim. Res. 2024;1402(55):65-86.
- Yeganegi Dv, Sharifzadegan Mh, Mobarghei Dn. Assessing the quality of drought adaptation in Regional Plans-case study of Chaharmahal and Bakhtiari province. Environ. Resour. Res. 2021;9(2):133-42.
- Khusfi ZE, Zarei M. Relationships between meteorological drought and vegetation degradation using satellite and climatic data in a semi-arid environment in Markazi Province, Iran. J. Rangel. Sci. 2020;10(2):204.
- Nematollahi S, Fakheran S, Kienast F, Jafari A. Application of InVEST habitat quality module in spatially vulnerability assessment of natural habitats (case study: Chaharmahal and Bakhtiari province, Iran). Environ. Monit. Assess. 2020;192(8):487. DOI
- Azarakhshi M, Mahdavi M, Arzani H, Ahmadi H. Assessment of the Palmer drought severity index in arid and semi arid rangeland:(Case study: Qom province, Iran). Desert. 2011;16(2):77-86.
- Shamabadi N, Bakhtiari H, Kochakian N, Farahani M. The Investigation and Designing of an Onsite Grey Water Treatment Systems at Hazrat-e-Masoumeh University, Qom, IRAN. Energy Procedia. 2015;74:1337-46. DOI
- Khadivi-Khub A. Genetic divergence in seedling trees of Persian walnut for morphological characters in Markazi province from Iran. Braz. J. Bot. 2014;37(3):273-81. DOI
- Yousefi H, Hafeznia H, Yousefi-Sahzabi A. Spatial Site Selection for Solar Power Plants Using a GIS-Based Boolean-Fuzzy Logic Model: A Case Study of Markazi Province, Iran. Energies. 2018;11(7):1648. DOI
- Soffianian A, Madanian M. Monitoring land cover changes in Isfahan Province, Iran using Landsat satellite data. Environ. Monit. Assess. 2015;187(8):543. DOI
- Statistical Center of Iran (SCI), Organizational Portal. 2016. [Online]. Available from: Link
- Aliabadi V, Ataei P, Gholamrezai S. Farmers’ Strategies for Drought Adaptation Based on the Indigenous Knowledge System: The Case of Iran. Weather Clim. Soc. 2022;14(2):561-8. DOI
- Ceccato P, Flasse S, Tarantola S, Jacquemoud S, Grégoire J. Detecting vegetation leaf water content using reflectance in the optical domain. Remote Sens. Environ. 2001;77(1):22-33. DOI
- Roshan G, Sarli R, Ghanghermeh A, Taherizadeh M, Niknam A. Using satellite-derived land surface temperatures to clarify the spatiotemporal warming trends of the Alborz Mountains in northern Iran. J. Mt. Sci. 2024;21(2):449-69. DOI
- Alkarkhi AF. The observed significance level (P-value) procedure. In: Applications of Hypothesis Testing for Environmental Science. Elsevier. 2021:79-119. DOI
- Stijnen T. Confidence intervals and P-values. Neth. J. Med. 1996;49(4):177-82. DOI
- Beck-Bornholdt H, Dubben H. Potential pitfalls in the use of p-values and in interpretation of significance levels. Radiother. Oncol. 1994;33(2):171-6. DOI
- Bonaccorso B, Bordi I, Cancelliere A, Rossi G, Sutera A. Spatial Variability of Drought: An Analysis of the SPI in Sicily. Water Resour. Manag. 2003;17(4):273-96. DOI
- Tsakiris G, Vangelis H. Towards a Drought Watch System based on Spatial SPI. Water Resour. Manag. 2004;18(1):1-12. DOI
- Guillory L, Pudmenzky C, Nguyen-Huy T, Cobon D, Stone R. A drought monitor for Australia. Environ. Model. Softw. 2023;170:105852. DOI
- Bouaziz M, Medhioub E, Csaplovisc E. A machine learning model for drought tracking and forecasting using remote precipitation data and a standardized precipitation index from arid regions. J. Arid Environ. 2021;189:104478. DOI
- Liu Z, Li Q, Nguyen L, Xu G. Comparing Machine-Learning Models for Drought Forecasting in Vietnam’s Cai River Basin. Pol. J. Environ. Stud. 2018;27(6):2633-46. DOI
- Kogan FN. Global Drought Watch from Space. Bull. Am. Meteorol. Soc. 1997;78(4):621-36. DOI
- Rouse Jr JW, Haas RH, Schell JA, Deering DW. Monitoring the vernal advancement and retrogradation (green wave effect) of natural vegetation. Texas A&M University, Remote Sensing Center College Station, Texas. 1973.
- Wolteji BN, Bedhadha ST, Gebre SL, Alemayehu E, Gemeda DO. Multiple indices based agricultural drought assessment in the rift valley region of Ethiopia. Environ. Chall. 2022;7:100488. DOI
- Du TLT, Bui DD, Nguyen MD, Lee H. Satellite-Based, Multi-Indices for Evaluation of Agricultural Droughts in a Highly Dynamic Tropical Catchment, Central Vietnam. Water. 2018;10(5):659. DOI
- Bhuiyan C. Desert vegetation during droughts: response and sensitivity. Int. Arch. Photogramm. Remote Sens. Spat. Inf. Sci. 2008;37:907-12.
- Zhang L, Jiao W, Zhang H, Huang C, Tong Q. Studying drought phenomena in the Continental United States in 2011 and 2012 using various drought indices. Remote Sens. Environ. 2017;190:96-106. DOI
- McKee TB, Doesken NJ, Kleist J. The relationship of drought frequency and duration to time scales. InProceedings of the 8th Conference on Applied Climatology 1993;17(22):179-83.
- Gidey E, Dikinya O, Sebego R, Segosebe E, Zenebe A. Using Drought Indices to Model the Statistical Relationships Between Meteorological and Agricultural Drought in Raya and Its Environs, Northern Ethiopia. Earth Syst. Environ. 2018;2(2):265-79. DOI
- Shah R, Bharadiya N, Manekar V. Drought Index Computation Using Standardized Precipitation Index (SPI) Method For Surat District, Gujarat. Aquat. Procedia. 2015;4:1243-9. DOI
- Sahoo RN, Dutta D, Khanna M, Kumar N, Bandyopadhyay SK. Drought assessment in the Dhar and Mewat Districts of India using meteorological, hydrological and remote-sensing derived indices. Nat. Hazard. 2015;77(2):733-51. DOI
- Dutta D, Kundu A, Patel N. Predicting agricultural drought in eastern Rajasthan of India using NDVI and standardized precipitation index. Geocarto Int. 2013;28(3):192-209. DOI
- Dutta D, Kundu A, Patel N, Saha S, Siddiqui A. Assessment of agricultural drought in Rajasthan (India) using remote sensing derived Vegetation Condition Index (VCI) and Standardized Precipitation Index (SPI). Egypt. J. Remote Sens. Space Sci. 2015;18(1):53-63. DOI
- Naresh Kumar M, Murthy CS, Sesha Sai MVR, Roy PS. On the use of Standardized Precipitation Index (SPI) for drought intensity assessment. Meteorol. Appl. 2009;16(3):381-9. DOI
- Patel NR, Chopra P, Dadhwal VK. Analyzing spatial patterns of meteorological drought using standardized precipitation index. Meteorol. Appl. 2007;14(4):329-36. DOI
- Bhuiyan C, Singh R, Kogan F. Monitoring drought dynamics in the Aravalli region (India) using different indices based on ground and remote sensing data. Int. J. Appl. Earth Obs. Geoinf. 2006;8(4):289-302. DOI
- Wang F, Wang Z, Yang H, Zhao Y, Li Z, Wu J. Capability of remotely sensed drought indices for representing the spatio–temporal variations of the meteorological droughts in the Yellow River Basin. Remote Sensing. 2018;10(11):1834. DOI
- Pablos M, Martínez-Fernández J, Sánchez N, González-Zamora Á. Temporal and Spatial Comparison of Agricultural Drought Indices from Moderate Resolution Satellite Soil Moisture Data over Northwest Spain. Remote Sens. 2017;9(11):1168. DOI
- Mishra AK, Singh VP. A review of drought concepts. J. Hydrol. 2010;391(1-2):202-16. DOI
Cite this article:
Niknam A., Taherizadeh M., Khushemehr J.H., Nguyen-Huy T., Sarli R.. Assessing the concordance between meteorological and agricultural drought indices in arid and semi-arid regions. DYSONA-Applied Science. 2026;7(1):119-133. doi: 10.30493/das.2025.011311