Sandipan Ghosh¹*; Soumya Kundu 2
1, Department of Geography, Chandrapur College (The University of Burdwan), Purba Bardhaman, West Bengal, PIN- 713145, India
2, Department of Earth and Environmental Science, Indian Institute of Science Education and Research Bhopal (IISERB), Bhopal, Madhya Pradesh, PIN – 462066, India
E-mail:
sandipanghosh19@gmail.com
Received: 22/09/2024
Acceptance: 04/10/2024
Available Online: 04/10/2024
Published: 01/01/2025

Manuscript link
http://dx.doi.org/10.30493/DAS.2024.479536
Abstract
The analysis of fluvial system anomalies is crucial for understanding the topographic evolution of the Darjeeling Sikkim Himalaya (DSH) orogen, due to the propensity of bedrock river networks to gradually shape mountain surfaces and retain evidence of landscape changes. In this study, the quantitative dimension of tectonic geomorphology has been applied utilizing the MATLAB-based Topo Toolbox 2. Chi plot, knickpoint finder, stream power incision model, stream-length gradient index, and hypsometric integral functions of Topo Toolbox 2 were used. Results revealed that geomorphic markers and fluvial anomalies provide distinct insights into the active tectonic regime, influencing (1) deviations in equilibrium channel form, (2) the sensitivity of equilibrium channel gradient to uplift rate, and (3) equilibrium fluvial relief in active collision zones. Potential areas of significant tectonic stress on stream profiles and prospective epicentres of major earthquakes are delineated as three distinct windows of the DSH: (1) the Rangit Window encompassing Jorethang and the Darjeeling Klippe in the southwest; (2) the eastern and northeastern regions of Kalimpong and the Tista Half Window; and (3) the eastern section of Gangtok and the Nathang Valley. This study additionally identified the potential zone of Holocene deformation in the piedmont fans surrounding the Matiali, Chalsa, Nagrakata, and Taljhora faults, including fault scarps, deformed sedimentary layers, triangular facets, and elevated terraces. The tectonically active DSH landscapes face a seismic risk of a significant earthquake, with a magnitude greater than 8.0, occurring after a seismic interval exceeding 200 years.
Keywords: Normalised channel steepness index, Hypsometric integral, Chi Plot, Soft sediment deformation structure, Darjeeling Sikkim Himalaya
Introduction
The Main Central Thrust (MCT), Main Boundary Thrust (MBT), and Main Frontal Thrust (MFT), along with various active transcurrent (strike-slip) faults oriented perpendicularly to the predominant compressional zone, serve as major active tectonic elements of the Darjeeling Sikkim Himalaya (DSH). These features arise from an active continent-continent plate collision zone, instigated by the persistent northward movement of the Indian plate at approximately 20±0.3 mm/year. Researchers [1-4] uncovered substantial evidence for active tectonics, including disordered neotectonic thrusts situated between the MBT and South Kalijhora Thrust (SKT), as well as the Lesser Himalayan Duplex (LHD), which encompasses the Tista Half Window (THW) and Rangit Window (RW), recognized as the favored site for recent earthquake epicenters. A minimum convergence of 12 mm/year was observed in the Darjeeling – Sikkim – Tibet (DaSiT) wedge, with 4 mm/year of this convergence accounted for in the LHD [5]. This signifies that active tectonics and seismic activity are concentrated in the LHD. Recent research indicates that the geodetically inferred moment deficit rate (15.1 ± 1.1 x 10¹⁹ Nm/year; currently 72 percent moment deficit rate) suggests the MFT is susceptible to rupture (above 8 m) in Mw >8.2 – 8.7 earthquakes approximately every 200 years, while the DSH is at risk of an earthquake of significant magnitude, Mw >8.0 [6-12]. The importance of transverse tectonics along the Tista lineament is underscored by the strike-slip characteristics of the 2011 Sikkim earthquake (Mw 6.9), which produced 292 aftershocks from September 22 to November 23, 2011 [2][13]
In active orogens, the channel network regulates the rate at which landscapes respond to alterations in base level, such as tectonic, eustatic, drainage reorganization, or climate change, by generating geomorphic signals. The velocity of these signals within the channel network is dictated by the mechanisms of river incision into bedrock, alongside the magnitude and orientation of the perturbation [14-16]. Comprehending the transient response of bedrock rivers to diverse perturbations is an essential geomorphic instrument for delineating historical rock uplift rates, climatic variations, or topographical alterations in river networks derived from disequilibrium landscape configurations [17][18]. The characteristics, geometry, and recent activity of faults frequently affect transient basins (e.g., deviations from a steady-state river profile due to relative base level changes, formation of knickpoints) by determining the variable rate of long-term incision [19][20]. Tectono-climatic disturbances over a span of 103–105 years frequently dictate the development of landscapes, topographic irregularities, and alterations in river gradients. Utilizing sophisticated geospatial instruments and modeling the longitudinal profiles of a river channel enables the effective analysis of transient signals associated with these changes [21][22]. The geomorphic indices and the stream power incision model (SPIM) serve as crucial reconnaissance tools for identifying areas of DSH affected by active tectonics, facilitating the analysis of landform reactions to active deformation processes.
Prior research conducted by [23-25] has examined the geomorphic characteristics of DSH tectonic elements. Nevertheless, additional inputs of advanced analytical GIS functions, incorporating Object-Oriented Programming, are necessary to quantify landform stability and ascertain the tectonic regime of the DSH. Earth scientists estimate that the area under investigation, primarily composed of piedmont fans and LHD, is situated in the central-southern section of DSH. It is drained by the complex networks of the Tista and Jaldhaka river systems. The upstream migration of knickpoints and the variable river gradient or channel steepness index are believed to stem from the ongoing tectonic disturbances of the DSH, which expedite the rate of river incision upstream to maintain equilibrium. The objective of this study is to understand the lateral extent of tectonic features utilizing the SPIM, normalised channel steepness index (Ksn), and Chi methodologies (employing MATLAB Topo Toolbox 2 algorithms) within a tectonically active landscape and a region susceptible to significant earthquakes. Furthermore, it proposes the dynamics of drainage basin instability through the geomorphic indices of active tectonics (GIAT). This study seeks to investigate whether the geomorphic features of the transient fluvial response to active tectonics can be employed to predict the tectonic stress zone or seismic hazard zone in the DSH.
Research Location and Methodology
Darjeeling Sikkim Himalaya: geologic and tectonic setting
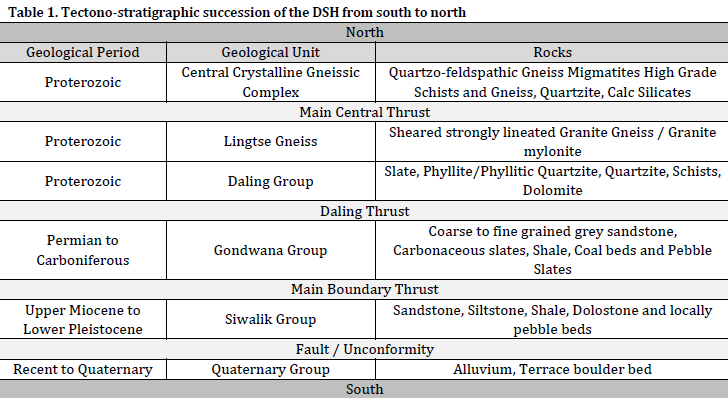
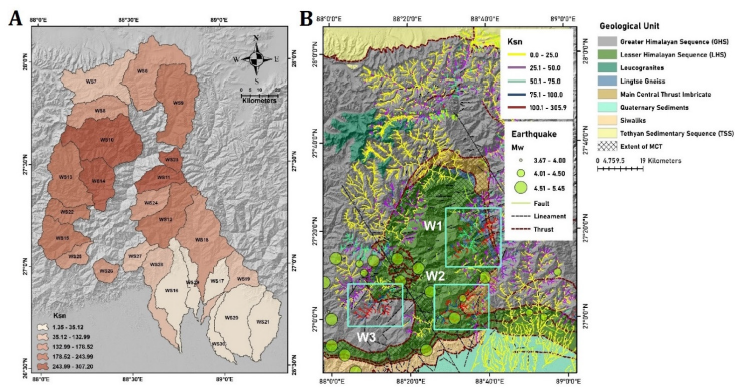
The Darjeeling-Sikkim Himalaya (DSH) is situated in an area where the Himalayan deformation front and the Indian and Eurasian plate convergence vector are almost perpendicular. The DSH (Fig. 1) is primarily covered by high grade gneisses and metasediments of the Darjeeling Group (Kanchenjunga Gneiss, Darjeeling Gneiss, Chungthang Formation), along with a band of deformed granite gneiss. Proterozoic metapelites and metavolcanics of the Daling Group (Gorubathan, Reyong, and Buxa Formations) make up the majority of the DSH [26]. The Phanerozoic rocks found in the DSH (table 1) comprise the Neogene sediments of the Siwalik Group, the Everest Pelites, Lachi and Chho Lhamo Formations, the Tethyan series, and the Rishi Group / Gondwana-equivalent (Rangit Pebble-slate and Namchi Formation) [26]. In the DSH foothills, the Siwalik Group of rocks is exposed. The MCT is a zone of thrust planes where the Lesser Himalayan metamorphites of the Daling Group have been overcome by the Higher Himalayan crystalline gneisses of the Darjeeling Group. Between the Neogene Siwalik Group of sediments to the south and the piled pile of thrust sheets that make up the Lesser Himalayan Pre-Tertiary rocks to the north, the MBT surfaces along the foothills are clearly visible.
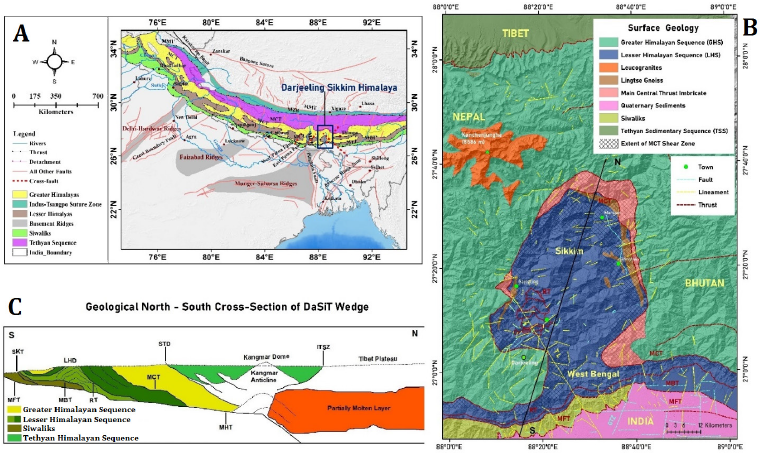
The Dharan-Gorubathan salient recess pair, which has noticeable significant thrusts and strike-slip faults, is where the DSH is situated [2]. The fault systems that comprise the DSH’s first order orogenic structures include the Main Boundary Thrust (MBT), the Main Frontal Thrust (MFT), the Ramgarh Thrust (RT), the Main Central Thrust (MCT), and the South Tibetan Detachment Fault (STDF) [25]. The Gish Transverse Zone (GTZ), which is extending at a pace of 10.9 ±1.6 mm/year, is a transverse structure that exists along the Gish River valley in the frontal zone of DSH, according to [27] The way the MCT curves and meanders through DSH, revealing multiple folded and layered thrust sheets, suggests that the crust in DSH is more prone to folding than in other parts of the Himalayas. The Greater Himalayan Sequence (GHS)’s granulite and amphibolite facies are exposed by the MCT, which is made up of a shear zone that includes MCT-1 and MCT-2 [25]. A system of imbricate (overlapping) thrusts that split off from a single fault below and merge with a thrust fault above is known as the Rangit Duplex (RD), and it is exposed in the Rangit Window (RW) of the DSH as a duplex structure known as LHD [25].The sub-critical nature of the duplex, which disturbs equilibrium and resumes internal deformation, implies taper construction by internal deformation (slip along basal décollement), and the LHD area exhibits considerable taper loss [3].
According to [26], the DSH has two different drainage patterns: the rectangular drainage in the centre and eastern regions, which reflects a strong control of structure on drainage, and the sub-dendritic drainage in the western half, where rock units have a reasonably homogeneous lithology. Rangit is the most significant and longest of the Tista’s glacier-fed tributaries, though the others include Lachen, Lachung, Lhonak, Ratey chu, Roro chu, and others. In addition, several piedmont fans are formed by the passage of the Himalayan rivers Lish, Gish, Chel, Murti, Neora, and Jaldhaka.
Methodology
There are two techniques to investigate the consequences of active tectonics: (1) interpreting the nature and position of anomalous landforms to infer active tectonics, and (2) employing a forward approach that assesses the impact of established tectonic activity on landforms.
Dataset preparation
The main dataset of tectonic geomorphology is based on the ALOS (Advanced Land Observing Satellites) World 3D 30 m (AW3D30) DEM (digital elevation model) which was collected from the website of Earth Observation Research Center, Japan Aerospace Exploration Agency (From Link). It was previously reported that AW3D30 has a remarkably high RMSE (Root Mean Square Error) of 1.78 m (one σ) [28]. The methods of dataset preparation were implemented here from the research works of [22][29].
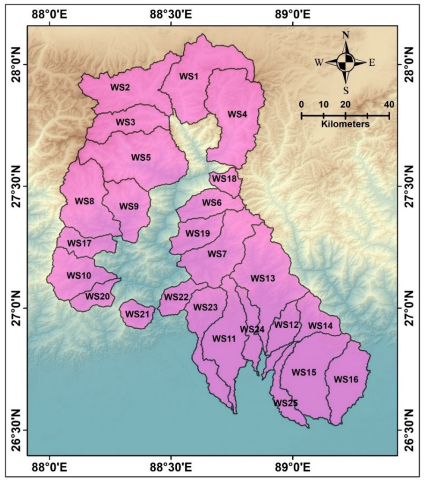
The MATLAB-based Topo Toolbox version 2.0 (From Link) was used to apply an object-oriented programming (OOP) approach to work with gridded DEM and derived data such as flow directions, stream networks and various topographic modelling (selecting twenty-five river basins; WS1 to WS25) (Fig. 2). The relationship between a drainage basin’s geomorphological features and hydraulic parameters is demonstrated by morphometric analysis, a scientific study of the dimensions and form of the earth’s surface. In this study before extracting the twenty-five river basins, a flow grid was generated which allowed removal of the ditches, pits and artifacts from the AW3D30 DEM which was further converted into Geo-tiff image in the WGS-84 datum system. Then, TopoToolbox 2 performs fundamental river analysis using three main object classes: (1) GRIDobj (a class to store and analyse gridded data), (2) FLOWobj (a class for flow-path networks); and (3) STREAMobj (the channelized fraction of the flow-path network). It is worth noting that the database of tectonic settings and geological / seismotectonic maps were collected from the Geological Survey of India (From Link) and the research works of [1][3][4]. In Supplementary Table 1, a concise morphometric database is presented, and it is used in quantitative description and analysis of landforms.
Normalised steepness index
In a bedrock channel, the stream power incision model (SPIM) can be viewed as follows [21][30][31]:
E = KAm Sn (1)
where E is the form of the stream power erosion (m/year), S (dimensionless) is the stream slope and the m and n exponents are positive constants depending on the erosion processes, hydrological features of the stream, and channel geometry [21][30], and K [m(1–2m)/year] is the detachment-limited erosion coefficient linked to both climatic and lithological factors [32]. The time rate of change in the elevation of the river channel (dz/dt) is simply the difference between the rate of rock uplift (U) and the rate of incision,
dz/dt = U – E (2)
By substituting E value from the first equation, with slope (S) expressed as dz/dx,
dz/dt = U – KAm (dz/dx)n (3)
The general expression can be rearranged for the equilibrium case where dz/dt = 0, and, solved for slope:
S = (U/K)1/n ⋅A–m/n (4)
This equation has the same form as Hack’s law [33]:
S = Ks ⋅A–θ (5)
where Ks = (U/K)1/n is the channel steepness index, θ = m/n is the concavity index, U is the rock uplift/erosion (E) rate at a steady state, K is the erosional efficiency representing a suite of factors that govern the river erosion and m and n are positive constants, whose ratio for a typical basin is ~0.45. Small uncertainties in the θ can lead to wide variations in Ks; therefore, it is imperative for normalized steepness index (Ksn) with a reference concavity (θref) to correlate the catchments of various shapes and sizes [34][35]:
Chi plot analysis
The chi (χ) – provides an alternate integral approach where the horizontal coordinate (x) of the river profile can be transformed into the χ-coordinate with the given threshold drainage area for river profile analysis by integrating Eq. (3) after separating the variables and treating U and K as constants in space and time, following steady-state equation as Eq. (7):
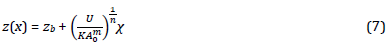
where zb is elevation at the drainage network’s base level at x = xb and A0 is an arbitrary reference area and the second part of the equation defines the chi(χ)-gradient and zb as the intercept [31][35]. The χ represents the integral function of location from base level ‘xb’ to the upstream location ‘x’ in the drainage network
Stream length-gradient index (SL)
The SL index is measured for a particular reach of a defined stretch of a river using the formula [22][36][37]:
SL = (ΔH/ ΔL) x L (9)
where, ΔH represents the difference of elevation between two ending points of the reach, ΔL is the length of the reach and L is the stream length of the channel from the uppermost point of the stretch to the midpoint of a reach under consideration.
Hypsometric integral (Hi)
Hypsometric integral (Hi) is equivalent to the ratio of area under the hypsometric curve to the area of the entire basin or it is simply defined as the area under the hypsometric curve. The integral for a given curve is simply calculated as follows [37]:
Hi = (Hmean – Hmin) / (Hmax + Hmin) (10)
where, Hmean is mean elevation of the basin, Hmax is maximum elevation of the basin and Hmin is minimum elevation of the basin. Topo Toolbox 2 has unique functions to prepare the spatial variation map of Hi and Hi plot covarying with the elevation and longitudinal river profile.
Knickpoint detection
‘Knickpoint finder’ [38], an effective geomorphic tool in the Topo Toolbox 2 (From Link), is applied here to identify the relief breakpoints along the drainage profiles (knickpoints), coded in Python for use on the ArcGIS platform. The relative slope-extension (RDE) index, which is the mainstay of this tool, was proposed [39] as a derivative of the Hack Index [36]. Additionally, the identification of vertical-step knickpoints and slope-break knickpoints [40] was done through analysis of slope -area plots in each basin.
Results
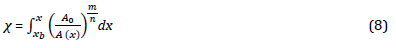
SL index analysis is shown in Fig. 3 to help visualize the relationship between anomalous SL index and tectonic deformation throughout the river’s lengthy profile. The presence of MBT and MCT faults is associated with elevated SL values, as demonstrated by the Dik Chu River, which can reach 11908 over the MCT. The high SL index range of 2422 to 6473 is reflected in the channel that crosses the MBT. The thrusts and faults in the River Relli Khola have an extraordinarily high range of SL, ranging from 112 to 2709 (abrupt presence of large spikes in the SL curve). The Rani Khola River exhibits a range of SL from 522 to 12098, making it a non-equilibrium river in the absence of a graded profile. Because of the existence of the Taljhora, Chalsa, MBT, MFT, and MCT faults, the piedmont river known as Jitti occasionally exhibits large spikes of SL through the profile, ranging from 98 and 827. Because of the Gish Transverse Fault (GTF), MCT, RT, and MBT, the long profile of the Gish River deviates significantly from a graded profile. The SL value has large peaks in the deformation zone and ranges from 73 to 4288. The theme map indicates that high values of SL (>1500) in the piedmont rivers, such as those in Neora, Murti, and Jaldhaka, are linked to the occurrence of MBT, MCT, and MFT.
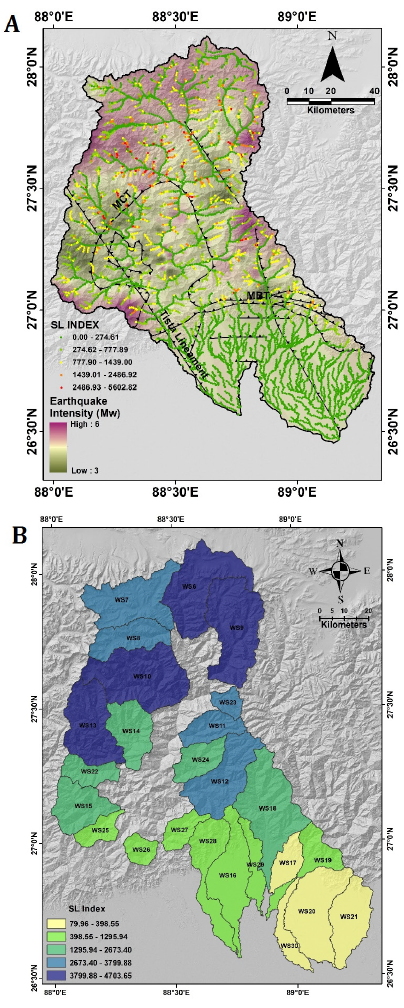
According to [41], the basins with hypsometric integral (Hi) values greater than 0.60 exhibit a tectonically active landscape and a young stage of landform evolution (Fig. 4). In the northern portion of the DSH, the river basins of Rangit, Lachen, Lachung, Dik chu, Zemu chu, and Rathong chu are traced by the composite hypsometry curve from a mature to a young stage. Using Hi and longitudinal river profiles (e.g., Lachung chu, Dik chu, Rani khola, Rangit, Neora, and Gish), Topo Toolbox 2 effectively produced a composite graphic to identify the tectonically active zone along the river basin. Compared to the rest of the profile, the bounded zone between thrusts (MCT and MBT) and faults has exceptionally high Hi (>0.5). Tectonic imprints on basin morphology are reflected in the abrupt hike along the Hi curve caused by the existence of thrusts or faults. For instance, in the Neora River, there is a continuous increase in Hi between the MF (Matiali Fault) and MCT, while in the Rangit River, there are two areas where significant Hi are found between RT and MCT. Overall, Hi values ranged between 0.07 to 0.72 on the DSH. A young stage of landform instability is developing in the streams of the Hi range 0.51–0.72 (red color), which is clearly influenced by tectonic factors on the river profile. The prime focus is placed on the foothills of DSH (densely populated region) where MCT, RT, MBT and MFT are very close to each other affecting the fluvial fans (tectonically active landscapes) where the streams show signature of high Hi within altitude range of 18 – 300 m.
As the concavity determining Ks, Ksn is calculated using a reference concavity, θref (-0.45) [34]. By contrast, 25 rivers of DSH exhibit multiple knickpoints and variation of fluvial morphology is quite evident in nature. Upstream of MCT 1 and MCT 2, mean Ksnequals 78 m 0.9 spanning a range from 25 to 305 m 0.9 in the tributaries of Tista (Fig. 5). Here, few examples are presented to display the existence of exceptional high Ksn in the channels of DSH. The upstream network of Neora River, crossing the MBT and MCT 1, shows sudden peak in Ksn, ranging in between 15.1 to 20.8 m 0.9, and the rest of reaches shows value under 10.1 m 0.9 only. An unusually high Ksn (60.1 to 98.8 m 0.9) is seen at MCT 1 and MCT 2 (the shear zone) in Dik Chu, a tributary of Tista, and a range of 40.1 to 60.0 m 0.9 is reported along the zone of faults and other lineaments. The MCT shear zone and many faults are responsible for the high Ksn range of 50.1 to 202.0 m 0.9 seen throughout the Rani Khola basin (WS 12). Diana, a piedmont river basin, has notable elevations of Ksn (100.1 to 257.0 m 0.9) where drainage networks intersect the MCT and MBT bifurcated thrust systems. The MCT, MBT, MFT, and GTF are the four main tectonic features that encircle the piedmont basin that contains the Gish River. The analysis expresses the activeness of MCT and MBT (compared to GTF and MFT), since high of Ksn values (ranging from 100.1 to 198.4 m 0.9) were recorded around the reaches of MCT and MBT.
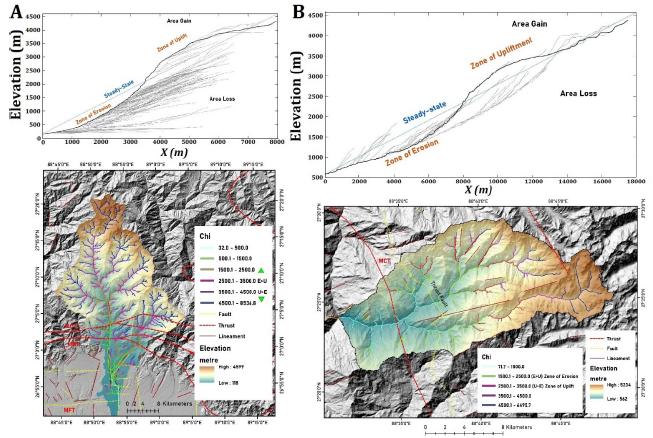
Topo Toolbox 2 extracted the profiles for main and tributaries of sample basins (Fig. 6) and created χ plots concerning the estimated range of m/n ratio (0.1 – 0.9). The best fit value of m/n ratio is chosen where the main stem collapses with tributary streams within the drainage basin. In a χ plot diagram the diagonal linear line signifies a river profile in a steady-state or equilibrium condition between erosion rate and uplift rate. The χ plots of main stem and tributaries (e.g., Tista, Jaldhaka, Rangit, Lish, Gish, Chel, Murti, Neora and Jaldhakha river basins) show diverging tendency from linearity and they have convexity (zone of uplift or uplift dominant over erosion) and concavity (zone of erosion or erosion dominant over uplift) in their longitudinal profile. This diverging nature of profiles can be the geomorphic markers or evidence of active tectonics in the DSH. Due to ongoing tectonic perturbation, lithological contrast, active fault zone, and seismic strain building, the longitudinal profiles of selected rivers are not in a state of equilibrium (transient nature). It is shown in the spatial plot that the selected river basins reflect high χ value above the MCT shear zone encountering with high uplift rate and the tectonically active regions have dominance of uplift over the fluvial incision rate at upstream section (migration of drainage divide and gain of basin area). Generally, χ value above 3500 gives signature of active tectonics over the fluvial networks at higher altitudes.
The Tista and Jaldhaka drainage networks show optimal Knick point zones (KPZ) coordination throughout MCT 1, MCT 2, and MBT (Fig. 7). It is observed that the sample sub-basin channels exhibit the presence of a maximum KPZ (50–100 m) throughout MCTs 1 and 2. In the channels of the Greater Himalayan Sequence and Tethyan Sedimentary Sequence (above 3500 m from msl), there is a high concentration of KPZ (30 to 200 m). However, in a few pockets of the southern DSH, primarily along the networks of Tista, Jaldhaka, Gish, and Rangit, the dynamic KPZ ranges between 50–100 m, 100–200 m, 200–300 m, and >300 m, respectively, exhibiting deformation caused by tectonic stress. In a sub-basin analysis, selected watersheds show the significant equivalence between tectonic lineaments or faults and KPZ.
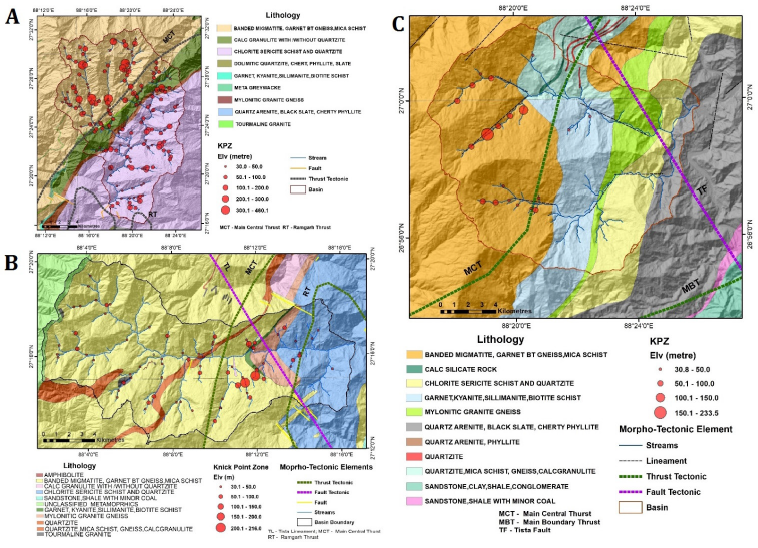
The concentration of KPZ clusters (mostly slope-break knickpoints) near the MCT and MBT, where the abrupt increase in Ksn (>30 m 0.9) is identified along the channels as well, as shown via MATLAB and ArcMap-based analysis of the Gish River network. KPZ is located along the MCT shear extent above 150 m, and this may be connected to continuous uplift that has momentarily occurred along the channels. Along the drainage network of the Neora River, the KPZ cluster of over 200 m range is detected above the MCT shear zone. These knickpoints emerge as transient waves that migrate towards the drainage split. The lithological unit of banded migmatite, garnet, gneiss, and mica schist are linked to the localities of KPZ in the Rangit river basin and Rangit Window (RW), which is situated north of the Darjeeling Klippe. A high concentration of (slope-break knickpoints) SBK is found between RT, MCT, and (Tista Fault) TF (near the eastern half of RW), with a maximum KPZ exceeding 150 m. Furthermore, a cluster of SBK is identified along the TF northwest of Jorethang. In and around RW, SBK and VSK (vertical step knickpoint) are both present, and these knickpoints are linked to the abrupt rise in Ksn (>60 m 0.9).
Discussion
High χ values were found in RW, Darjeeling Klippe, northern parts of MCT and STDF, and eastern part of Gangtok. These values indicate that tectonic forces are causing disequilibrium in the fluvial system in comparison to other DSH regions and that uplift (convexity) predominates over erosion, escalating divide migration and knickpoint development. Due to the dominance of bedrock erosion over uplift rate, the Tista Half Window (THW), piedmont zone of Tista (downstream of MBT), and the fluvial fans of DSH (namely, Rangamati Fan, Matiali-Chalsa Fan, and Jitti-Nagrakata Fan) have relatively low χ values, indicating temporary state (concavity). Finally, significant Ksn values (> 75.0 m 0.9) are in DSH, which can be interpreted as a geomorphic marker of a tectonically active landscape or as a high degree of variability in the resistance of bedrock to erosion across thrusts and faults. Three distinct windows of high Ksn (100.1–305.9 m 0.9) have been identified (Fig. 5) in order to identify potential zones of high tectonic stress on stream profiles (which may be the region of potential great earthquakes): (1) the east-west part of RW covering Jorethang and Darjelling Klippe (Rangit river system); (2) the eastern and north-eastern part of Kalimpong encompassing MCT and MBT (Relli river system); and (3) the eastern part of Gangtok and Nathang Valley encompassing MCT (Rani khola and Rangpo chu river system).
The Darjeeling Gneiss and Daling Group are situated between the tectonic planes of the Main Central Thrust (MCT), which run north-south and are designated as MCT 1 and MCT 2. Known as the South Kalijhora Thrust (SKT), the zone of MBT 1 and 2 (Main Boundary Thrust) is located near the Teesta Dam in Kalijhora. It is thought to be a zone of thrust imbrication in the Middle Siwalik sandstones, and several out-of-sequence faults are studied within it. As a result of the Tista River’s channel scouring and incision downstream of the Kalijhora dam, a number of strath terraces—benchtops created by river erosion in bedrock that can be covered in sediment carried by the river—and fault gouges (1.4 ± 0.3 ka to 20 ± 6.2 ka) are present. Higher channel slopes brought on by the tectonic uplift of DSH along the MBT may result in downcutting and the creation of strath terraces.
The Gish Transverse Fault (GTF), Matiali Fault (MF), Chalsa Fault (CF), Thaljhora Fault (TJF), Baradighi Fault (BDF), and Gorubathan Fault (GF) are the active Quaternary faults that cut the alluvial piedmont fans of southern DSH [24]. A total of ~11.1±1.5 mm/year of crustal deformation was detected across four E-W trending faults, namely Gorubathan, Matiali, Chalsa, and Baradighi, in the foreland basins of the Darjeeling Himalaya [42]. The Chalsa surface rupture, measuring approximately 14 meters, occured during an earthquake that happened between the years A.D. 1059 and 1266. MF, CF, and TF are the extensions of the MFT, with blind faults deforming the fan surfaces [43]. A seismic reverse slip of around 18 mm/year was estimated by [44] along the Himalayan Décollement, and the MFT near the Gorubathan recess was active between A.D. 1100 and 1255 [45]. According to [42], the Gish Transverse Zone (GTZ) is an extra active fault that is extending down the Gish River at a rate of 10.9±1.6 mm/year with right lateral strike slip on a transverse fault aligned roughly NNE-SSW. The potential dates of active fault scarps in the DSH foothills were noted by [23][24]. Scarp values are as follows: (1) Gorubathan: 33.8 ± 5.5 ka; (2) Taljhora: 37 ± 7 ka; (3) Nagrakata: 5.7 ± 2.5 ka; (4) Matiali: 33.8 ± 5.5 ka; (5) Chalsa: 22.3 ± 1.3 ka. Along with channel shifting at the Tista and Tum Thang khola confluence, the tectonic deformation of the river terraces (raised terraces) of Tista occurred between 45 and 11.9 ka [46].
An active fault scarp, oriented west to east, of 50–58 m high is observed near the tea gardens of Matiali and Juranti area, deforming the fan surface and developing recent terraces (Fig. 8). The Kurti River cutting the faulted scarp can be regarded as an antecedent river in the current context. A similar faulted scarp face (two staired morphologies) is observed at Chalsa along the railway lines. These faults can be considered a surface expression of MFT 1 and MFT 2 (Main Frontal Thrust). The development of triangular facets and a fault scarp (Fig. 8 C) are encountered at the left bank of Jhaldhaka (Nagrakata and Jiti Tea Gardens). Almost 35–40 m high west-facing degraded scarp and perpendicular scarp developed on the Matiali Formation, which comprises sand-silt layers, unsorted pebbles, cobbles, and boulders in a sandy matrix with highly oxidized soil (brownish-red soil horizon).

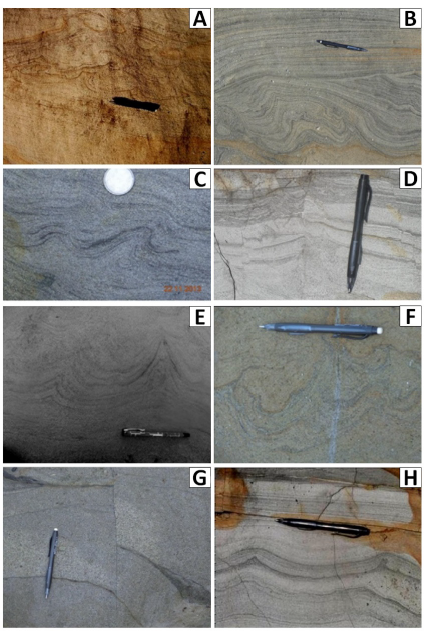
Siwalik rocks of Darjeeling sub-Himalaya preserved different types of soft sediment deformation structures (SSDS) such as load and flame structure (Fig. 9), ball and pillow (deformations resulted from physical shock that has been applied to unconsolidated sediment), convolute laminations (a type of SSDS that develops in quickly deposited fine-grained sands and silts), deformed cross beds, flame structure (a type of ductile deformation structure), syn-sedimentary folds and faults. SSDS (indicator of active tectonics) are a result of sediment deforming while it is still wet or liquid-like, shortly after deposition. Numerous things can lead to them, including sediment loading, liquefaction and fluidization, earthquakes, seismic shocks, and rapid sediment deposition. These structures are commonly found in heteroliths and fine-grained sandstone-shale interlayer of Middle Siwalik rocks (thick medium-to coarse-grained sandstone intercalated with thin siltstone, mudstone, frequent palaeosols and plant fossils). Another unique syn-sedimentary structure found in the sandstones of Middle Siwalik is the rupture and rotation of strata as a result of slumping. These above structures are the product of gravitational loading due to density difference, squeezing of water saturated mud as a result of dewatering, slumping of the strata or its rotation along unstable slope. These may be also developed due to the syn-sedimentary deformation triggered by earth quake shocks.
Conclusion
The influence of active tectonics on geomorphic features in the DSH’s river basins and fluvial fans were analysed in this work. The shifting river gradient and profile convexity are attributed to thrusts and faults, as demonstrated by the anomalies of Chi, SL, Hi, and Ksn. Several Quaternary fans and strath terraces have been deformed as a result of continuous tectonic movements, indicating that the proximal foreland of the Himalaya is tectonically active (mostly the area between MBT and MFT). The longitudinal profiles of the rivers deviate significantly from the steady-state condition and demonstrate the dominance of the uplift rate over the fluvial incision rate, which may result in the formation of linear valleys and gorges throughout the MFT, MBT and MCT. To evaluate the geomorphic signals from the rivers of DSH and the tectono-geomorphic danger connected to the Himalayan large earthquakes that transcend MW 8.0, field investigation of geomorphic markers, thematic mapping, and the geomorphic indices of active tectonics are crucial. Consequently, the current geomorphic investigation may shed some insight on the subject of tectonically active landscapes and the sensitivity to seismic hazards of this region. To uncover the tectonic geomorphology in the previously indicated zones of active deformation, more research at the micro-basin size is required.
Acknowledgment
The authors are thankful to the Science and Engineering Research Board (SERB), Government of India for the financial support under the Core Research Grant (CRG/2020/003104).
References
- Mukul M, Jaiswal M, Singhvi AK. Timing of recent out-of-sequence active deformation in the frontal Himalayan wedge: Insights from the Darjiling sub-Himalaya, India. Geology. 2007;35(11):999. DOI
- Mukul M, Jade S, Ansari K, Matin A. Seismotectonic implications of strike–slip earthquakes in the Darjiling–Sikkim Himalaya. Curr. Sci. 2014:198-210.
- Das D, Mallik J, Das S, Deb T, Das A, Bandyopadhyay K. Active thrust induced realignment of recent near-surface stresses in the Darjeeling-Sikkim Himalayas: Reasons and implications. J. Struct. Geol. 2021;145:104311. DOI
- Uthaman M, Singh A, Singh C, Dubey A, Kumar G. Discerning Structure and Seismic Hazards in the Sikkim Himalayas. Eos. 2021;102. DOI
- Mukul M. The geometry and kinematics of the Main Boundary Thrust and related neotectonics in the Darjiling Himalayan fold-and-thrust belt, West Bengal, India. J. Struct. Geol. 2000;22(9):1261–83. DOI
- Bilham R, Ambraseys N. Apparent Himalayan slip deficit from the summation of seismic moments for Himalayan earthquakes, 1500–2000. Curr. Sci. 2005:1658-63.
- Nath SK, Vyas M, Pal I, Sengupta P. A seismic hazard scenario in the Sikkim Himalaya from seismotectonics, spectral amplification, source parameterization, and spectral attenuation laws using strong motion seismometry. J. Geophys. Res.: Solid Earth. 2005;110(B1). DOI
- Stevens VL, Avouac JP. Millenary Mw > 9.0 earthquakes required by geodetic strain in the Himalaya. Geophys. Res. Lett. 2016;43(3):1118–23. DOI
- Bilham R. Himalayan earthquakes: a review of historical seismicity and early 21st century slip potential. Geological Society, London, Special Publications. 2019;483(1):423–82. DOI
- Sharma Y, Pasari S, Ching KE, Dikshit O, Kato T, Malik JN, Chang CP, Yen JY. Spatial distribution of earthquake potential along the Himalayan arc. Tectonophysics. 2020;791:228556. DOI
- Michel S, Jolivet R, Rollins C, Jara J, Dal Zilio L. Seismogenic Potential of the Main Himalayan Thrust Constrained by Coupling Segmentation and Earthquake Scaling. Geophys. Res. Lett. 2021;48(13). DOI
- Mukhopadhyay B. An estimation of probable seismic hazard in the active deformation front of the Himalayan arc. J. Earth Syst. Sci. 2021;130(1). DOI
- Kumar MR, Hazarika P, Prasad GS, Singh A, Saha S. Tectonic implications of the September 2011 Sikkim earthquake and its aftershocks. Curr. Sci. 2012:788-92.
- Whipple KX. The influence of climate on the tectonic evolution of mountain belts. Nat. Geosci. 2009;2(2):97–104. DOI
- Boulton SJ, Stokes M, Mather AE. Transient fluvial incision as an indicator of active faulting and Plio-Quaternary uplift of the Moroccan High Atlas. Tectonophysics. 2014;633:16–33. DOI
- Jiménez-Cantizano FA, Antón L. Stream regularization index. A morphometric approach to quantify the longitudinal profile regularization stage. Geomorphology. 2023;424:108580. DOI
- Gallen SF, Wegmann KW. River profile response to normal fault growth and linkage: an example from the Hellenic forearc of south-central Crete, Greece. Earth Surf. Dynam. 2017;5(1):161–86. DOI
- Beeson HW, McCoy SW. Geomorphic signatures of the transient fluvial response to tilting. Earth Surf. Dynam. 2020;8(1):123–59. DOI
- Padder AH, Nandy S, Kothyari GC, Jani C, Lakhote A, Kandregula RS, Joshi N, Taloor AK, Chauhan G, Thakkar MG. Geomorphometric Appraisal for Seismic Hazard Assessment in the Chenab River Basin of the NW Himalayas, India. Geotectonics. 2022;56(4):534–63. DOI
- Sinha S, Sinha R. Active tectonics, landscape evolution and sediment dynamics in Dehra Dun, Northwest Himalaya inferred from geomorphic indices and GIS tools. Quatern. Int. 2021;585:55–69. DOI
- Perron JT, Royden L. An integral approach to bedrock river profile analysis. Earth Surf. Process. Landforms. 2013;38(6):570-6. DOI
- Kothyari GC, Kotlia BS, Talukdar R, Pant CC, Joshi M. Evidences of neotectonic activity along Goriganga river, higher central Kumaun Himalaya, India. Geol. J. 2020;55(9):6123-46. DOI
- Guha D, Bardhan S, Basir SR, De AK, Sarkar A. Imprints of Himalayan thrust tectonics on the Quaternary piedmont sediments of the Neora–Jaldhaka Valley, Darjeeling–Sikkim Sub-Himalayas, India. J. Asian Earth Sci. 2007;30(3–4):464–73. DOI
- Chakrabarti Goswami C, Jana P, Weber JC. Evolution of landscape in a piedmont section of Eastern Himalayan foothills along India-Bhutan border: A tectono-geomorphic perspective. J. Mountain Sci. 2019;16(12):2828–43. DOI
- Badekar A, Dutta D. Assessment of Neotectonic Influence on Intermountain Terraces Developed in Tista River, Sikkim Darjeeling Himalaya. J. Geosc. Res. 2022;7(1):56-71.
- Basu SK. Geology of Sikkim state and Darjeeling district of West Bengal. Bangalore: Geological Society of India. 2013.
- Mukul MA, Matin AB. Tectonics of the Himalayan Mountain Front, Darjiling Himalayas, India. Annual Report of Centre of Mathematical Modelling and Computer Simulation, Bangalore. 2005:26.
- Bayık Ç, Becek K, Mekik Ç, Özendi M. On the Vertical Accuracy of the ALOS World 3D-30m Digital Elevation Model. 2017. DOI
- Schwanghart W, Kuhn NJ. TopoToolbox: A set of Matlab functions for topographic analysis. Environ. Model. Softw. 2010;25(6):770–81. DOI
- Whipple KX, Tucker GE. Dynamics of the stream‐power river incision model: Implications for height limits of mountain ranges, landscape response timescales, and research needs. J. Geophys. Res. Solid Earth. 1999;104(B8):17661–74. DOI
- Jaiswara NK, Kotluri SK, Pandey AK, Pandey P. Transient basin as indicator of tectonic expressions in bedrock landscape: Approach based on MATLAB geomorphic tool (Transient-profiler). Geomorphology. 2019;346:106853. DOI
- Snyder NP, Whipple KX, Tucker GE, Merritts DJ. Landscape response to tectonic forcing: Digital elevation model analysis of stream profiles in the Mendocino triple junction region, northern California. Geol. Soc. Am. Bull. 2000;112(8):1250-63. DOI
- Hack JT. Studies of longitudinal stream profiles in Virginia and Maryland. Geological Survey Professional Paper. 1957. DOI
- Wobus CW, Crosby BT, Whipple KX. Hanging valleys in fluvial systems: Controls on occurrence and implications for landscape evolution. J. Geophys. Res. Earth Surf. 2006;111(F2). DOI
- Jaiswara NK, Kotluri SK, Pandey P, Pandey AK. MATLAB functions for extracting hypsometry, stream-length gradient index, steepness index, chi gradient of channel and swath profiles from digital elevation model (DEM) and other spatial data for landscape characterisation. Appl. Comput. Geosci. 2020;7:100033. DOI
- Hack JT. Stream-profile analysis and stream-gradient index. J. Res. U.S. Geol. Surv. 1973;1(4):421-9.
- Keller EA, Pinter N. Active Tectonics, Earthquakes, Uplift and Landscape. Prentice Hall, New Jersey. 2002.
- Queiroz GL, Salamuni E, Nascimento ER. 2015. Knickpoint finder: A software tool that improves neotectonic analysis. Comput. Geosci. 2015;76:80–87.
- Etchebehere ML, Saad AR, Fulfaro VJ, Perinotto JA. Aplicação do Índice Relaçáo Declividade-Extensão-RDE Na Bacia do Rio do Peixe (SP) para Detecção de Deformações Neotectô nicas. Geologia USP: Série Científica. 2004:43-56. DOI
- Whipple KX, DiBiase RA, Crosby B, Johnson JPL. Bedrock Rivers. Treatise on Geomorphology. 2013:550–73. DOI
- Duan Y, Pei X, Zhang X. The Hypsometric Integral Based on Digital Elevation Model for the Area West of Lvliang Mountains in Loess Plateau, Shanxi, China. Front. Earth Sci. 2022;10. DOI
- Mullick M, Riguzzi F, Mukhopadhyay D. Estimates of motion and strain rates across active faults in the frontal part of eastern Himalayas in North Bengal from GPS measurements. Terra Nova. 2009;21(5):410–5. DOI
- Thakur VC. Active tectonics of Himalayan Frontal Fault system. Int. J. Earth Sci. 2013;102(7):1791–810. DOI
- Mukul M, Jade S, Ansari K, Matin A, Joshi V. Structural insights from geodetic Global Positioning System measurements in the Darjiling-Sikkim Himalaya. J. Struct. Geol. 2018;114:346–56. DOI
- Brice A, Jayangondaperumal R, Priyanka RS, Pandey A, Mishra RL, Singh I, Sati M, Kumar P, Dash SP. Paleoseismological evidence for segmentation of the Main Himalayan Thrust in the Darjeeling-Sikkim Himalaya. Sci. Rep. 2024;14(1):14537. DOI
- Singh AK, Pattanaik JK, Gagan, Jaiswal MK. Late Quaternary evolution of Tista River terraces in Darjeeling-Sikkim-Tibet wedge: Implications to climate and tectonics. Quat. Int. 2017;443:132–42. DOI
Cite this article:
Ghosh, S., Kundu, S. Fluvial anomaly as indicator of tectonically active landscapes: A study in the Darjeeling Sikkim Himalaya, India. DYSONA – Applied Science, 2025;6(1): 70-85. doi: 10.30493/das.2024.479536