
Lysimeter-validated gene expression programming models for evapotranspiration estimation in semi-arid Syria
Amer Q. Aldarwish 1,2; Ruba D. Alsaeed 3*; Boshra A. Khozam 2
1, Department of Water Resources Engineering and Management, Faculty of Civil Engineering, Homs University, Homs, Syria
2, Department of Water Engineering, Faculty of Civil Engineering, Al-Wataniya Private University, Hama, Syria
3, Department of Environmental Engineering, Faculty of Civil Engineering, Al-Wataniya Private University, Hama, Syria
E-mail:
ruba.alsaeed@wpu.edu.sy
Received: 11/02/2026
Acceptance: 13/08/2026
Available Online: 15/08/2026
Published: 01/01/2027

Manuscript link
http://doi.org/10.30493/DAS.2026.011508
Abstract
Accurate estimation of evapotranspiration is essential for irrigation scheduling and water-balance assessment, yet physically based methods often require complete meteorological inputs that are not consistently available in data-scarce regions. This study developed locally adapted, closed-form evapotranspiration equations using Gene Expression Programming (GEP) and evaluated their performance against lysimeter measurements in the central region of Syria. The dataset comprised 421 records from Al-Mukhtariyah (1996–2005) and Tizin (2004–2005) research stations, including daily maximum and minimum air temperature, relative humidity, wind speed, and sunshine duration, together with decadal (10-day) actual evapotranspiration measured by non-weighing drainage lysimeters. Three conventional equations (Blaney–Criddle, Ivanov, and Penman equations) were used as benchmarks, and three GEP models were generated in GeneXproTools V5 using combinations of the available climatic predictors. Results showed that all GEP models outperformed the conventional equations in both training and testing, with Model I providing the highest accuracy and the most stable statistics relative to lysimeter observations, including improved reproduction of peak and low evapotranspiration values. Sensitivity analysis for Model I indicated dominant contributions from mean temperature (45.5%) and sunshine duration (29.2%), followed by wind speed (13.0%) and relative humidity (12.3%). Overall, the proposed GEP equations offer accurate and interpretable alternatives for evapotranspiration estimation under limited or variable data availability, supporting practical irrigation management in arid and semi-arid settings.
Keywords: Evapotranspiration, Gene Expression Programming, Lysimeter, Arid regions
Introduction
Evapotranspiration (ET) is a coupled land–atmosphere process that integrates evaporation from soil and open-water surfaces and transpiration from vegetation, and it constitutes a major pathway of water and energy exchange within the hydrological cycle [1]. Accurate ET estimation is therefore central to irrigation scheduling, agricultural water productivity, watershed water-balance assessment, and long-term water resource planning [2]. However, ET is inherently controlled by interacting atmospheric drivers (air temperature, humidity deficit, wind regime, and radiative forcing) together with vegetation characteristics and the phenological stage of growing plants, rendering its robust quantification a persistent challenge across climates and scales [1][3]. Reference evapotranspiration is a standardized climatic index of evaporative demand from a defined, well-watered reference surface. A clear specification of the reference (grass or alfalfa) is essential for comparability and crop coefficient transfer.
Evapotranspiration can be quantified using direct and indirect approaches. Direct measurement methods (such as weighing lysimeters and micrometeorological techniques) are widely used for benchmarking ET models, since these methods provide near-observational estimates of water loss from soil–plant systems [1][4]. Lysimeters are often regarded as the most reliable instruments for field-scale ET measurement, particularly for establishing reference datasets for model development and validation. Nevertheless, their broader deployment is frequently constrained by installation complexity, high capital and maintenance costs, the need for continuous monitoring, and the required nontrivial corrections (Edge effects and representativeness issues), which collectively limit spatial coverage and operational feasibility [5][6]. These constraints are especially pronounced in data-scarce regions where water management decisions are most sensitive to ET uncertainty.
Evapotranspiration is strongly spatially heterogeneous due to land cover and soil moisture variability. Regional assessments, therefore often integrate station-based estimation with land surface modeling and satellite energy balance approaches such as SEBAL and METRIC [7]. Consequently, indirect (model-based) estimation remains the dominant practice in hydrology and irrigation engineering. The FAO-56 Penman–Monteith (FAO-56 PM) equation is widely recognized as the standard method for reference evapotranspiration (ETo) estimation, as it combines energy balance and aerodynamic terms and performs robustly across diverse climatic settings [8]. Despite its accuracy, FAO-56 PM typically requires a relatively complete suite of meteorological inputs (including radiation, humidity, wind speed, and temperature), which are not consistently available in many developing regions or in networks dominated by conventional stations with missing or low-quality observations [9][10]. Evidence from operational studies also shows that limited-data implementations can introduce systematic bias, motivating the search for parsimonious but reliable alternatives. Weather data integrity and the handling of missing variables are primary sources of bias in reference ET. Standard procedures formalize quality control and gap filling; however, evaluations show that limited data implementations can diverge systematically [11].
Alongside FAO-56 PM, a range of empirical and semi-empirical ET equations are commonly used when observations are incomplete, including the Hargreaves–Samani, Blaney–Criddle, Priestley–Taylor, Jensen–Haise, Irmak, and Turc formulations [1]. While these approaches reduce data requirements, they often embed assumptions (or climate-specific parameterizations) that may not transfer well under highly variable, extreme, or arid conditions. This issue is particularly observed when ET estimation is most consequential for irrigation and drought management. Therefore, a key methodological gap remains: achieving high accuracy comparable to FAO-56 PM while maintaining low input requirements and ensuring regional adaptability.
Observed wind speed trends and seasonal shifts in aerodynamic versus radiative control can materially alter evaporative demand. This helps explain systematic errors of temperature or radiation only methods under windy or advective conditions [12]. To address these limitations, artificial intelligence (AI) and machine learning methods have increasingly been adopted for ET modeling, as they can find nonlinear relationships between available predictors and ET targets without requiring a complete physical description of the process [13]. Artificial Neural Networks (ANN), for example, have demonstrated strong predictive capability across a range of climates [14] [15]. However, many AI models are criticized for functioning as “black boxes,” which can impede operational uptake and scientific interpretability, especially when users require transparent equations for integration into water-management workflows.
Within this context, Gene Expression Programming (GEP) provides an attractive compromise between physical–empirical equations and black-box predictors. GEP is an evolutionary symbolic regression technique that evolves explicit mathematical expressions (closed-form equations) linking inputs to ET, thereby enabling both predictive modeling and interpretability [16]. Studies have shown that GEP can reach accuracy levels competitive with advanced data-driven models while retaining equation-based transparency [17]. For instance, research demonstrated the effectiveness of GEP for daily ETo estimation in the Basque Country, highlighting its suitability for reference ET modeling under station-based meteorological inputs [18]. Subsequent work emphasized the issue of model transferability, showing that GEP performance may degrade when applied outside the calibration domain, thus requiring careful regionalization or recalibration strategies [19]. In arid environments, ANN and GEP models were compared, and the results showed that ANN can be marginally more accurate in some cases, but GEP retains a practical advantage by yielding explicit, user-ready equations [20]. Similarly, GEP performance was improved markedly when humidity or wind information is added to temperature-based inputs, reinforcing the importance of input selection under data limitation [21]. In the Sahel, researchers reported that GEP can generate regional-specific models that substitute empirical equations to a meaningful extent and that wind speed often provides major performance gains [22]. More recently, comparative studies and modern assessments continue to confirm the operational value of GEP in ETo estimation under limited or variable data availability across climate regimes [23][24].
Operational suitability cannot be assessed on the basis of correlation alone. A more robust evaluation demands complementary metrics. Bias, absolute and relative errors, and efficiency indices offer a fuller, more honest picture of performance. In this regard, GEP is attractive as it yields auditable explicit equations with interpretable structure [25]. Despite this progress, two issues remain central for operational ET modeling: (i) data availability scenarios (which combinations of climatic inputs produce acceptable accuracy?), and (ii) ground-truth validation against direct measurements rather than only against FAO-56 PM as a surrogate target. Addressing these issues is particularly important for arid and semi-arid regions, where ET dominates the water balance, and small estimation errors can translate into substantial irrigation misallocation.
Accordingly, the present study aims to estimate reference evapotranspiration in the central region of Syria using innovative empirical equations generated by GEP, alongside conventional equations (Turc, Epanov/Ivanov, Penman, and Blaney–Criddle). The models are evaluated against field measurements obtained by lysimeters to assess their applicability under the study-area conditions, using available climatic Datasets (air temperature, relative humidity, solar radiation, and wind speed) for model development and evaluation.
Materials and Methods
Study area and data
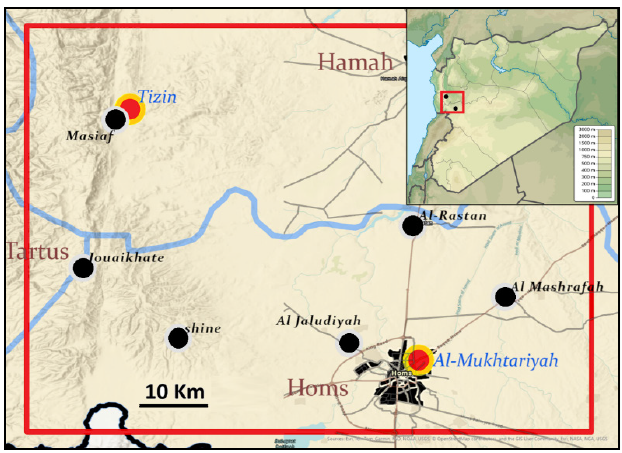
The study area is located in central Syria and includes two irrigation research stations affiliated with the Agricultural Research Center, namely Al-Mukhtariyah Station and Tizin Station. Al-Mukhtariyah Station lies approximately 2 km north of Homs City at an elevation of 487 m above mean sea level. On the other hand, Tizin Station is located roughly 15 km west of Hama City at an elevation of 474 m above mean sea level (Fig. 1). Soils at both sites are classified as heavy clay with moderate permeability, and the effective soil depth ranges from 0.75 to 2.0 m.
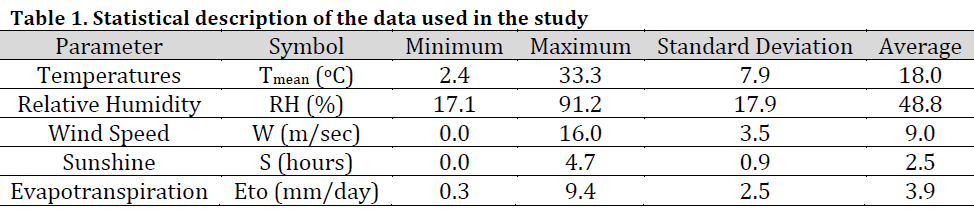
Daily meteorological observations were obtained from the stations, including maximum and minimum air temperature, wind speed, relative humidity, and daily sunshine duration. Additionally, actual evapotranspiration (ETo) was measured at a decadal (10-day) interval using non-weighing drainage lysimeters. The available records cover 1996–2005 for Al-Mukhtariyah Station and 2004–2005 for Tizin Station. Table 1 provides the statistical description of the meteorological data used in the study.
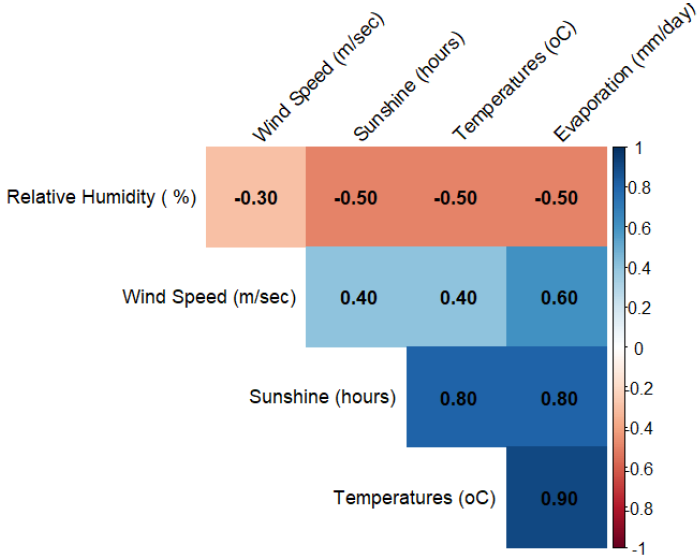
The analysis of correlation between the four climatic variables and evapotranspiration (Fig. 2) showed temperature showing the strongest positive association (R = 0.9), followed by sunshine hours and wind speed, whereas relative humidity exhibits an inverse relationship with evapotranspiration.
The central region in Syria is characterized by a Mediterranean climate, with cold, rainy winters and hot, dry summers. Rainfall is primarily concentrated between November and April. Mean annual precipitation differs between the stations, averaging approximately 475 mm at Al-Mukhtariyah and 338 mm at Tizin. Air temperature reaches its maximum during July and August, with mean summer values of 29.02 °C at Al-Mukhtariyah and 28.1 °C at Tizin, and declines markedly in January to 5.16 °C and 6.8 °C, respectively. Wind speed is generally higher in summer than in winter, ranging from 4.18–4.5 m/s during summer and 0.88–1.7 m/s during winter, and this seasonal variability directly influences the measured evapotranspiration.
Evapotranspiration measurement
Lysimetry is generally regarded as the most accurate and dependable option to determine reference evapotranspiration (ETo) since it provides measurements closely tied to the physical water balance of a defined soil–plant system [1]. However, lysimeter-based monitoring is capital-intensive and requires substantial operational effort over time, including instrumentation, maintenance, and continuous quality control, which limits its routine use to research settings [26][27]. For this reason, ETo is more frequently estimated indirectly using meteorological observations and empirical or physically based formulations [1].
Indirect methods differ substantially in both structure and data demand. Some approaches rely primarily on air temperature and daylength information, while others incorporate additional atmospheric controls such as wind speed, humidity, and solar radiation in order to represent both the energy available for vaporization and the aerodynamic transport of water vapor away from the evaporating surface [1][28]. In general, models driven by multiple climatic variables tend to provide more consistent performance as they capture a larger portion of the physical drivers governing evaporative demand. Nonetheless, the practical choice of method is often constrained by data availability. In many regions, long and continuous temperature series are available, whereas reliable records of wind speed, relative humidity, and radiation (or sunshine duration) are often incomplete, discontinuous, or absent, particularly for earlier decades and for stations with limited instrumentation [26][29].
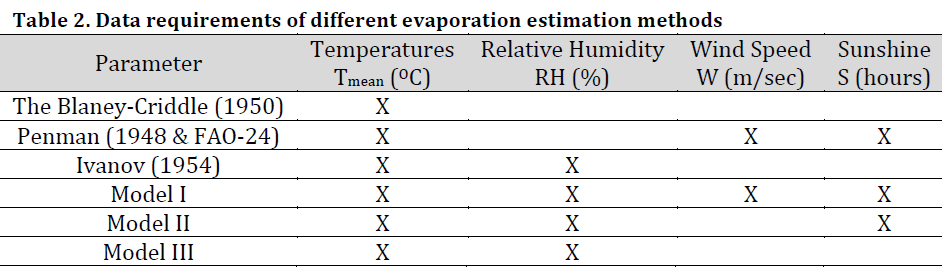
Accordingly, selecting an ETo estimation method requires balancing two considerations: the availability and quality of meteorological inputs, and the method’s ability to reproduce both the magnitude and temporal variability of evapotranspiration under the prevailing climatic conditions. Table 2 summarizes six indirect approaches spanning different input requirements. Three conventional formulations were used, namely Blaney–Criddle, Penman (FAO-24 framework), and Ivanov, which are widely applied in literature [28-32]. In addition, three GEP-based equations (GEP I, GEP II, and GEP III) were developed using the meteorological records from Al-Mukhtariyah and Tizin stations to provide locally adapted alternatives under different data-availability scenarios [1].
Direct evaporation estimation (Lysimetry)
In lysimetry, small-scale physical systems that closely reproduce field conditions are often used to obtain high-quality ET observations. Lysimeter-derived measurements provide dependable information for developing crop coefficients and improving irrigation management under different climatic conditions [33]. Compared with indirect estimation approaches, lysimetry offers a more direct representation of the ET process, although installation, operation, and maintenance can be costly [26]. In principle, the lysimeter quantifies actual evapotranspiration by isolating a defined soil monolith and resolving the associated water-balance components. In the present study, non-weighing drainage lysimeters were employed [33], which have been reported as effective for estimating water requirements in arid and semi-arid environments [34]. This approach is particularly suitable for settings with deep groundwater where the soil profile remains unsaturated during the measurement period, thereby producing estimates that closely reflect natural field behavior. Consequently, lysimeters are commonly used for irrigation planning and management over extended periods, for example weekly or monthly, consistent with internationally recognized procedures [35].
The lysimeter system installed at the Agricultural Research Center stations (Tizin and Al-Mukhtariyah) consists of a robust steel tank with dimensions of 1 m × 1 m and a total depth of 1.25 m, with an effective soil depth of 1 m. The base of the lysimeter was engineered with successive filtration layers of coarse sand, gravel, and aggregate, terminating in a drainage chamber to facilitate the collection of percolating water and prevent its accumulation within the root zone (Fig. 3). To enhance durability and avoid anaerobic conditions, a steel outlet pipe was installed to connect the lysimeter base to an underground collection chamber equipped with a control valve. The pipe was protected with fine sand and gravel layers to reduce clogging by fine particles. The soil profile was then reconstructed in the tank following the natural stratigraphic sequence to preserve the hydraulic characteristics of each horizon.
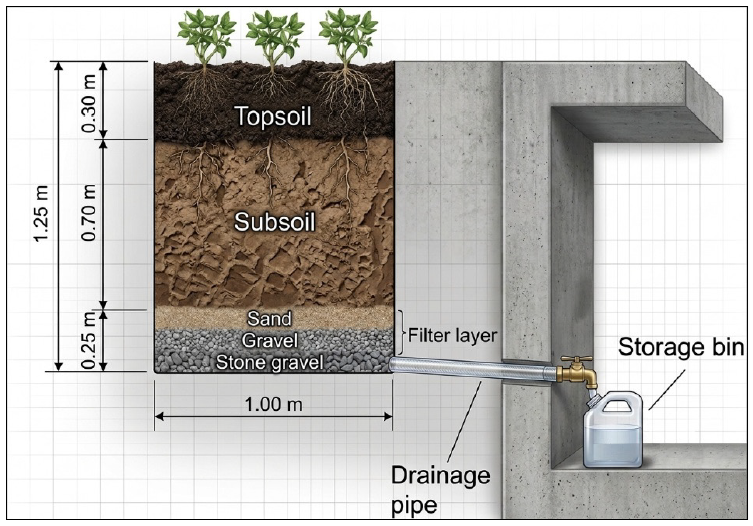
Actual evapotranspiration in this system was determined using the water-balance principle [37], while maintaining soil moisture close to field capacity to prevent crop water stress. Measurements were conducted at ten-day intervals to account for the slow water movement typical of heavy clay soils, which are characterized by high water retention and limited drainage. Variations in soil water content were monitored at multiple depths down to 1 m using a neutron moisture meter [38], through vertically installed access tubes. Soil moisture in the surface layer (0–15 cm), which is strongly influenced by physical evaporation, was determined by auger sampling followed by oven-drying. At the end of each measurement cycle, drainage water was collected in graduated cylinders through the gravity-driven free-drainage system, enabling a complete accounting of the water-balance components and a rigorous estimation of actual water consumption consistent with hydrological modeling practice.
Indirect evaporation estimation methods
The Blaney–Criddle method is a simple empirical approach widely used to estimate reference evapotranspiration (ETo) from mean daily air temperature and the monthly percentage of annual daytime hours [30]. The method is expressed as follows:

Where EToB-C is the estimated reference evapotranspiration using the Blaney–Criddle equation (mm/day), P is the average daily percentage of annual daytime hours [39], and Tmean is the mean daily air temperature (°C), computed as:
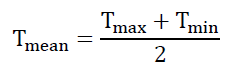
This method is characterized by operational simplicity and modest meteorological data requirements, which supports its use in data-limited regions. However, its performance is strongly climate-dependent since it excludes key drivers such as relative humidity, wind speed, and solar radiation. As a result, local calibration is commonly required to improve accuracy [40]. Recent studies have also shown that Blaney–Criddle estimates can be substantially improved when calibrated against the Penman–Monteith reference method, particularly under continental climatic conditions [41].
Based on the aerodynamic and energy balance framework [28][31] a modified formulation was developed to improve the estimation of potential evapotranspiration (ETp) across diverse climatic conditions, especially in arid environments where the original Penman equation may underestimate evaporative losses. Although many recent studies have adopted more advanced formulations such as the FAO-56 Penman–Monteith method [1], the FAO-24 approach remains valuable for historical analyses and certain regional applications [42]. The method is mathematically expressed as follows:

where ETp is potential evapotranspiration (mm/day), (c) is an adjustment factor (dimensionless) that compensates for day and night weather conditions not fully represented by the standard formulation and is commonly close to 1.0 under moderate conditions, but may increase to approximately 1.15–1.20 under windy and arid conditions. w is a temperature-related weighting factor representing the relative contribution of radiation, Rn is net radiation at the surface expressed as equivalent evaporation (mm/day), f(u) is a wind function describing the effect of wind on vapor transport, and (ea-ed) is the vapor pressure deficit (mbar), defined as the difference between saturation vapor pressure (ea) and actual vapor pressure (ed). In the FAO-24 procedure, the wind function is commonly computed as:
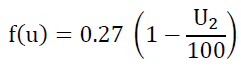
where (U2) is the total wind run (Km/day) measured at 2 m height.
The Ivanov method estimates potential evapotranspiration based on atmospheric evaporative demand using only two meteorological variables, air temperature and relative humidity. Originally developed as a monthly formulation, the method has been widely applied and evaluated across diverse climatic regions [32]. The equation is expressed as:

where ETp is daily potential evapotranspiration (mm/day), (T) is mean daily air temperature (°C), and (RH) is mean daily relative humidity (%). The structure of the equation provides a simplified representation of atmospheric moisture demand, where the term (100-RH) serves as a proxy for the vapor pressure deficit component. Accordingly, decreasing relative humidity increases (100-RH), reflecting a greater capacity of the air to absorb water vapor and, consequently, higher evaporation and evapotranspiration rates.
Gene Expression Programming (GEP)
This study applied Gene Expression Programming (GEP) as a symbolic regression framework to generate explicit, closed-form equations for estimating evaporation and reference evapotranspiration from the available climatic variables. In GEP, candidate solutions are encoded as fixed-length linear chromosomes (genotype) that are subsequently expressed as nonlinear expression trees (phenotype), allowing the final model to be written directly as an analytical equation suitable for operational use [16][24][43]. This method was preferred over purely black-box approaches because it preserves predictive flexibility while producing interpretable expressions that can be implemented in routine hydrological and irrigation calculations [44].
Model construction followed the standard multi-genic GEP structure, where each gene represents a sub-expression and the sub-trees are combined through a linking function (e.g; addition or multiplication) to form the final equation. Each gene is organized into a head and tail, with tail length computed as t=h (n−1)+1t, where h is head length and n is the maximum function arity, ensuring that chromosomes always decode into syntactically valid expression trees. The separation between genotype and phenotype is a defining feature of GEP and contributes to its efficiency and stability relative to other evolutionary schemes [16][24].
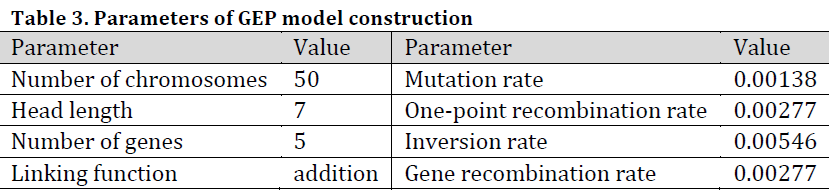
Training was performed by defining an appropriate fitness function, generating an initial random population, and iteratively evolving it using genetic operators until convergence or a stopping criterion was reached. Following Ferreira’s formulation, variation is introduced through operators such as mutation, transposition (including root and gene transposition), and recombination/crossover (one-point, two-point, and gene recombination), which act on the linear genotype while selection is based on the expressed phenotype [16]. In line with recent hydrometeorological applications, model selection and tuning were guided by performance indices, and alternative chromosome architectures and parameter settings were tested to identify a configuration suited to the climatic context [24]. Hyperparameter choices can be initialized from published configurations (e.g; population size, head length, number of generations, linking function, and operator rates) and then refined locally, with the linking function selected on the basis of predictive performance.
To support transparency and reproducibility, the workflow included statistical characterization of the dataset, independent testing, and explicit reporting of the final expression tree and derived equation [44]. After training, the optimal GEP model was exported as an analytical expression and, where appropriate, simplified without degrading accuracy; a basic physical plausibility check and optional contribution analysis of genes/sub-expressions were also considered to strengthen interpretability and ensure stable behavior under extreme input conditions.
Performance criteria
Reference and model-estimated evapotranspiration values were evaluated using four statistical performance measures: the Pearson correlation coefficient (R), Nash–Sutcliffe efficiency (NSE), root mean square error (RMSE), and mean absolute error (MAE) [45].
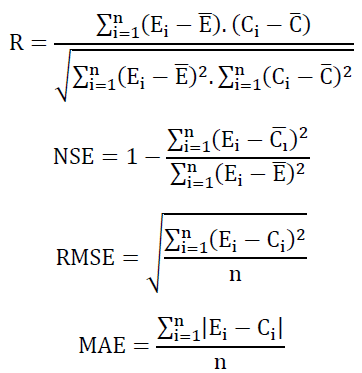
Where Ei is value of ETo measured by the Lysimeter, Ci is corresponding ETo value estimated by the models, n is number of observations,Ē is average of the measured values, C̄ is average of the estimated values.
The Pearson correlation coefficient (R) quantifies the strength of the linear relationship between the estimated and calculated values, with values approaching 1.0 indicating a strong correlation. The root mean square error (RMSE) measures the magnitude of the error in the same units as the variable, where lower values indicate better agreement. The mean absolute error (MAE) represents the average of the absolute differences between estimated and calculated values, with smaller values reflecting improved model performance. In addition, the Nash–Sutcliffe efficiency (NSE) is used to evaluate the predictive power of the model by comparing the residual variance to the variance of the observed data, where values close to 1 indicate high model efficiency, while values below zero suggest that the observed mean provides a better estimate than the model.
Results and Discussion
The dataset consisted of 421 observations collected from the Agricultural Research Centers at Al-Mukhtariyah and Tizin. The complete record was randomly divided into two independent subsets, with 70% of the observations (n=323) used for model training and the remaining 30% (n=98) reserved for testing. Each subset included data from both stations so that both sites contributed to model calibration and to out-of-sample performance assessment.
Reference evapotranspiration (ETo) was additionally computed using three conventional formulations, namely the Blaney–Criddle, Penman, and Ivanov equations [28][30-32].to provide benchmark comparisons against the proposed data-driven models. In parallel, three GEP-based models were developed in GeneXproTools V5, consistent with the genotype–phenotype paradigm of Gene Expression Programming, in which fixed-length chromosomes are evolved and subsequently expressed as executable expression trees [16].
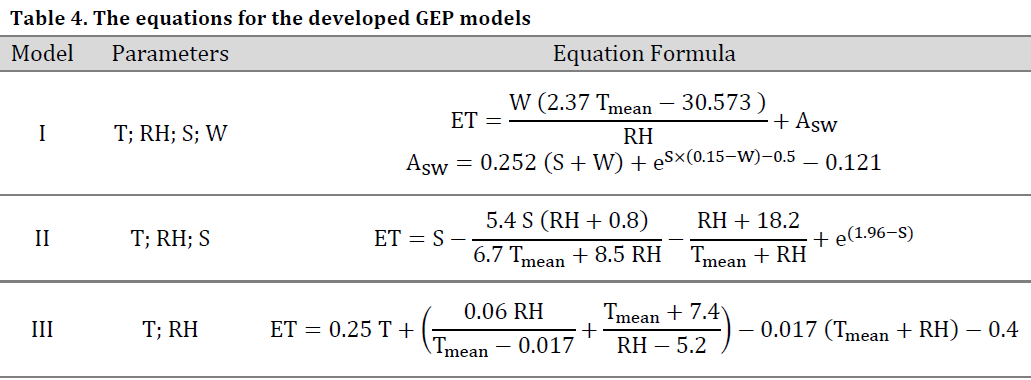
Model development was carried out in two main stages. In the first stage, the input (predictor) set was selected to reflect the climatic variables most closely linked to ET at the study sites, namely mean air temperature (Tmean), sunshine duration (S), relative humidity (RH), and wind speed (W). The function set provided to the GEP algorithm included basic arithmetic operators and selected nonlinear transformations (+, −, ×, ÷, x², ex) enabling the evolutionary search to construct candidate expressions that combine linear and nonlinear terms. In the second stage, RMSE was utilized as the fitness function, and the key structural and evolutionary settings were specified, including chromosome architecture, the suite of genetic operators, and the linking function used to integrate genes within each chromosome into the final expression (Table 3). Table 4 presents the GEP equations for the three proposed models, based on the parameters available at both stations that have a direct or inverse effect on evapotranspiration (ET) values.
Model performance in estimating evapotranspiration (ET) was assessed using a set of standard statistical indicators, including the correlation coefficient (R), Nash–Sutcliffe efficiency (NSE), root mean square error (RMSE), and mean absolute error (MAE) (Table 5). The results show that the three proposed models (Model I, Model II, and Model III) consistently outperform the conventional equations (Blaney–Criddle, Ivanov, and Penman) during both the training and testing phases, although the magnitude of improvement varies among the three models.
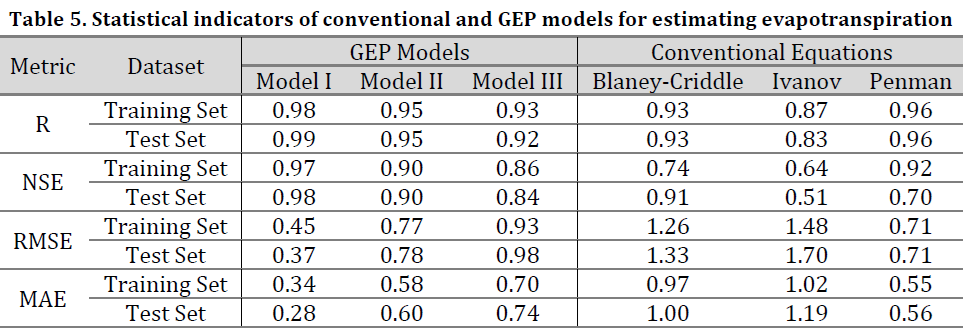
Model I exhibited the highest performance, with R values of 0.98 during training and 0.99 in testing, NSE of 0.97 and 0.98, the lowest RMSE of 0.45 mm/day in training and 0.37 mm/day in testing, and the lowest MAE of 0.34 and 0.28 mm/day, respectively. Model II ranked second, showing good performance with R of 0.95 in both training and testing, NSE of 0.90, and RMSE and MAE of approximately 0.77 and 0.58 mm/day, respectively. Model III delivered acceptable results with R values of 0.93 and 0.92, NSE of 0.86 and 0.84, and RMSE and MAE ranging from 0.93–0.98 and 0.70–0.74 mm/day in training and testing datasets, respectively.
Among the conventional equations, Penman method performed best, with R of 0.96 in both training and testing, NSE of 0.92 during training but dropping to 0.70 in testing, and RMSE of 0.71 mm/day. Blaney‑Criddle method ranked mid-level with R of 0.93, NSE of 0.74 and 0.91, and RMSE of 1.26 and 1.33 mm/day. Ivanov method showed the lowest performance, particularly in the testing phase (NSE 0.51, RMSE 1.70 mm/day, MAE 1.19 mm/day). These findings indicate that the proposed GEP models (particularly Model I) provide superior performance relative to the conventional equations in both accuracy and overall capability to estimate evapotranspiration. This improvement is likely related to their ability to capture complex nonlinear relationships among the climatic drivers while maintaining consistent performance across the training and testing datasets, which suggests good generalization.
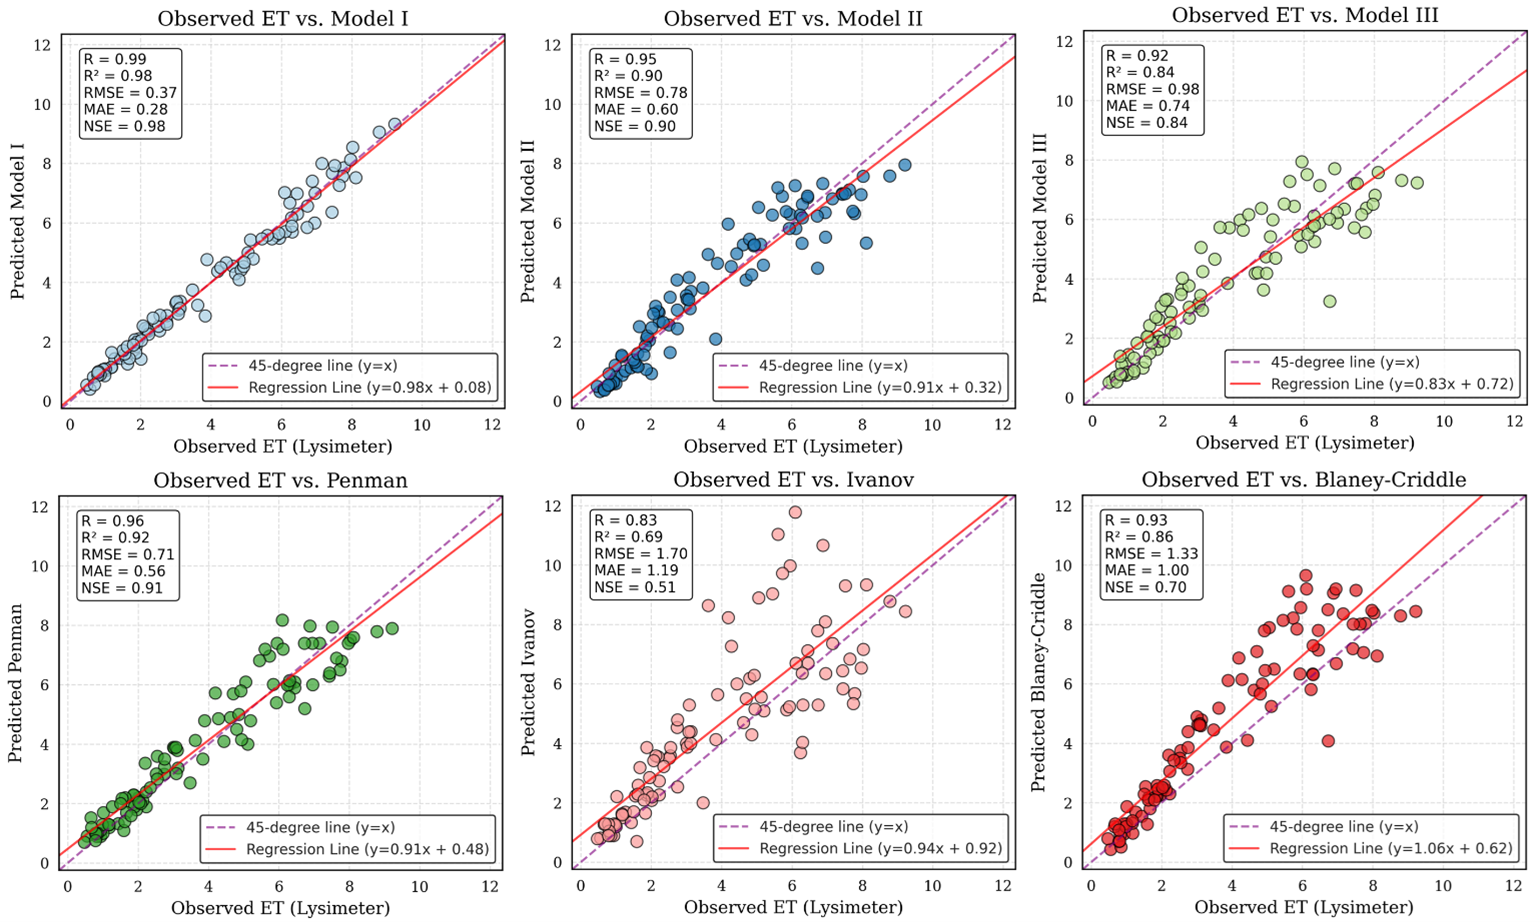
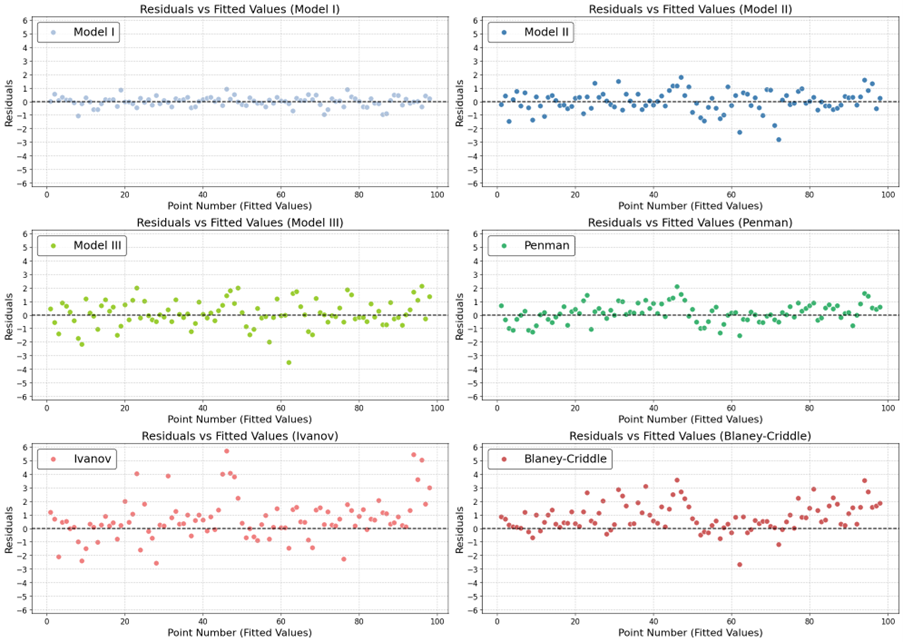
The regression analysis of evapotranspiration (ETo) estimates for the test set clearly highlighting the superior performance of Model I (Fig. 4). The model shows minimal errors in all statistical metrics, reflecting its high accuracy in estimation. In contrast, the Ivanov equation, among the conventional models, exhibits the highest levels of errors, making it the least accurate in estimating evapotranspiration compared to other models. The scatter plot of differences between the estimated and lysimeter-measured values for both the traditional methods and the proposed GEP models estimates for the test set also shows Model I superiority (Fig. 5), with residuals showing minimal deviation around zero, not exceeding ±0.25 mm/day, indicating high accuracy and stability in estimation. Among the traditional models, the Penman method shows relatively close performance, but with a wider residual distribution reaching ±1 mm/day. Models II and III exhibit larger errors and greater dispersion, while the Ivanov and Blaney-Criddle equations show the highest scatter and a noticeable deviation from the zero line.
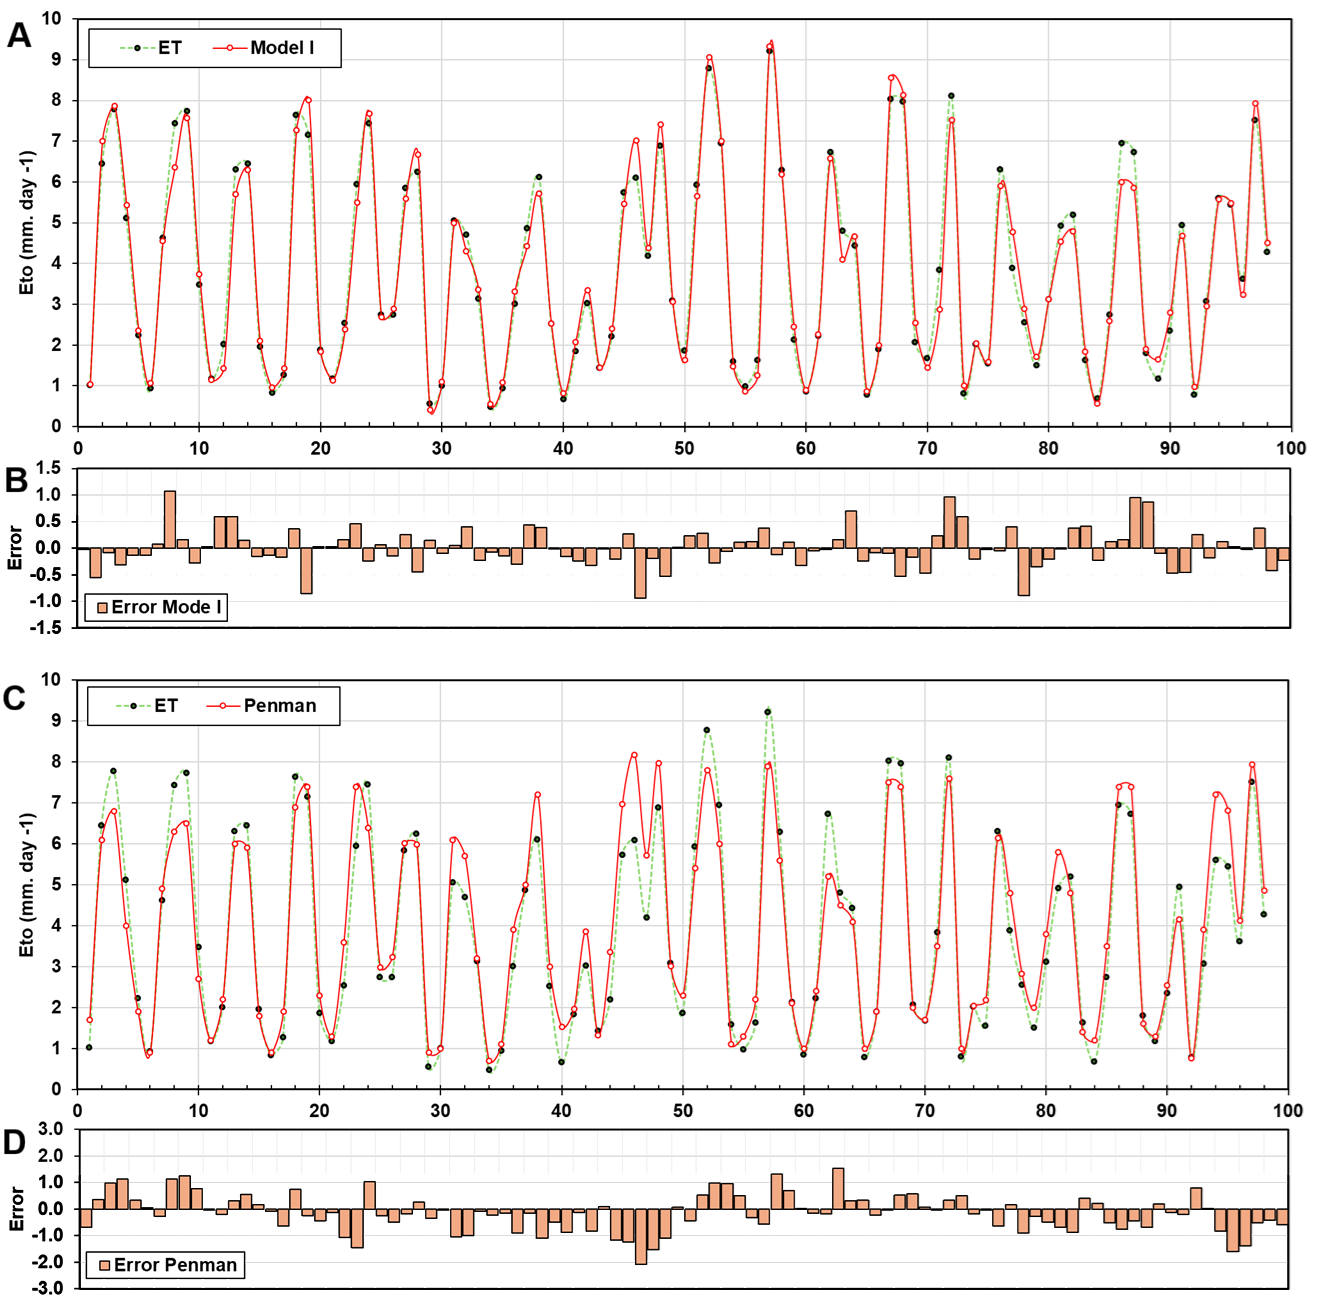
Lysimeter-derived (actual) evapotranspiration (ETo) was compared with estimates from the best-performing GEP model (Model I) and the best conventional formulation (the Penman equation) (Fig. 6). Model I reproduce the higher evapotranspiration peaks with good fidelity, which is particularly important for irrigation planning during periods of maximum atmospheric demand and for maintaining consistency in water-balance assessments (Fig. 6 A). The figure also indicates that Model I captures low evapotranspiration values, supporting more efficient irrigation decisions by reducing the risk of unnecessary water application under dry climatic conditions.
The sensitivity analysis of Model I showed that temperature (T) represents the most influential factor at 45.5%, followed by sunshine hours (S) at 29.2%, then wind speed (W) at 13.0%, and finally relative humidity (RH) at 12.3%. This order aligns with the physical basis of the reference evaporation and transpiration process, as temperature is strongly related to evaporative demand through its effect on saturated vapor pressure and the slope of the vapor pressure curve, while sunshine hours reflect the availability of radiative energy necessary for evaporation. In contrast, wind and relative humidity contribute to the air component by controlling the transport of water vapor and the moisture gradient in the air, although their effect may appear relatively less when their fluctuations are weaker or when their relationship with the other variables is more interconnected within the site data. Practically, these results indicate that the variables T and S explain the majority of the model’s response (a total of 74.7%), with W and RH remaining important supporting factors for improving the representation of daily variations and maximum limits, especially during periods of increased air control or when moisture deficits widen.
The results here indicate that the proposed GEP-based models, particularly Model I, outperform conventional empirical equations for evapotranspiration estimation, which is consistent with previous studies reporting the superiority of GEP in data-scarce hydrological applications. Similar findings demonstrated that GEP can better capture nonlinear climatic interactions compared to classical equations such as Blaney–Criddle and Ivanov [18][22].
The superior performance of Model I is physically justified by its inclusion of the main climatic drivers controlling evapotranspiration, namely temperature, sunshine duration, humidity, and wind speed, consistent with the structure of the Penman–Monteith equation. In contrast, models excluding aerodynamic or radiative variables showed reduced performance, particularly under high evaporative demand conditions. The sensitivity analysis further confirms the dominant role of temperature and radiation-related variables, which aligns with established evapotranspiration theory [12], highlighting the primary control of energy availability on atmospheric water loss.
Despite these advantages, model transferability remains a limitation [19], since GEP models may lose accuracy when applied outside their calibration domain. These discrepancies are attributed to site specific factors such as topography [46] and soil properties [47], which limits the applicability of developed models in other areas unless fine-tuned for the targeted environments. Nevertheless, the main strength of the proposed approach lies in generating accurate and interpretable equations suitable for operational use in data-limited environments.
Conclusion
This study developed and evaluated three gene expression programming (GEP)–derived equations to estimate evapotranspiration (Ep/ETo) in the central region of Syria. Meteorological inputs from Al-Mukhtariyah and Tizin research stations were used and the models were validated against lysimeter measurements at the stations. Across both training and independent testing datasets, the proposed GEP models consistently outperformed the conventional formulations (Blaney–Criddle, Ivanov, and Penman equations), with Model I providing the most accurate and stable estimates. The improved performance reflects the ability of GEP to capture nonlinear interactions among climatic drivers while retaining an explicit closed-form structure suitable for operational use.
The sensitivity analysis for the best equation suggests that air temperature and sunshine duration are the dominant controls on model output, while wind speed and relative humidity have secondary but still meaningful contributions. This pattern is physically consistent with evapotranspiration theory, where radiative forcing and temperature govern the available energy and saturation vapor pressure behavior, while wind and humidity mainly influence aerodynamic transport and atmospheric demand. From an applied perspective, the derived equations provide a practical option for data-limited settings, since they deliver locally calibrated and transparent formulas that can support irrigation scheduling and water-balance studies, particularly during periods of high evaporative demand. Despite the strong agreement with lysimeter observations, the proposed equations were derived from only two stations and a finite climatic record. Therefore, their transferability to other locations should be tested before broader adoption. Future work should evaluate spatial robustness using additional stations, extend validation across longer periods and extreme events, and compare performance under different input-availability scenarios (for example, temperature-only versus full meteorological forcing). Incorporating time-based validation and uncertainty analysis would further strengthen the confidence in operational use.
Conflict of interest statement
The authors declared no conflict of interest.
Funding statement
The authors declared that no funding was received in relation to this manuscript.
Data availability statement
The authors stated that lysimeter and climatic data used in this study will be made available upon reasonable request from the corresponding author.
References
- Allen RG, Pereira LS, Raes D, Smith M. Crop evapotranspiration-Guidelines for computing crop water requirements-FAO Irrigation and drainage paper 56. FAO, Rome. 1998;300(9):D05109.
- Raza A, Saber K, Hu Y, L. Ray R, Ziya Kaya Y, Dehghanisanij H, Kisi O, Elbeltagi A. Modelling reference evapotranspiration using principal component analysis and machine learning methods under different climatic environments. Irrig. Drain. 2023;72(4):945-70. DOI
- Vishwakarma DK, Ali R, Bhat SA, Elbeltagi A, Kushwaha NL, Kumar R, Rajput J, Heddam S, Kuriqi A. Pre- and post-dam river water temperature alteration prediction using advanced machine learning models. Environ. Sci. Pollut. Res. 2022;29(55):83321-46. DOI
- Gavilán P, Berengena J, Allen RG. Measuring versus estimating net radiation and soil heat flux: Impact on Penman–Monteith reference ET estimates in semiarid regions. Agric. Water Manag. 2007;89(3):275-86. DOI
- Khoshhal J, Mokarram M. Model for prediction of evapotranspiration using MLP neural network. Int. J. Environ. Sci. 2012;3(3):1000-9.
- Algretawee H, Al-Saadi RJM, Al Juboury MF, Hasan WH, Nile BK, Kadhim MA. Determination of Difference Amount in Reference Evapotranspiration between Urban and Suburban Quarters in Karbala City. J. Ecol. Eng. 2022;23(7):180-91. DOI
- Wang K, Dickinson RE. A review of global terrestrial evapotranspiration: Observation, modeling, climatology, and climatic variability. Rev. Geophys. 2012;50(2):2011RG000373. DOI
- Raza A, Shoaib M, Baig MA, Ahmad S, Khan MM, Ullah MK, Hashim S. Comparative study of powerful predictive modeling techniques for modeling monthly reference evapotranspiration in various climatic regions. Fresenius Environ. Bull. 2021;30:7490-513.
- Trajkovic S, Kolakovic S. Wind-adjusted Turc equation for estimating reference evapotranspiration at humid European locations. Hydrol. Res. 2009;40(1):45-52. DOI
- Tabari H, Talaee PH. Local Calibration of the Hargreaves and Priestley-Taylor Equations for Estimating Reference Evapotranspiration in Arid and Cold Climates of Iran Based on the Penman-Monteith Model. J. Hydrol. Eng. 2011;16(10):837-45. DOI
- Jabloun M, Sahli A. Evaluation of FAO-56 methodology for estimating reference evapotranspiration using limited climatic data. Agric. Water Manag. 2008;95(6):707-15. DOI
- McVicar TR, Roderick ML, Donohue RJ, Li LT, Van Niel TG, Thomas A, Grieser J, Jhajharia D, Himri Y, Mahowald NM. Global review and synthesis of trends in observed terrestrial near-surface wind speeds: Implications for evaporation. J. Hydrol. 2012;416-417:182-205. DOI
- Sudheer KP, Gosain AK, Ramasastri KS. Estimating Actual Evapotranspiration from Limited Climatic Data Using Neural Computing Technique. J. Irrig. Drain. Eng. 2003;129(3):214-8. DOI
- Kişi Ö. Evapotranspiration estimation using feed-forward neural networks. Hydrol. Res. 2006;37(3):247-60. DOI
- Doğan E. Reference evapotranspiration estimation using adaptive neuro‐fuzzy inference systems. Irrig. Drain. 2008;58(5):617-28. DOI
- Ferreira C. Gene Expression Programming in Problem Solving. In: Soft Computing and Industry. Springer London. 2002. DOI
- Alsaeed RD, Alaji B, Ibrahim M. Predicting aluminium using full-scale data of a conventional water treatment plant on Orontes River by ANN, GEP, and DT. Int. J. Water 2023;15(3):190-206. DOI
- Shiri J, Kişi Ö, Landeras G, López JJ, Nazemi AH, Stuyt LC. Daily reference evapotranspiration modeling by using genetic programming approach in the Basque Country (Northern Spain). J. Hydrol. 2012;414-415:302-16. DOI
- Shiri J, Sadraddini AA, Nazemi AH, Kisi O, Landeras G, Fakheri Fard A, Marti P. Generalizability of Gene Expression Programming-based approaches for estimating daily reference evapotranspiration in coastal stations of Iran. J. Hydrol. 2014;508:1-11. DOI
- Yassin MA, Alazba A, Mattar MA. Artificial neural networks versus gene expression programming for estimating reference evapotranspiration in arid climate. Agric. Water Manag. 2016;163:110-24. DOI
- Mattar MA. Using gene expression programming in monthly reference evapotranspiration modeling: A case study in Egypt. Agric. Water Manag. 2018;198:28-38. DOI
- Traore S, Guven A. Regional-Specific Numerical Models of Evapotranspiration Using Gene-Expression Programming Interface in Sahel. Water Resour. Manag. 2012;26(15):4367-80. DOI
- Achite M, Jehanzaib M, Sattari MT, Toubal AK, Elshaboury N, Wałęga A, Krakauer N, Yoo J, Kim T. Modern Techniques to Modeling Reference Evapotranspiration in a Semiarid Area Based on ANN and GEP Models. Water. 2022;14(8):1210. DOI
- Raza A, Vishwakarma DK, Acharki S, Al-Ansari N, Alshehri F, Elbeltagi A. Use of gene expression programming to predict reference evapotranspiration in different climatic conditions. Appl. Water Sci. 2024;14(7):152. DOI
- Jasmine M, Mohammadian A, Bonakdari H. On the Prediction of Evaporation in Arid Climate Using Machine Learning Model. Math. Comput. Appl. 2022;27(2):32. DOI
- Kumar R, Jat MK, Shankar V. Methods to estimate irrigated reference crop evapotranspiration – a review. Water Sci. Technol. 2012;66(3):525-35. DOI
- Poss J, Russell W, Shouse P, Austin R, Grattan S, Grieve C, Lieth J, Zeng L. A volumetric lysimeter system (VLS): an alternative to weighing lysimeters for plant–water relations studies. Comput. Electron. Agric. 2004;43(1):55-68. DOI
- Penman HL. Natural evaporation from open water, bare soil and grass. Proceedings of the Royal Society of London. Ser. A Math. Phys. Sci. 1948;193(1032):120-45. DOI
- Tabari H, Grismer ME, Trajkovic S. Comparative analysis of 31 reference evapotranspiration methods under humid conditions. Irrig. Sci. 2011;31(2):107-17. DOI
- Blaney HF, Criddle WD. Determining water requirements in irrigated areas from climatological and irrigation data. Washington, DC: US Soil Conservation Service. 1950.
- Doorenbos J, Pruitt WO. Guidelines for predicting crop water requirements. FAO Irrigation and Drainage Paper 24. FAO, Rome, Italy. 1977.
- Ugarković D, Džeko M, Tikvić I, Blažević I. Usporedba metoda izračuna potencijalne evapotranspiracije u različitim klimatskim tipovima i vegetacijskim pojasevima. Šumar. List. 2024;148(7-8):389-402. DOI
- Shahrajabian MH, Sun W. A review of lysimeter studies and experiments by considering agricultural production. J. Stress Physiol. Biochem. 2024;20(2):114-32.
- Bilibio C, Schellert C, Retz S, Hensel O, Schmeisky H, Uteau D, Peth S. Water balance assessment of different substrates on potash tailings piles using non-weighable lysimeters. J. Environ. Manag. 2017;196:633-43. DOI
- Srinivas B, Tiwari K. Determination of Crop Water Requirement and Crop Coefficient at Different Growth Stages of Green Gram Crop by Using Non-Weighing Lysimeter. International Journal of Current Microbiology and Applied Sciences 2018;7(09):2580-9. DOI
- Meissner R, Rupp H, Haselow L. Use of lysimeters for monitoring soil water balance parameters and nutrient leaching. In: Climate Change and Soil Interactions. Elsevier. 2020. DOI
- Negash TW, Tefera AT, Ashemi Bikila G, Tezera Bizuneh K, Awulachew TW, Gurms Dinku A. Determination of Evapotranspiration and Crop Coefficient for Tomato by Using Non-Weighing Lysimeter in Semiarid Region. Air Soil Water Res. 2024;17:11786221241291313. DOI
- Tolk JA, Evett SR. Lysimetry versus Neutron Moisture Meter for Evapotranspiration Determination in Four Soils. Soil Sci. Soc. Am. J. 2009;73(5):1693-8. DOI
- Doorenbos J, Pruitt WO. Crop water requirements. FAO irrigation and drainage paper 24. Land and Water Development Division. FAO, Rome. 1977;144(1).
- Fooladmand HR, Ahmadi SH. Monthly spatial calibration of Blaney–Criddle equation for calculating monthly ETo in south of Iran. Irrig. Drain. 2008;58(2):234-45. DOI
- Gharehbaghi A, Kaya B. Calibration of Blaney-Criddle Evapotranspiration Equation for Kutahya province in Turkey. In: International Korkut Ata Scientific Researches Conference. Osmaniye Korkut Ata University Osmaniye, Turkey. 2022.
- Zotarelli L, Dukes MD, Romero CC, Migliaccio KW, Morgan KT. Step by step calculation of the Penman-Monteith Evapotranspiration (FAO-56 Method). Institute of Food and Agricultural Sciences. University of Florida. 2010.
- Alsaeed RD, Alaji B, Ibrahim M. Modeling Jar Test Results Using Gene Expression to Determine the Optimal Alum Dose in Drinking Water Treatment Plants. Baghdad Sci. J. 2022;19(5):0951. DOI
- Fakharian P, Nouri Y, Asaad Samani A, Rezazadeh Eidgahee D, Torabi MR, Hoseini Vaez SR. Explainable machine learning model and gene expression programming for predicting reinforced concrete beams moment capacity exposed to fire. Sci. Rep. 2025;16(1):2309. DOI
- Ritter A, Muñoz-Carpena R. Performance evaluation of hydrological models: Statistical significance for reducing subjectivity in goodness-of-fit assessments. J. Hydrol. 2013;480:33-45. DOI
- Donaldson A, Dralle D, Barling N, Callahan RP, Loik ME, Zimmer M. Aspect differences in vegetation type drive higher evapotranspiration on a pole‐facing slope in a California oak savanna. J. Geophys. Res. Biogeosci. 2024;129(7):e2024JG008054. DOI
- Wankmüller FJP, Delval L, Lehmann P, Baur MJ, Cecere A, Wolf S, Or D, Javaux M, Carminati A. Global influence of soil texture on ecosystem water limitation. Nature. 2024;635(8039):631-8. DOI
Cite this article:
Aldarwish AQ, Alsaeed RD, Khozam BA. Lysimeter-validated gene expression programming models for evapotranspiration estimation in semi-arid Syria. DYSONA-Applied Science. 2027;8(1):44-58. doi: 10.30493/das.2026.011508