Amer Qousai Aldarwish 1,2*; Tamadour Jaber Alibraheem 2; Abdullah Ansari 3,4
1, Water Resources Management and Engineering Department, Faculty of Civil Engineering, Homs University, Homs, Syria
2, Faculty of Civil Engineering, Al-Wataniya Private University, Hama, Syria
3, Earthquake Monitoring Center, Sultan Qaboos University, PC: 123 Al-Khoudh, Muscat, Oman
4, Department of Civil Engineering, Inha University, Incheon, 22212, Republic of Korea
E-mail:
aamer.aldarwish@wpu.edu.sy
Received: 17/10/2025
Acceptance: 16/01/2026
Available Online: 17/01/2026
Published: 01/07/2026

Manuscript link
http://dx.doi.org/10.30493/DAS.2026.011701
Abstract
Floods are among the most significant natural hazards threatening communities, driven by climate change and human activities. Al-Ghamqa River Basin, located south of Tartous city, is highly vulnerable to floods and soil erosion due to the absence of soil conservation practices and water storage structures. In this study, an integrated AHP–GIS methodology was applied to classify Al-Ghamqa sub-basins according to flood hazard susceptibility. Using SRTM 30m digital elevation model data, fourteen sub-watersheds were delineated within Al-Ghamqa River Basin, and thirteen key morphometric parameters were calculated, covering linear, areal, and relief aspects. The Analytic Hierarchy Process (AHP) was used to assign weights to these parameters through pairwise comparison matrices. The results indicated that drainage density (Dd) and stream frequency (Fs) were the most influential parameters in flood susceptibility, each with a weight of 0.152. The sub-watersheds were classified into five priority levels: Very High (28.61%), High (16.23%), Moderate (18.15%), Low (14.10%), and Very Low (22.91%). The ROC–AUC analysis produced a value of 0.865, confirming the model’s high predictive accuracy.
Keywords: AHP, Flood, Soil erosion, Morphometric parameters
Introduction
Water and soil represent indispensable natural resources that form the foundation of food security and socio-economic development. However, escalating population growth and anthropogenic activities, such as deforestation and land-use changes, are exerting unprecedented pressure on these finite resources. This situation highlights the demand for sustainable watershed management strategies to ensure their long-term conservation [1]. In regions experiencing high rainfall intensity, soil degradation manifests through erosion, diminished fertility, and increased sedimentation in river systems, ultimately compromising water quality downstream [2].
The physiographic and morphometric characteristics of a watershed, such as rock permeability, hardness, erosion susceptibility, and basin geometry, play a critical role in runoff generation and hydrological behavior [3]. Morphometric analysis offers a quantitative framework for evaluating these geomorphological attributes, enhancing the understanding of catchment dynamics and supporting the selection of suitable sites for soil and water conservation structures, including check dams [3][4]. Watersheds function as integrated hydrological units that channel precipitation into river networks, making their systematic study and management vital for sustainable development and environmental conservation [4]. Moreover, morphometric analysis enables the identification of areas most vulnerable to soil erosion, facilitating targeted watershed zoning for conservation and rehabilitation efforts [5].
The integration of Geographic Information Systems (GIS) and remote sensing has markedly improved the precision and efficiency of morphometric assessments, allowing for multi-criteria evaluation and scientifically informed watershed prioritization [6]. Numerous studies have applied morphometric parameters within multi-criteria decision-making frameworks, such as the Analytic Hierarchy Process (AHP), to systematically rank sub-watersheds according to their susceptibility to erosion and flooding [7].
Applying morphometric analysis to large basins presents challenges related to accuracy and computational demands. Digital Elevation Models (DEMs) from sources like the Shuttle Radar Topography Mission (SRTM) provide medium- to high-resolution data that are extensively utilized in morphometric and hydrological research [8]. Morphometric analysis entails the quantitative examination of terrain features using topographic maps, satellite imagery, and field data. Geological formations and structural controls profoundly influence basin development, with morphometric parameters serving as key indicators of a basin’s evolutionary stage [9].
As the watershed represents the most appropriate unit for analyzing hydrological processes, a quantitative evaluation of its morphometric characteristics helps clarify similarities and differences among sub-basins and their correlation with hydrological responses [10]. Studies indicate that linear and relief parameters, combined with high drainage density and stream frequency, are particularly influential in elongated basins characterized by low infiltration capacity, rendering them highly prone to soil erosion and flooding [11].
This study applies the AHP-GIS algorithm to prioritize sub-watersheds within Al-Ghamqa River Basin for soil and water conservation interventions. Building upon the methodologies refined in the reviewed literature, key morphometric parameters were calculated and integrated through AHP-based weighting. The resulting prioritization is validated using ROC-AUC analysis and historical flood data derived from satellite imagery.
Material and Methods
Study area
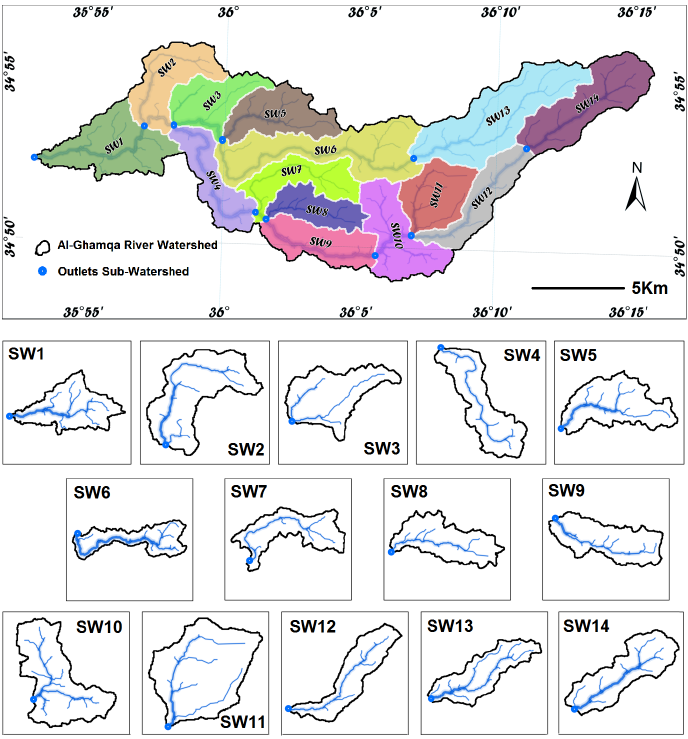
Al-Ghamqa River Basin, located south of Tartous city along Syria’s Mediterranean coast, represents a critical area of study for watershed management. Encompassing 214.3 km², the basin extends approximately 35 km in an east-west orientation, with elevations ranging from sea level to 1,070 meters in the western ridges of the Syrian coastal mountains (Fig. 1). The basin’s topography transitions from steep mountainous terrain in the east to a narrow coastal plain in the west, characterized by Cretaceous and Pliocene basaltic formations with moderate to low porosity. Under typical Mediterranean climate conditions, the region experiences heavy winter precipitation (550-1100 mm annually) and summer drought periods, creating a hydrological regime highly susceptible to flash floods and soil erosion. The combination of population growth, agricultural expansion, and intensive land use practices with no clear conservation strategy has further exacerbated the basin’s vulnerability to water-related hazards, necessitating urgent conservation strategies.

Morphometric analysis
The basin was divided into fourteen sub-basins (Fig. 2). Digital Elevation Model (DEM) of Al-Ghamqa River Basin was derived from 30 m resolution SRTM data obtained from the USGS’s Earth Explorer. The DEM was used for watershed delineation, drainage network extraction, and morphometric analysis. Overall, 13 morphometric parameters were used, including linear aspects, spatial aspects, and terrain aspects, where all morphometric parameters were estimated based on the extracted data set and the empirical formulas (Table 1).

Hierarchical analysis
The Hierarchical Analysis Algorithm is a widely applied multi-criteria decision-making method in the field of water resources and environmental management. The elements in this method are compared according to Saaty’s priority scale from (1-9), and numerical points are assigned to each element according to its importance in achieving the goal of the model. The pairwise comparisons constitute the input in this method, while the weights (relative importance) of the criteria are the output. Weight values are calculated according to the hierarchical analysis method from the PCMS pair comparison matrix, which is formed based on the opinions of the selected experts based on their knowledge of the study area. In this study, 35 experts (15 academic specialists in hydrology and hydrogeology, 8 experts in soil science and agriculture, and 12 technical experts from governmental institutions and international organizations concerned with water basin management and environmental risk assessment) were selected and interviewed individually to provide a value of importance within the range (1-9) for each influential scale, where the errors of judgment are determined, and the congruence ratio is calculated through the following steps [20]:
- Identify the important metric in the issue: Evaluating the importance of each criterion relative to the other is usually done by experts using a scale (1-9), and this step involves three main procedures:
- Calculating the priority vector of the scale or calculating the paired comparison matrix of the criteria.
- Calculate the linear transformation coefficient (Principal Eigen Value):

λmax: The linear transformation coefficient; ∑Sum: The sum of the columns or lines in the matrix; n: Number of criteria
- Calculate the CI (The index of congruence), which gives information about the logical match between two opinions for a complete comparison. If CI=0, there is no logical match between paired comparisons, or the percentage of mismatch is 100%, and the CI is calculated:

- Determine the estimated value of the random match ratio and its symbol RI (Table 2).

- Calculate the Match ratio CR, which is a comparison between the match index and the random match index, according to the following equation:

If the value of the match ratio is less than or equal to 10%, the mismatch is acceptable. Conversely, if the match ratio is greater than 10%, the expert’s opinion should be rejected.
Data standardization is an essential part of any decision-making process as it converts the input data (with different scales) into numerical data (a common numerical range/scale), rendering it consistent and comparable, eliminating any bias due to different scales of data, and resulting in a final score that can be prioritized in the AHP with accuracy and reliability.
Normalization of data is used to categorize criteria into beneficial and non-beneficial in AHP by converting this data into a common scale.
For beneficial criteria (positive criteria), the normalization is performed [20]:

Wij is a normalized value of ith morphometric parameter (P) of jth watershed; Pij is the original value of ith morphometric parameter (P) of jth watershed.
In case of non-beneficial criteria (negative criteria), normalization was performed:

The simple additive weighting method evaluates each alternative, Fj [20]:

Where Fj is weight normalized decision matrix element, Wij is the normalized value of the ith alternative in the jth criteria, and xj is the weight of jth criteria obtained from the AHP model. In the Saw method, the total score (Prioritized score) of each sub-watershed is then calculated [20]:

Results and Discussion
Morphometric characterizations
The SRTM 30m digital elevation model was analyzed to extract the linear, cadastral, and topographic morphometric features of the sub-basins. This analysis derived the sub-basin boundaries, drainage line network, stream frequency, and stream order (including number and length) (Supplementary Table 1).
A total of 13 morphometric parameters were used to assess the risk of flash floods (Table 3). The parameters are directly proportional to the occurrence of hazardous floods except for Rb and Lof [21]. Overland flow length (Lof) is defined as the length of surface water flow before it reaches the main stream in the basin and is equal to half the reciprocal of discharge density (Dd), a low value of Lof indicates high topography [22]. The bifurcation ratio (Rb) is defined as the average number of culverts from one order to the next higher order. Low Rb values indicate areas with relatively low topography and a circular basin shape, which increases the likelihood of flood risk [23]. In fact, water is more likely to flow in one culvert rather than several, which can cause high peak discharge, and the low Rb ratio indicates that the sub-basins are less affected by structural disturbances, with soft bedrock, which facilitates increased water infiltration and creates favorable conditions for groundwater potential in the area [24].

AHP-based flood susceptibility prioritization and model validation
To determine the importance of morphometric parameters (weight) in the formation of runoff (instantaneous flooding), the binary comparison matrix is formed (Table 4), and the eigenvector is calculated, which is obtained by adding the elements of the covariance matrix to each other horizontally and then scaling them (making the weights as a ratio of 1) by dividing them by the total sum. By applying the double comparison matrix of the morphometric parameters, it was noted that:
Principal Eigen value λmax =13.128, consistency index CI =0.011, Random Consistency Index RI=1.56, and Consistency Ratio CR =0.70%. According to this value, the stability ratio is satisfactory, and the relative weights calculated by the AHP eigenvector method for the objective layers are adopted as the final overall weights for each layer.

Based on the calculated standard weights for each parameter through AHP (Table 5), the most influential parameters on flood formation were quantitatively identified as Drainage Density (Dd) and Stream Frequency (Fs), each with a weight of 15.2%, followed by Relief Ratio (Rr) and Length of Overland Flow (Lof), both at 11.7%. This weighting scheme, derived from the eigenvector method with a highly satisfactory consistency ratio (CR = 0.70%), confirms that steep slopes, short flow paths, increased runoff, and reduced infiltration capacity (characteristics directly associated with these parameters) constitute the primary drivers enhancing vulnerability to flash floods in the basin [25].

Through the Eigen Vector calculated for the morphometric parameters, the priority index weight based on each attribute was obtained individually by AHP (Hierarchical Analysis Process), and the priority was determined according to the final priority index value. That is the 1st rank for the highest value and the lowest rank for the lowest value (Table 6).

The sub-watersheds within Al-Ghamqa basin were systematically classified into five distinct flood-hazard categories, ranging from very high to very low, based on an AHP-integrated morphometric analysis (Table 6 and Fig. 3). To validate this prioritization in the absence of extensive climatic and hydrological records, a two-fold verification approach was employed. First, a historical flood inventory was derived from Sentinel-1 satellite radar imagery for the period 2018–2023. This data enabled precise mapping of water bodies, facilitating a comparative analysis between wet and dry seasons to identify areas of recurrent inundation. The results confirmed that the sub-basins classified as ‘high’ and ‘very high’ hazard consistently experienced the most frequent flooding (Fig. 3). In the second approach, the predictive reliability of the AHP-GIS model was quantitatively assessed using the Receiver Operating Characteristic (ROC) curve. This was achieved by comparing the flood priority classification maps with the spatial distribution of historical flood frequency (2018–2023) derived from Sentinel-1 radar imagery. The resulting Area Under the Curve (AUC) value of 0.865 (Fig. 4) demonstrates excellent model accuracy. This strong statistical performance, corroborated by the satellite data, confirms that the AHP-GIS framework can determine watershed priorities with a good degree of reliability, providing a robust foundation for guiding targeted soil and water conservation strategies. Following the classification of the sub-watersheds into five priority categories, the areal percentage for each class was calculated as follows: Very Low (22.91%), Low (14.10%), Medium (18.15%), High (16.23%), and Very High (28.61%) (Table 7).


The first two priority classes (High and Very High) collectively account for 44.84% of the total basin area. Consequently, water resource management and soil conservation strategies must be urgently directed towards the sub-watersheds classified in these areas. The implementation of highly effective measures, such as check dams, gully plugs, and contour trenching, is essential to mitigate severe erosion, manage runoff, enhance sediment retention, and promote groundwater recharge in vulnerable areas.
Conclusions
The AHP-GIS methodology demonstrates particular value in data-scarce regions, establishing a reliable assessment framework (AUC = 0.865) utilizing 13 morphometric parameters across 14 sub-watersheds within Al-Ghamqa River Basin and using SRTM 30m digital elevation model data. The analysis identified sub-watersheds SW2, SW10, SW11, and SW14 as the highest priority areas, collectively representing 28.61% of the basin. Drainage density (Dd) and Stream frequency (Fs) emerged as the most influential parameters, each carrying a weight of 15.2% in the AHP pairwise comparison matrix. The model demonstrated exceptional reliability with an AUC value of 0.865, while validation using Sentinel-1 satellite imagery (2018-2023) confirmed that these high-priority areas consistently experienced the most frequent flooding events. The results provide a scientifically validated framework for implementing targeted soil and water conservation measures, such as check dams and contour trenching, in the most vulnerable sub-watersheds, offering an effective strategy for sustainable watershed management in data-scarce Mediterranean regions. To enhance this assessment, integrating external data on precipitation, land cover, and surface infiltration is recommended. Such integration would allow for priority adjustment based on each sub-basin’s actual capacity to mitigate flood impact and erosion through natural regulation processes, leading to more precise and effective resource management.
Supplementary Files
Conflict of interest statement
The authors declared no conflict of interest.
Funding statement
The authors declared that no funding was received in relation to this manuscript.
Data availability statement
The authors declared that all used data sources are mentioned in the text. The used data will be available upon reasonable request from the corresponding author.
References
- Chen L, Wei W, Fu B, Lü Y. Soil and water conservation on the Loess Plateau in China: review and perspective. Prog. Phys. Geogr. Earth Environ. 2007;31(4):389-403. DOI
- Borrelli P, Robinson DA, Fleischer LR, Lugato E, Ballabio C, Alewell C, Meusburger K, Modugno S, Schütt B, Ferro V. An assessment of the global impact of 21st century land use change on soil erosion. Nat. Commun. 2017;8(1):2013. DOI
- Van Pelt RS, Hushmurodov SX, Baumhardt RL, Chappell A, Nearing MA, Polyakov VO, Strack JE. The reduction of partitioned wind and water erosion by conservation agriculture. CATENA. 2017;148:160-7. DOI
- Meshram SG, Sharma SK. Prioritization of watershed through morphometric parameters: a PCA-based approach. Appl. Water Sci. 2015;7(3):1505-19. DOI
- Singh S, Singh AK, Kumar P, Jaiswal MK. Morphotectonic analysis of the Bihar River, Madhya Pradesh, India. Proc. Indian Natl. Sci. Acad. 2021;87(1):163-74. DOI
- Arabameri A, Tiefenbacher JP, Blaschke T, Pradhan B, Tien Bui D. Morphometric Analysis for Soil Erosion Susceptibility Mapping Using Novel GIS-Based Ensemble Model. Remote Sens. 2020;12(5):874. DOI
- Chowdary VM, Chakraborthy D, Jeyaram A, Murthy YVNK, Sharma JR, Dadhwal VK. Multi-Criteria Decision Making Approach for Watershed Prioritization Using Analytic Hierarchy Process Technique and GIS. Water Resour. Manag. 2013;27(10):3555-71. DOI
- Sarkar D, Mondal P, Sutradhar S, Sarkar P. Morphometric Analysis Using SRTM-DEM and GIS of Nagar River Basin, Indo-Bangladesh Barind Tract. J. Indian Soc. Remote Sens. 2020;48(4):597-614. DOI
- Dimple D, Rajput J, Al-Ansari N, Elbeltagi A, Zerouali B, Santos CAG. Determining the Hydrological Behaviour of Catchment Based on Quantitative Morphometric Analysis in the Hard Rock Area of Nand Samand Catchment, Rajasthan, India. Hydrology. 2022;9(2):31. DOI
- Prakash K, Singh S, Shukla UK. Morphometric changes of the Varuna river basin, Varanasi district, Uttar Pradesh. J. Geomat. 2016;10(1):48-54.
- RAM S. Watershed Prioritization based on LULC Characteristics using GIS and TOPSIS: A case of Chathe watershed. Annals of Plant and Soil Research 2022;24(3):505-11. DOI
- Strahler AN. Quantitative geomorphology of drainage basin and channel networks. Handbook of applied hydrology. 1964.
- Horton RE. Erosional Development of Streams and Their Drainage Basins; Hydrophysical Approach to Quantitative Morphology. Geol. Soc. Am. Bull. 1945;56(3):275. DOI
- Schumm SA. Evolution of Drainage Systems and Slopes in Badlands at Perth Amboy, New Jersey. Geol. Soc. Am. Bull. 1956;67(5):597. DOI
- Strahler AN. Quantitative analysis of watershed geomorphology. Eos Trans. AGU. 1957;38(6):913-20. DOI
- Horton RE. Drainage-basin characteristics. Eos Trans. AGU. 1932;13(1):350-61.
- Faniran A. The index of drainage intensity: a provisional new drainage factor. Aust. J. Sci. 1968;31(9):326-30.
- Potter PE. A Quantitative Geomorphic Study of Drainage Basin Characteristics in the Clinch Mountain Area, Virginia and Tennessee. V. C. Miller. The Journal of Geology 1957;65(1):112-3. DOI
- Strahler AN. Hypsometric (area-altitude) analysis of erosional topography. Geol. Soc. Am. Bull. 1952;63(11):1117. DOI
- Saaty TL, Vargas LG. Models, Methods, Concepts & Applications of the Analytic Hierarchy Process. Springer US. 2001. DOI
- Abdelkader MM, Al-Amoud AI, El Alfy M, El-Feky A, Saber M. Assessment of flash flood hazard based on morphometric aspects and rainfall-runoff modeling in Wadi Nisah, central Saudi Arabia. Remote Sens. Appl.: Soc. Environ. 2021;23:100562. DOI
- Vinutha DN, Janardhana MR. Morphometry of the Payaswini Watershed, Coorg District, Karnataka, India, using remote sensing and GIS techniques. Int. J. Innov. Res. Sci. Eng. Technol. 2014;3(5):516-24.
- Abdelkareem M. Targeting flash flood potential areas using remotely sensed data and GIS techniques. Nat. Hazard. 2016;85(1):19-37. DOI
- Bogale A. Morphometric analysis of a drainage basin using geographical information system in Gilgel Abay watershed, Lake Tana Basin, upper Blue Nile Basin, Ethiopia. Appl. Water Sci. 2021;11(7):122. DOI
- Rana VK, Suryanarayana TMV. Estimation of flood influencing characteristics of watershed and their impact on flooding in data-scarce region. Ann. Gis 2021;27(4):397-418. DOI
Cite this article:
Aldarwish AQ, Alibraheem TJ, Ansari A. Morphometric-based flood hazard mapping of Al-Ghamqa River Basin using AHP and GIS. DYSONA-Applied Science. 2026;7(2):189–99. doi: 10.30493/DAS.2026.011701