
Mohamed Hassan Fathima Nuskiya 1*; Sawjanya Sathyaseelan 2; Muhammad Nasar-u-Minallah 3,4
1, Department of Geography, South Eastern University of Sri Lanka, University Park, Oluvil 32360, Sri Lanka
2, Department of Geography, University of Sri Jayewardenepura, Nugegoda, 10250, Sri Lanka
3, Institute of Geography, University of the Punjab, Lahore, 54590, Pakistan
4, Department of Environment and Geography, University of York, York YO10 5DD, United Kingdom
E-mail:
nuskiyahassan@seu.ac.lk
Received: 10/09/2025
Acceptance: 23/06/2026
Available Online: 27/06/2026
Published: 01/07/2026

Manuscript link
http://dx.doi.org/10.30493/DAS.2026.012706
Abstract
The Sinharaja Rainforest is the only surviving primary tropical rainforest in Sri Lanka, a UNESCO World Heritage Site that is essential for biodiversity, hydrological and climatic regulation. The interaction between climatic and ecological processes in such environments are highly complicated rendering the accurate predictions of vegetation dynamics difficult. This study explores long‑term vegetation changes in the Sinharaja Rainforest using satellite‑based Normalized Difference Vegetation Index (NDVI) data from 2005 to 2024, along with major climate drivers such as precipitation, temperature, and solar radiation. To assess the performance of Random Forest (RF), Long Short‑Term Memory (LSTM), and Auto Regressive Integrated Moving Average (ARIMA) models, a comparative modeling framework was developed to analyze performance under data‑constrained tropical conditions. Root Mean Square Error (RMSE) and Mean Absolute Error (MAE) were used to evaluate model performance. Findings reveal that NDVI is generally stable, with moderate interannual variability that is strongly associated with precipitation patterns. RF and LSTM demonstrating a better ability to represent non‑linear vegetation–climate interactions, whereas ARIMA was less capable of capturing non‑linear processes. However, the intricate nonlinear and temporal structure was not adequately captured by any of the tested frameworks. Projections for 2025–2030 indicate that NDVI is likely to remain relatively stable with a weak downward trend, suggesting that vegetation is beginning to experience stress as climatic variability increases. Nevertheless, model uncertainty remains high due to the complexity of tropical ecosystems. This article demonstrates the need to incorporate climatic drivers into predictive systems and highlights the capability of machine learning algorithms for ecological forecasting. The results are useful for conservation planning based on adaptive management and long‑term monitoring of tropical rainforest ecosystems.
Keywords: NDVI, Rainforest, Machine learning, Precipitation
Introduction
Tropical rainforests are global carbon sinks and biodiversity hotspots, but are becoming threatened by climate change, land-use change, and unsustainable human activity [1-3]. The Sinharaja Rainforest, located in the south-western lowland wet zone of Sri Lanka, is an irreplaceable store of biodiversity. This rainforest covers an area of 8,864 hectares and is recognized as a UNESCO World Heritage and Biosphere Reserve [4]. The topography of Sinharaja is a complex system of ridges, valleys, and streams, and the annual rainfall is greater than 3,600 mm. This complexity allowed the presence of over 139 of the 217 endemic trees and woody climbers in Sinharaja. Additionally, 95 percent of the island’s endemic bird species, more than half of the endemic mammals, butterflies, reptiles, amphibians, and fish can be found in the area [5]. The existence of the highly endangered and iconic species, including the purple-faced langur (Semnopithecus vetulus), Sri Lanka blue magpie (Urocissa ornata), green-billed coucal (Centropus chlororhynchos), and leopard (Panthera pardus), also highlights the global importance of the forest as a conservation priority. Despite the immense importance of Sinharaja Rainforest, it is considered one of the most highly challenged ecosystems in Sri Lanka. Buffer-zone ecosystem fragmentation is a growing menace due to urban and agricultural encroachment, selective logging, gem mining, and infrastructure development [6]. This situation highlights the necessity of conservation efforts, as forests play important roles in the delivery of ecosystem services, including water cycles, carbon storage, and habitat connectivity.
Remote sensing has played a useful role in vegetation surveillance, even in dense and remote forests. In this context, the Normalized Difference Vegetation Index (NDVI) is one of the most widely used indicators, serving as a surrogate measure of canopy greenness, photosynthesis, and overall ecosystem productivity [7]. NDVI is determined by the difference between near-infrared (NIR) and red (R) light, captured as it is reflected by vegetation, and has a range of -1 to 1. The higher the NDVI, the healthier the vegetation at a given location [8]. Satellites, including Landsat and MODIS, have provided an NDVI time series to analyze long-term trends, identify disturbances, and index vegetation health [9-11]. To sustain ecosystems, capturing past changes is vital, but this must be accompanied by forecasting the future state of vegetation. However, conventional statistical methods tend to underperform at capturing the non-linear, non-permanent, and dynamic nature of tropical ecosystems. Machine learning models, especially random forest (RF) regression and long short-term memory (LSTM), have recently been demonstrated to perform well in this area [12][13]. RF, a decision tree-based method, is resistant to noise, can effectively handle nonlinear interactions, and provides variable importance measures; thus, it is a strong option for vegetation mapping and trend analysis [14][15]. On the other hand, LSTM models, which are suited to time-series data and can efficiently capture seasonal changes, are capable of forecasting complex environmental time series such as NDVI, particularly when climate-based data are available [16][17].
Globally, comparative studies evaluating RF and LSTM for NDVI forecasting remain limited, particularly in tropical ecosystems. Recent methodological developments include Bidirectional Long Short-Term Memory (BiLSTM)-based models that incorporate meteorological inputs and attention-based Bidirectional Gated Recurrent Unit (BiGRU) architectures that approach NDVI as a time series, using spatiotemporal predictors to produce high-resolution NDVI predictions [18]. Machine-learning-based vegetation tools have demonstrated high predictive capability for farming and drought-related applications in Sri Lanka utilizing gradient-driven models and Level 3 MODIS data [19]. Despite these advances, no study has systematically applied RF and LSTM models to predict NDVI in Sinharaja’s tropical rainforest, highlighting a clear gap and an opportunity for new contributions.
In the past few years, comparative analyses of RF and LSTM models for vegetation forecasting have become the focus of an increasing number of studies, indicating that the two methods complement each other. RF models perform particularly well at detecting complex and non-linear interactions between vegetation processes and environmental predictors, while LSTM networks are effective at recognizing sequential relationships and long-term trends [20]. By contrast, Auto-Regressive Integrated Moving Average (ARIMA) models offer a traditional linear reference point for time-series prediction, relying primarily on autoregressive and moving-average components. However, these models offer limited ability to capture non-linear ecological feedback and externally forced variability in vegetation dynamics. Although such comparative machine-learning structures have been applied globally, little is known about their use in South Asian tropical forests. These debates identify the Sinharaja Rainforest as a suitable candidate for analysis using predictive ML solutions. This represents a critical research gap, as the forest is experiencing increasing ecological pressure due to climatic variability and anthropogenic pressures.
This study seeks to fill existing gaps by examining long-term NDVI dynamics in the Sinharaja Rainforest and evaluating the effectiveness of various models in predicting vegetation. Specifically, it aims to: (i) investigate how NDVI changes over time between 2005 and 2024; (ii) compare the predictive capabilities of RF, LSTM, and ARIMA models; and (iii) generate short-term NDVI predictions for the period 2025–2030. By combining machine learning and remote sensing data, this research also aims to assist ecological monitoring systems in the area and shed light on the benefits and drawbacks of predictive modeling for tropical forests.
Materials and Methods
Study area
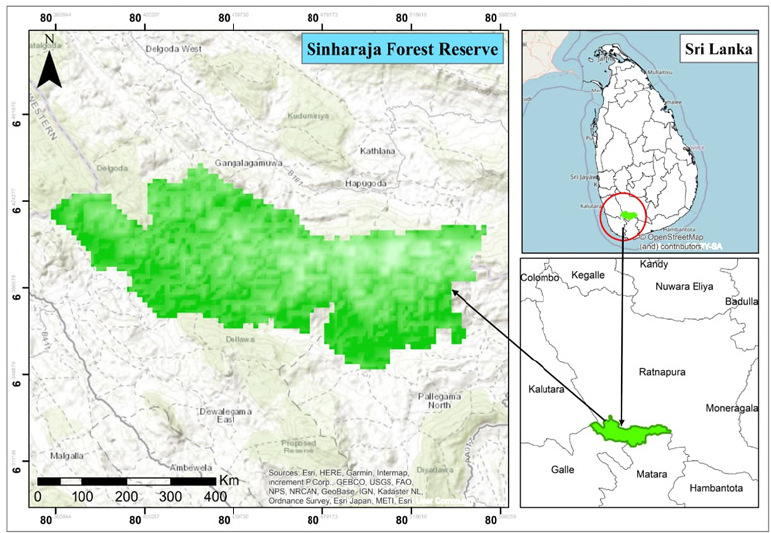
The Sinharaja Rainforest is located within the south-western lowland wet zone of Sri Lanka, bounded approximately by latitudes 6°21′–6°26′ N and longitudes 80°21′–80°34′ E (Fig. 1), and spanning elevations from 300 m to 1,170 m above sea level [5][21]. The region is characterized by tropical climate with annual rainfall exceeding 3,600 mm, driven by the south-western and north-east monsoons, which shorten the seasonal drought period [21]. The tropical rainforest topography, including ridges, valleys, and streams, creates diverse microhabitats and enhances resilience to disturbance. At the same time, Sinharaja plays a key hydrological role, regulating basin hydrology, reducing erosion, and acting as a major carbon sink that supports climate regulation [5][22][23]. Persistent anthropogenic pressures necessitate advanced remote-sensing and machine-learning-based monitoring frameworks [24][25]. Using the official forest boundary of the Sinharaja Reserve as a mask for the area of analysis ensured that only the legally recognized forest area was included, allowing pixel-based NDVI analysis to remain within this designated boundary. In this approach, vegetation index data were excluded based on the delimitation of protected areas provided by the UNESCO and UNEP-WCMC dataset.
Data acquisition
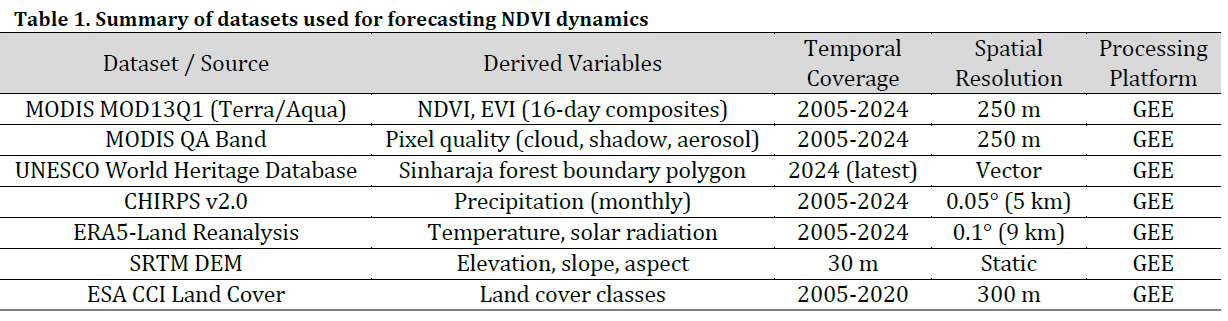
In this study, annual mean NDVI derived from MODIS MOD13Q1 was used as the target/output variable for forecasting. The input predictor variables for the RF and LSTM models included precipitation (CHIRPS), temperature and solar radiation (ERA5-Land), topographic variables (elevation, slope, and aspect derived from SRTM DEM), land cover (ESA CCI), and temporal information (2005-2224). In contrast, the ARIMA model was implemented as a univariate forecasting model using only historical NDVI observations without external predictors (Table 1). The predictor variables were temporally aligned with annual NDVI observations before model development to ensure consistency between climatic, topographic, and vegetation datasets.
Data pre-processing
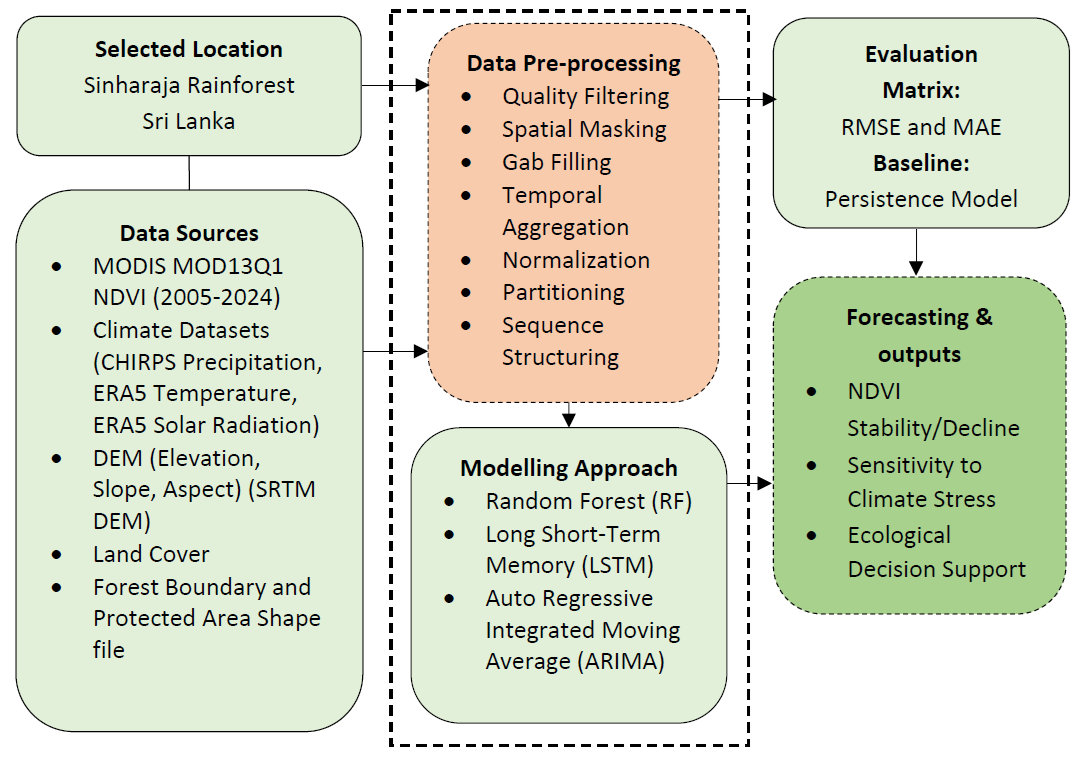
Before the models were constructed, a series of preprocessing steps were carried out to ensure that the input datasets were temporally consistent, spatially aligned, and free of noise or artifacts that could influence forecast quality (Fig. 2). When processing the MOD13Q1 NDVI product (2005–2024), the QA band was applied to filter out clouds, shadows, aerosols, and sensor noise, retaining only high-quality observations [26][27]. Continuity in the NDVI time series was maintained through linear temporal interpolation to fill missing values caused by cloud contamination. The 16-day NDVI composites were further aggregated into monthly averages to reduce high-frequency atmospheric noise and subsequently into annual averages to emphasize interannual vegetation dynamics and long-term ecological processes [28]. Although annual averages were used for long-term trend analysis and visualization, monthly NDVI composites were retained for sequential LSTM model training to preserve temporal depth for the 36-month look-back structure.
Instead of pixel-level observations, the study used annual mean NDVI data averaged over the Sinharaja Rainforest to reduce the noise at high spatial frequencies, to decrease computational burden, and to highlight ecosystem-scale vegetation dynamics at long time scales. Spatial averaging was more suitable than a pixel-wise model development, as the primary goal was to assess the temporal NDVI variability and forecasting performance at the forest ecosystem scale. A pixel-based approach would significantly add to the dimensionality of the data and the computational cost. This approach would also add variation at the local scale that could mask general spatial patterns of climate and ecology. The spatial mask was taken as a Sinharaja Forest Reserve boundary, as indicated by UNESCO, and integrated into Google Earth Engine to make sure that NDVI was only extracted within the area of protection. Average NDVI over time was also determined to characterize the vegetation states of forests on a large scale. Before model development, topographic predictors (elevation, slope, aspect) extracted from the SRTM DEM and climatic predictors (CHIRPS precipitation, ERA5-Land temperature, ERA5-Land solar radiation) were resampled to the spatial resolution of annually observed NDVI data and temporally matched to the same data.
Min-max scaling (0–1) was applied to all predictors to ensure consistency across machine learning models, particularly for LSTM modeling. To preserve temporal autocorrelation, the data were divided into training (2005–2019) and testing (2020–2024) sets. An interquartile range filter, followed by a rolling median smoother, was used to identify outliers based on ACF analysis, and a 36-month look-back window was chosen to reduce noise without losing the ecological signal.
ARIMA time-series modeling
The Auto-Regressive Integrated Moving Average (ARIMA) model is a classical statistical model widely used for univariate time-series forecasting. ARIMA was applied as a univariate model, using NDVI as the sole predictor, independent of exogenous climatic predictors. ARIMA combines three components: autoregression (AR), differencing (I), and moving average (MA). It is represented as ARIMA(p, d, q), where p is the autoregressive order, d is the degree of differencing required to achieve stationarity, and q is the moving average order [29][30].
Stationarity testing
The Augmented Dickey-Fuller (ADF) test was used to test the annual mean time series of the NDVI (2005-2024) before assuming stationarity, since ARIMA assumes stationarity. The null hypothesis of the ADF test states that the series contains a unit root (i.e., is non-stationary).
In case non-stationarity was identified, the first-order differencing was used:
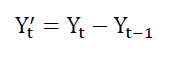
where Yt is the original NDVI series and Yt‘ is the differenced series.
Model identification
The Autocorrelation Function (ACF) and Partial Autocorrelation Function (PACF) plots were used in determining the optimal values of p and q. The PACF was used to indicate significant lags that helped in the selection of p, and the ACF was used to indicate significant lags that helped in the selection of q.
Model specification
The general ARIMA (p, d, q) model is expressed as:

Here, B is the backshift operator, ϕi and θj are autoregressive and moving-average parameters respectively, c is a constant, and is a white-noise error term.
Model training and forecasting
The NDVI time series was divided into training (2005-2019) and testing (2020-2024) phases. The test data were fitted to a validated ARIMA model, and the model was then applied to forecast NDVI for 2025–2030.
Random forest regression modeling
Random Forest (RF) regression is a machine learning ensemble algorithm that builds multiple decision trees and combines their outputs to minimize overfitting and increase accuracy. RF has been shown to perform well in identifying nonlinear relationships between NDVI and environmental drivers [21][31]. In this study, RF was used to model NDVI as a function of both temporal and climatic variables, including year, precipitation, temperature, and solar radiation.
The RF prediction is computed as the average output of N decision trees:
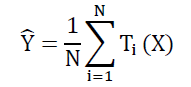
where Ti denotes the prediction of the i-th decision tree and X represents the predictor matrix. The final output ŷ corresponds to predicted NDVI. The trained RF model was used to generate NDVI projections for 2025–2030.
Long short-term memory (LSTM) modeling
LSTM is a neural network architecture used to model long-term temporal dependencies in sequential data. In contrast to other RNNs, LSTM addresses the vanishing gradient problem through the use of gated memory cells [16][32].
Model performance for ARIMA, RF and LSTM forecasting
All models were implemented in Python using Google Colab. The RF model was developed using the Scikit-learn library, while LSTM was implemented using a deep learning framework (TensorFlow/Keras). Annual NDVI values (2005–2024) extracted from MODIS MOD13Q1 were used as the primary response variable. The dataset was split into training (2005–2019) and testing (2020–2024) subsets using a temporally consistent partitioning strategy to preserve autocorrelation structures. To minimize the risk of overfitting, the RF model was configured with 200 decision trees (n_estimators = 200) and optimized using five-fold cross-validation.
In the case of LSTM, a supervised learning system was built using a three-year (36-month) look-back window to ensure that time-dependent relationships in vegetation changes are identified. ARIMA was used as a statistical control under the same set of time conditions, so that the methods could be compared. The NDVI of 2025-2030 was then predicted using all the models.
Model evaluation
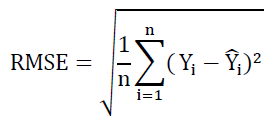
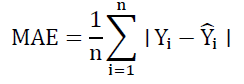
The observed and predicted NDVI values during the validation period (2020-2024) were used to assess model performance. Root Mean Square Error (RMSE) and Mean Absolute Error (MAE) were used to measure predictive accuracy and goodness-of-fit [33].
Root Mean Square Error (RMSE)
Mean Absolute Error (MAE)
RF and LSTM models were repeatedly trained on various random seeds to ensure the robustness of the models, and ARIMA was used as a deterministic baseline. Residual diagnostics were also performed to assess the model’s stability and bias structure.
Forecast visualization and export
Time-series plots were constructed to display historical NDVI (2005–2024), model predictions (2020–2024), and future predictions (2025–2030). The matplotlib and seaborn libraries were used to visualize all outputs in Python. Additional visualizations included line plots of RF and LSTM trajectories, scatter plots of observed versus predicted NDVI, and histograms of error distributions.
Results
Spatial distribution of NDVI trends and anomalies
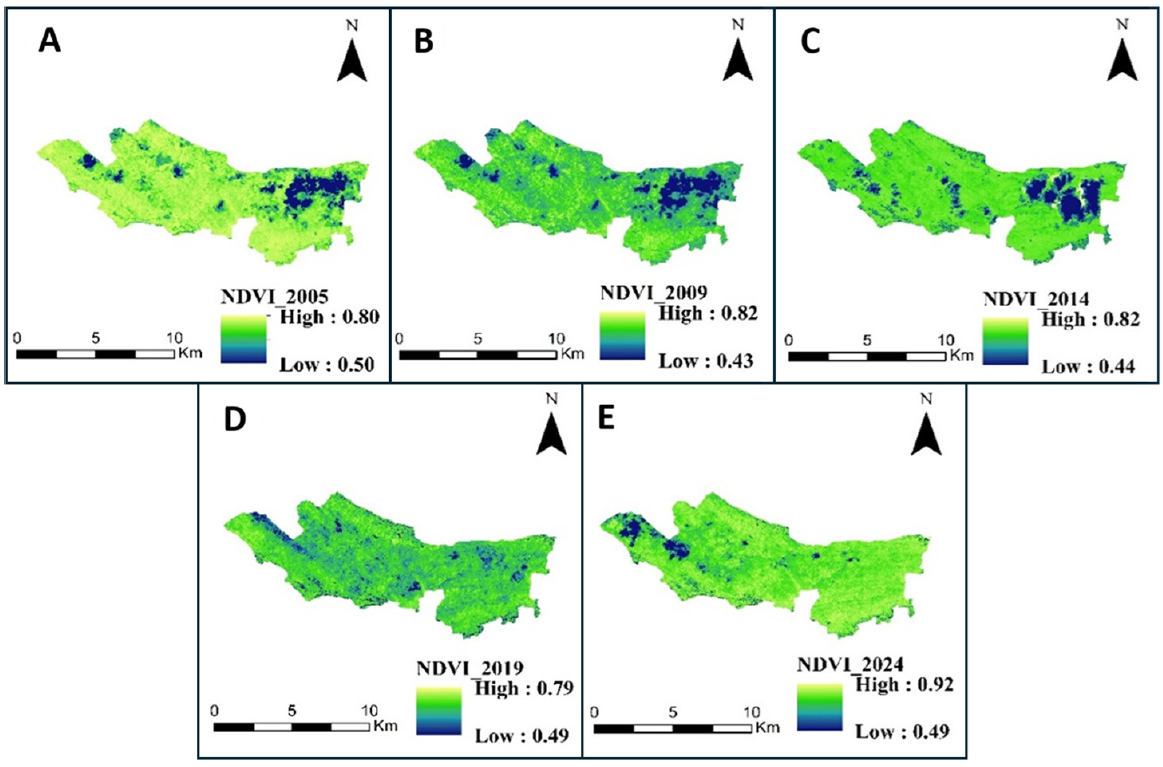
The spatial patterns of NDVI from 2005 to 2024 (Fig. 3) demonstrates that vegetation processes in the Sinharaja Rainforest are highly spatially deterministic and unevenly distributed. The NDVI values for 2005 (0.50–0.80) already show clear spatial patterns, with high values in the forest core and comparatively low values in the eastern side, suggesting that edge-related stress had already developed (Fig. 3 A).
Generally lower NDVI values were observed in 2009 across study area, with lower values in peripheral zones (NDVI = 0.43) (Fig. 3 B). This pattern of ecological stress and degradation along the northern and eastern borders diminished over the subsequent decade (2014–2024) (Fig. 3C–E), largely attributable to vegetation recovery in these areas. However, during the same period, newly degraded areas emerged in the western zones, suggesting cumulative anthropogenic impacts and shifts in hydroclimatic conditions that affect marginal stability. Overall, these findings indicate a consistent spatial asymmetry, with the forest core being highly robust and edge areas serving as long-term sites of degradation, suggesting that vegetation dynamics are more strongly controlled by space and location than by temporal change.
Temporal variation of NDVI
The temporal trajectory of NDVI (Fig. 4) shows moderate interannual variability overlaying a weak yet positive long-term trend, which means that there is a general stability in the ecology with intermittent perturbations. The average yearly NDVI values vary over a relatively small scale (0.62-0.77), which proves the high vegetation productivity that is typical of an evergreen rainforest system with a humid climate.
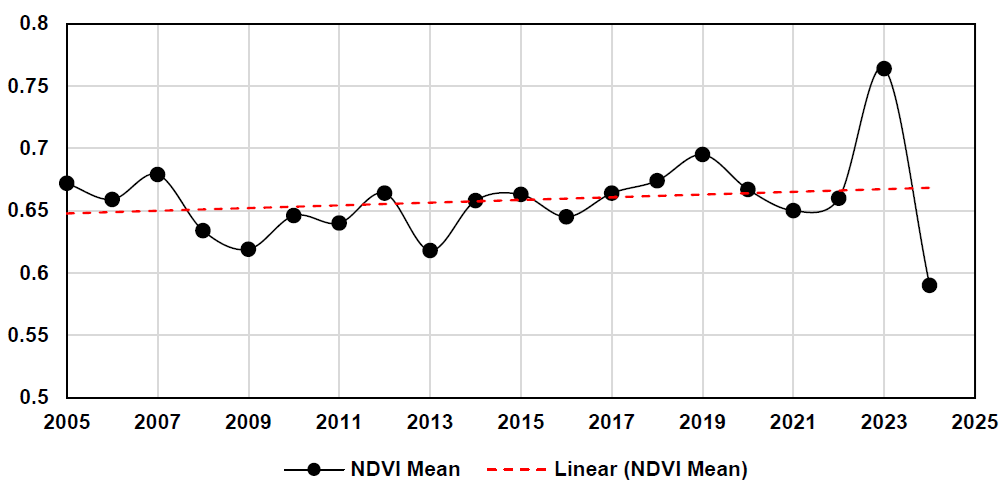
Although there are short-term swings, such as the drops in 2009-2011 and in 2024, the linear trend fitted shows a slow upward course of vegetation condition over the 20 years period. Interestingly, the steep rise in 2023 and the sudden drop in 2024 indicate a strong anomaly that could not be explained by the previous temporal pattern. This deviation suggests a process that may not reflect long-term ecological transition but rather short-term external forcing, possibly associated with climatic extremes or localized anthropogenic disturbance. Overall, the temporal signal represents a system that is broadly stable yet periodically vulnerable to exogenous shocks, indicating partial resilience rather than full equilibrium.
The decadal trend is estimated to be weakly positive (0.011) indicative of a long-term recovery signal that could be caused by a combination of conservation enforcement, natural regeneration and inherent ecosystem resilience. However, this tendency is inversed, in part, by the recent decline in 2024, which suggests that long-run gains could be vulnerable to temporary shocks. The overall temporal evidence suggests a quasi-stable state of the ecosystem with large baseline greenness, low interannual variance, and low long-term gain, but with intermittent, discrete events, which suggest a sensitivity to temporary perturbations by climatic or anthropogenic processes.
Climate drivers of NDVI variability
Climate-sensitive variability in interannual NDVI (Table 2) is a function of precipitation, which was found to be highly variable over the study period. Above-average annual precipitation is consistently associated with higher NDVI from 2005 to 2024. The more moisture available in the soil, the more productive the canopy becomes. For instance, high-precipitation years (2019: 4066.7 mm; 2023: 5294.4 mm) correspond to high NDVI values (0.695 and 0.764, respectively), indicating enhanced photosynthetic performance and canopy cover due to moisture availability. Conversely, low rainfall amounts, such as in 2016 (2740.7 mm) and 2020 (2919.3 mm), are associated with lower NDVI values, suggesting that hydrological limitation is a primary factor constraining vegetation vigor.
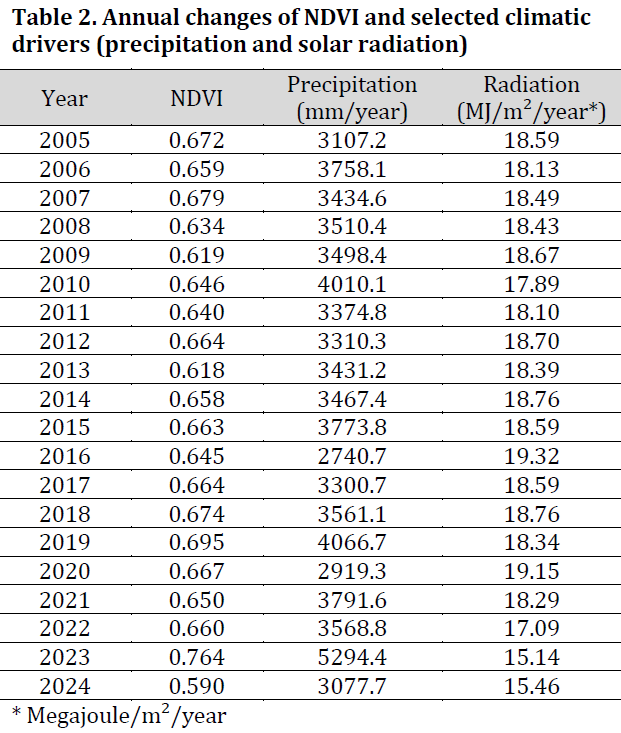
Solar radiation exhibits a weaker, nonlinear correlation with NDVI, acting as a secondary modulator rather than a major driver. High radiation is not associated with high NDVI on several occasions, particularly when moisture is limited. For instance, in 2016, radiation was among the highest recorded (nearly 19.3 MJ/m²/year), yet NDVI was moderate (0.645), indicating that additional energy input does not translate into higher productivity under water stress. Conversely, the maximum NDVI was reached in 2023, when radiation was relatively low (approximately 15.1 MJ/m²/year), highlighting the dominant role of precipitation over insolation in controlling vegetation response in this humid tropical system. In 2024, an anomalous pattern emerged: NDVI fell to 0.590, while moderate rainfall (3077.7 mm) and low radiation were recorded.
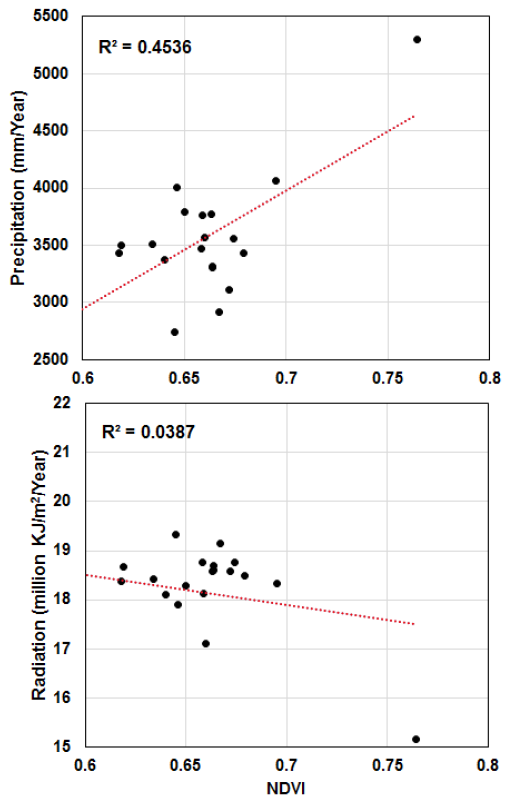
The scatterplot analysis (Fig. 5) revealed that there was a moderately positive relationship between NDVI and precipitation (R2 = 0.45). This means that canopy productivity is highly constrained by water which is in line with the fact that the rainforest is dependent on high and long rainfall regimes. However, a negligible correlation was observed between NDVI and solar radiation, indicating that radiation plays a relatively minor role in NDVI change as compared to precipitation. This low correlation with radiation may be due to the high solar irradiance typical of the tropics, where even excessive radiation is common during dry seasons, yet light is never a limiting constraint.
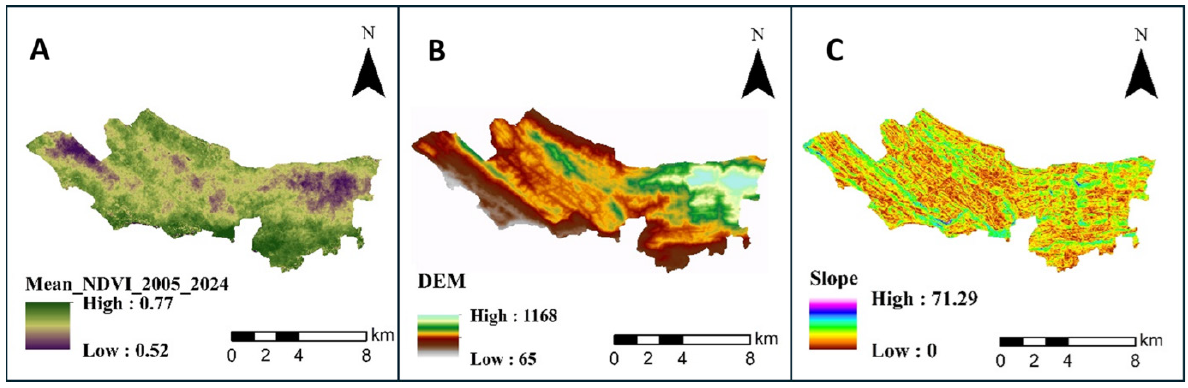
The NDVI distribution in Sinharaja is strongly influenced by topography (Fig. 6). The altitude ranges from 65 to 1,168 m (mean = 560 m, SD = 189 m), indicating that the altitude is strongly graded and that vegetation is organized around this gradient. Mid-elevation areas have a relatively high NDVI, indicating better hydro-climatic conditions and less anthropogenic interference compared to low-elevation areas, which display low NDVI in line with significant edge effects and intense human influence. The northeastern rugged mountainous areas demonstrate persistently low NDVI values, which are attributed to their high elevation and adverse environmental conditions. Slope ranges from 0 to 71 (mean = 17.9, SD = 8.65) with a notable negative correlation between steepness and NDVI. Steeper slopes are associated with lower vegetation vigor due to decreased soil depth, water runoff, and water retention, whereas gentler slopes and valley floors have higher NDVI due to increased soil accretion and water supply. These observations support the fact that topographic variability serves as an important structural limit to vegetation productivity, which mediates the effects of climatic factors especially rainfall by redistributing hydrology and balancing soil moisture within the landscape.
NDVI forecasts and model behavior
Divergent NDVI forecasts for the 2025–2030 interval were generated by RF and LSTM models. The respective strengths and weaknesses of both methodologies are underscored by these outcomes (Fig. 7). Substantial volatility was demonstrated by RF projections. A minimum NDVI value of 0.646 emerged in 2027, while a maximum of 0.687 was reached in 2026. By the year 2030, the metric approached 0.674. This cyclical pattern indicates that although the RF algorithm resists overfitting when applied to limited datasets, an inherent vulnerability to interannual noise persists. Consequently, its efficacy in formulating stable, long-term temporal projections is compromised.
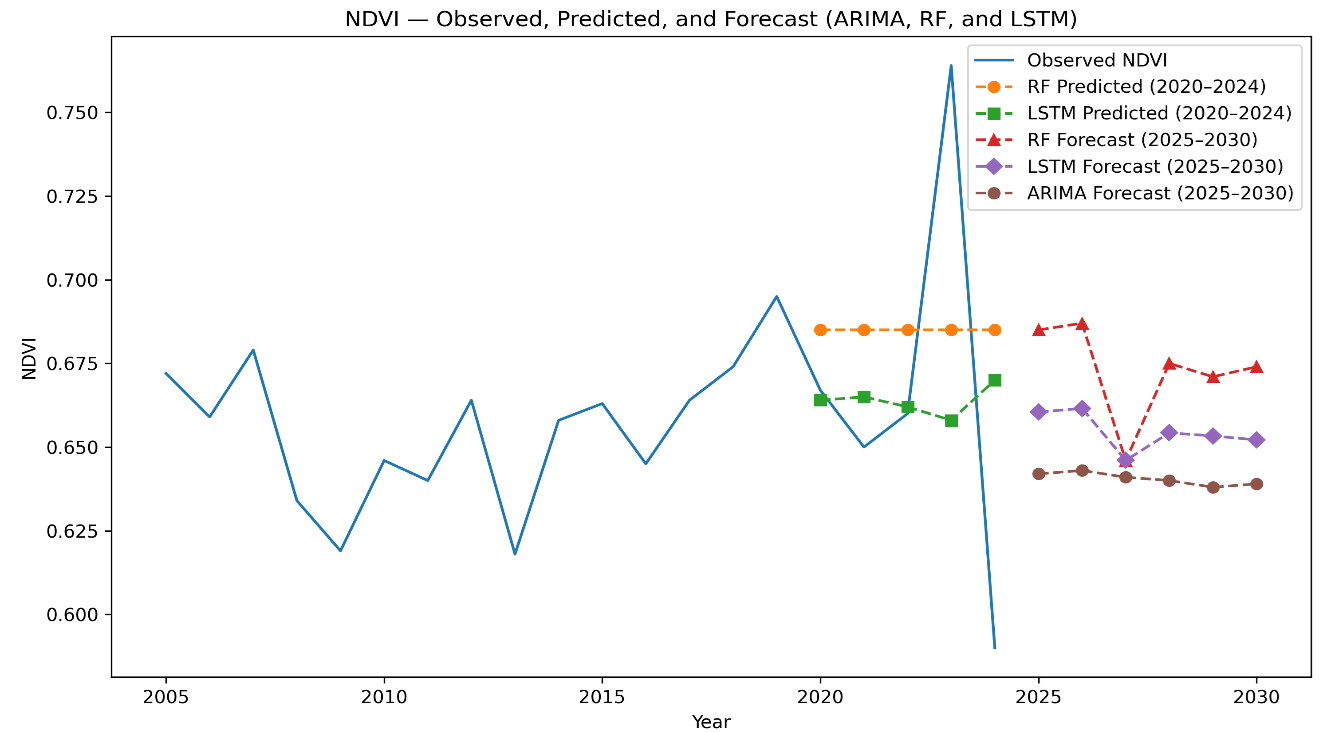
Conversely, more seasonally stable and smoother outputs were delivered by the LSTM framework. The predictions were characterized by nearly constant NDVI values, declining only slightly from 0.660 in 2025 to 0.652 by 2030. The capacity of the LSTM network to assimilate long-term, sequence-level dependencies from time-series data is evidenced by this steady decline. Nevertheless, a diminished responsiveness to abrupt ecological shifts and short-term variability was noted when contrasted with the RF model. This resulted in forecasts that prioritize temporal stability over dynamic responsiveness.
A conservative, smooth downward trajectory was calculated by the ARIMA model. Forecasted NDVI figures diminished slightly from 0.642 in 2025 to 0.639 in 2030 under this approach. Inferior precision and weak interannual correlation were displayed by the ARIMA projections relative to the RF and even LSTM outputs. A heavy reliance on linear temporal persistence and a fundamental inability to model nonlinear vegetation dynamics are indicated by these results. While this constraint severely limits the detection of transient ecological events, a reliable statistical baseline for evaluating long-term NDVI trends is ultimately established by the ARIMA model.
Similar predictive capabilities were achieved by both RF and LSTM throughout the validation phase. The LSTM algorithm yielded an RMSE of 0.061, which closely matched the RF RMSE value (0.059) (Table 3). A 1:1 relationship was visually supported by the NDVI scatter plots (Fig. 8). Furthermore, closer alignment with actual NDVI measurements was indicated by the lower MAE scores produced by LSTM. A wider spectrum of fluctuations and extreme states was successfully identified by the RF framework. Conversely, average tendencies and uniform outputs were more frequently generated by the LSTM architecture. Equivalent forecasting potential is suggested by these findings, despite distinct operational characteristics between the approaches. Substantial year-to-year shifts and severe anomalies were effectively mapped by RF. Meanwhile, tighter congruence with empirical NDVI records was achieved through the uniform projections of LSTM.
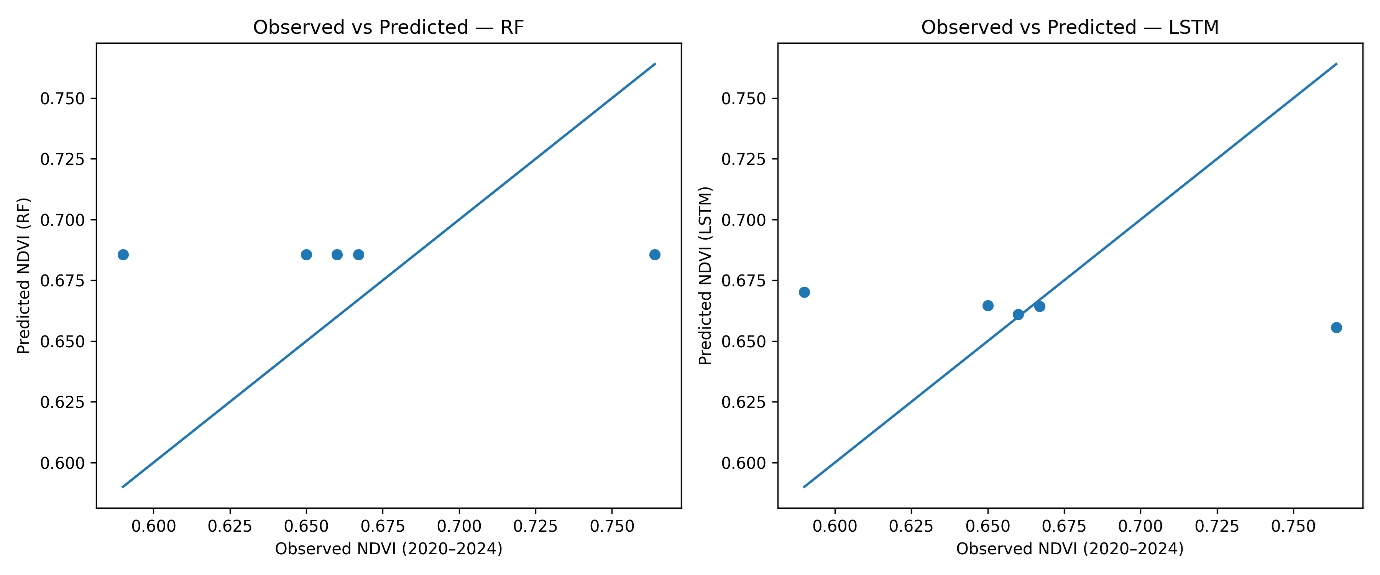
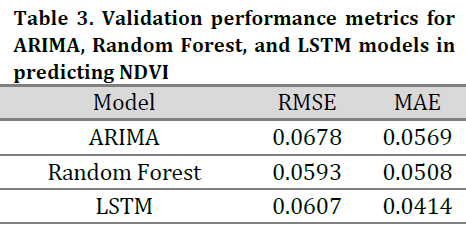
The data from the validation timeframe (2020–2024) were forecasted with moderate variations by the ARIMA, RF, and LSTM models. Similar prediction errors for both frameworks were indicated by the Root Mean Square Error (RMSE) metrics. Specifically, slightly lower overall deviations were achieved by the RF architecture (0.0592) compared to LSTM (0.0607). Conversely, a tighter alignment with the actual NDVI measurements was attained by LSTM. This algorithm generated a lower Mean Absolute Error (MAE=0.0414) than RF (MAE=0.0508). Comparable general outcomes are ultimately suggested by these findings. A wider range of variance and sudden shifts were successfully mapped by RF. Meanwhile, steadier projections and tighter graphical congruence with recorded NDVI figures in the validation scatter plots were yielded by the LSTM approach.
As for ARIMA, elevated RMSE (0.0678) and MAE (0.0569) scores were obtained relative to the alternative techniques. The extended average NDVI baselines were tracked more closely by the ARIMA projections. Consequently, flatter trajectories and diminished responsiveness to NDVI shifts were produced by this framework. Complex and non-linear climatic and ecological mechanisms are evidently driving the NDVI dynamics within the Sinharaja Rainforest. Furthermore, these intricate natural systems cannot be entirely captured by short-duration predictive algorithms. Nevertheless, a reasonably accurate depiction of the NDVI fluctuations was delivered by the RF and LSTM architectures. A more reliable modeling of chronological changes and environmental synergies was achieved by these two systems when contrasted with ARIMA.
Discussion
A consistently elevated baseline of canopy greenness defines the long-term (2005–2024) NDVI trajectory within the Sinharaja Rainforest. The structural integrity of this lowland tropical evergreen environment is clearly indicated by this pattern. Intact rainforest conditions are reflected by the average NDVI metric (0.658) [34]. Such environments typically display uninterrupted photosynthetic functions and closed-canopy phenology. Significant year-to-year fluctuations are contained within the time series, regardless of this overarching steadiness. Shifts in vegetation productivity are clearly driven by hydroclimatic forcing, especially precipitation anomalies. Consequently, the long-term responsiveness of the canopy and tropical forest carbon uptake to moisture access is amplified. This heightened sensitivity occurs even when alterations in land-use remain minimal [35].
A sustained spatial core–edge dichotomy is uncovered by the NDVI distributions. Elevated and steady NDVI metrics, alongside minimal temporal shifts, are displayed by the interior forest zones. Conversely, repeated degradations during climatic stress are experienced by the peripheral tracts. This spatial heterogeneity is generated by edge effects linked to fragmentation, microclimatic exposure, and human impacts across buffer landscapes [36]. Spatially uneven ecosystem resilience throughout Sinharaja is suggested by these trajectories. A stable biophysical reservoir is maintained by the core areas. Meanwhile, the boundaries operate as transitional zones that suffer greater vulnerability to outside disturbances.
A marginal positive long-term shift of +0.011 per decade for NDVI is further exposed through temporal assessments. Slight greening throughout the investigation timeframe is implied by this increase. However, this trajectory is dwarfed by the year-to-year volatility. Therefore, it cannot be classified as a definitive ecological recovery. Instead, oscillating mechanisms confined within a restricted stability threshold are signified. Such bounded dynamics are typical of mature tropical rainforests. Furthermore, temporary drops (such as that of 2024) are primarily triggered by episodic stressors rather than fundamental structural deterioration. These transient pressures include weather extremes or potential sensor irregularities. Consequently, a quasi-static nature interrupted by periodic disturbances characterizes the time series behavior, rather than a strictly directional evolution.
Substantial discrepancies in forecasting accuracy across diverse methodological frameworks are highlighted by the model-based evaluations. Nonlinear connections between NDVI and environmental variables are mapped much more accurately by the RF approach. This is particularly true for temperature fluctuations and precipitation shifts. Yet, restricted absolute predictive power is denoted by the RMSE and MAE metrics, given the minimal NDVI variance throughout the research. Sparse data, aggregation techniques, and absent ecological drivers evidently constrain the overall model fit. The LSTM architecture possesses theoretical adequacy for sequential dependency learning [37]. Nevertheless, inadequate performance was similarly produced by this framework. This shortfall is likely driven by the brief historical record (2005–2024) and annual grouping strategies. The available sample size necessary for deep learning generalization is severely limited by these factors. Finally, the poorest outcomes were generated by ARIMA. The inherent structural incapacity of this model to identify nonlinear biological interactions and external volatility is reflected here.
A relatively stable NDVI trajectory, accompanied by a marginal downward inclination amidst heightened volatility, is forecasted for the 2025–2030 period. Substantial epistemic uncertainty is nonetheless indicated by the divergence across the different modeling outputs. The inherent unreliability of deterministic estimates for intricate tropical habitats is emphasized by this variance. Statistical constraints are merely one source of this unpredictability. Inadequate modeling of fundamental ecological mechanisms also contributes heavily to the problem. These missing elements encompass microclimatic heterogeneity, historical disturbances, and specific species compositions.
Crucial environmental insights for conceptualizing the Sinharaja biome as a dual-structured entity are carried by these findings. Robust structural health is maintained by the forest core, matching the characteristics of untouched tropical evergreen networks. Simultaneously, heightened susceptibility to climatic shifts and human interference is suffered by the peripheral zones. The necessity for scale-sensitive tracking frameworks is underscored by this spatial dichotomy. Localized degradation events along the habitat borders can easily be masked by aggregated NDVI measurements. Therefore, edge-zone surveillance must be prioritized by conservation initiatives to serve as a proactive warning mechanism. Reliance on generalized forest-wide averages should be abandoned.
From a methodological standpoint, severe constraints in brief-horizon ecological predictions utilizing grouped satellite data are exposed by the weak forecasting capacity across all algorithms. Statistical correlations are effectively depicted by data-driven frameworks. However, the fundamental process-based drivers responsible for ecosystem shifts are often unresolved by these tools. The requirement for hybrid modeling architectures is highlighted by this limitation. Mechanistic biological insights must be merged with machine learning approaches. Such integration is especially critical within biodiverse tropical rainforests, where observational barriers continue to pose major hurdles [38]. Ultimately, sustained structural permanence in canopy greenness is demonstrated by the Sinharaja Rainforest. Despite this, a resilient but dynamically responsive environment is reflected by the persistent year-to-year fluctuations, spatial unevenness, and elevated forecasting ambiguity. The necessity for uncertainty-aware prediction tools is strongly affirmed by these discoveries. Furthermore, assuming brief periods of NDVI stagnation equal total stability during tropical forest management and policy development should be carefully avoided.
Conclusion
A multi-model comparison of NDVI dynamics within the Sinharaja Rainforest (2005–2024) is presented in this study. This evaluation utilizes NDVI data obtained via MODIS alongside primary climatic and topographical drivers. A stable, high-biomass tropical evergreen system is indicated by the consistently elevated vegetation greenness revealed in the results. Nevertheless, precipitation variability predominantly drives the intense interannual fluctuations that disrupt this baseline. The NDVI signal remains largely dominated by episodic disturbances, even with a sustained positive trend. Robust validation accuracy was demonstrated during the model intercomparison. Yet, the intricate nonlinear and temporal structure was not adequately captured by any of the tested frameworks. A relatively stable to marginally downward NDVI trend for the 2025–2030 window is indicated by the converging projections. Furthermore, substantial uncertainty accompanies these future estimates. Several primary limitations inherently reduce the overall predictive strength. Specifically, these constraints involve NDVI saturation within dense evergreen cover, inadequate temporal depth for deep learning, and absent fine-scale ecological and hydrological process variables. Higher-resolution sensors (e.g., Sentinel-2) and multi-source environmental data fusion should be prioritized by upcoming investigations. Additionally, hybrid or physics-informed machine learning models must be developed to better address nonlinear dynamics and extreme events. Ultimately, a transition toward uncertainty-based and volatility-based monitoring is supported by these outcomes. Such an approach will yield a more dependable evaluation of tropical forest resilience.
Conflict of interest statement
The authors declared no conflict of interest.
Funding statement
The authors declared that no funding was received in relation to this manuscript.
Data availability statement
The authors stated that all sources of data are mentioned in the text, and the used datasets will be made available upon reasonable request to the corresponding author.
References
- Brandon K. Ecosystem services from tropical forests: review of current science. Center for Global Development Working Paper. 2014(380). DOI
- Swamy L, Drazen E, Johnson WR, Bukoski JJ. The future of tropical forests under the United Nations Sustainable Development Goals. J. Sustain. For. 2017;37(2):221-56. DOI
- Borma LS, Costa MH, da Rocha HR, Arieira J, Nascimento NCC, Jaramillo‐Giraldo C, Ambrosio G, Carneiro RG, Venzon M, Neto AF. Beyond Carbon: The Contributions of South American Tropical Humid and Subhumid Forests to Ecosystem Services. Rev. Geophys. 2022;60(4):e2021RG000766. DOI
- Ranwala SMW. Threats and Conservation of Biodiversity in Sri Lanka. In: Biodiversity Hotspot of the Western Ghats and Sri Lanka. Apple Academic Press. 2023. DOI
- Gunatilleke CS, Gunatilleke IA. A forestry case study of the Sinharaja rainforest in Sri Lanka. In: Forest and watershed development and conservation in Asia and the Pacific. Routledge. 2019:289-358.
- Madurapperuma BD, Kuruppuarachchi KA. Detecting Land-Cover Change using Mappable Vegetation Related Indices: A Case Study from the Sinharaja Man and Biosphere Reserve. J. Trop. For. Environ. 2014;4(1):50-8. DOI
- Pettorelli N. Vegetation indices. In: The Normalized Difference Vegetation Index. Oxford University Press. 2013. DOI
- Zahir ILM, Nuskiya MHF, Sangasumana VP, Iyoob AL, Ameer MLF. Monitoring Urban Green Space Using Remote Sensing Derived-vegetation Indices in Colombo District, Sri Lanka. Procedia Comput. Sci. 2024;236:248-56. DOI
- Fensholt R, Proud SR. Evaluation of Earth Observation based global long term vegetation trends — Comparing GIMMS and MODIS global NDVI time series. Remote Sens. Environ. 2012;119:131-47. DOI
- Lambert J, Drenou C, Denux J, Balent G, Cheret V. Monitoring forest decline through remote sensing time series analysis. GISci. Remote Sens. 2013;50(4):437-57. DOI
- Eckert S, Hüsler F, Liniger H, Hodel E. Trend analysis of MODIS NDVI time series for detecting land degradation and regeneration in Mongolia. J. Arid. Environ. 2015;113:16-28. DOI
- Moormann F, Köhl M. Using random forests and dendroclimatology to reveal climatic factors in tree growth – case studies from temperate and tropical regions. Trees. 2026;40(1):15. DOI
- Lamjiak T, Kaewthongrach R, Sirinaovakul B, Hanpattanakit P, Chithaisong A, Polvichai J. Characterizing and forecasting the responses of tropical forest leaf phenology to El Nino by machine learning algorithms. PLoS ONE. 2021;16(8):e0255962. DOI
- Jahanbani M, Vahidnia MH, Aghamohammadi H, Azizi Z. Flood susceptibility mapping through geoinformatics and ensemble learning methods, with an emphasis on the AdaBoost-Decision Tree algorithm, in Mazandaran, Iran. Earth Sci. Inform. 2024;17(2):1433-57. DOI
- Khan RWA, Shaheen H, Islam Dar MEU, Habib T, Manzoor M, Gillani SW, Al-Andal A, Ayoola JO, Waheed M. A data-driven approach to forest health assessment through multivariate analysis and machine learning techniques. BMC Plant Biol. 2025;25(1):915. DOI
- Reddy DS, Prasad PRC. Prediction of vegetation dynamics using NDVI time series data and LSTM. Model. Earth Syst. Environ. 2018;4(1):409-19. DOI
- Gao P, Du W, Lei Q, Li J, Zhang S, Li N. NDVI Forecasting Model Based on the Combination of Time Series Decomposition and CNN – LSTM. Water Resour. Manag. 2023;37(4):1481-97. DOI
- Robin C, Requena-Mesa C, Benson V, Alonso L, Poehls J, Carvalhais N, Reichstein M. Learning to forecast vegetation greenness at fine resolution over Africa with ConvLSTMs. arXiv preprint arXiv. 2022:2210.13648. DOI
- Nay J, Burchfield E, Gilligan J. A machine-learning approach to forecasting remotely sensed vegetation health. Int. J. Remote Sens. 2017;39(6):1800-16. DOI
- Liu F, Liu J, Chen W. Stl-bilstm-based segmental prediction model for wheat ndvi. In: 2024 4th International Conference on Computer Communication and Artificial Intelligence (CCAI). IEEE. 2024:405-10. DOI
- Liu Y, Wang Y, Zhang J. New Machine Learning Algorithm: Random Forest. In: Lecture Notes in Computer Science. Springer Berlin Heidelberg. 2012. DOI
- Samarasinghe JT, Gunathilake MB, Makubura RK, Arachchi S, Rathnayake U. Impact of climate change and variability on spatiotemporal variation of forest cover; world heritage Sinharaja Rainforest, Sri Lanka. For. Soc. 2022;6(1):355-77. DOI
- Malhi Y, Gardner TA, Goldsmith GR, Silman MR, Zelazowski P. Tropical Forests in the Anthropocene. Annu. Rev. Environ. Resour. 2014;39(1):125-59. DOI
- Woodbury DJ, Jayawickrama H, Martin MP, Ediriweera S, Ashton MS. Land tenure and human disturbance influence the current distribution of aboveground biomass in Sri Lankan rainforest fragments. For. Ecol. Manag. 2024;572:122285. DOI
- Saim AA, Aly MH. Fusion-Based Approaches and Machine Learning Algorithms for Forest Monitoring: A Systematic Review. Wild. 2025;2(1):7. DOI
- Grogan K, Fensholt R. Exploring Patterns and Effects of Aerosol Quantity Flag Anomalies in MODIS Surface Reflectance Products in the Tropics. Remote Sens. 2013;5(7):3495-515. DOI
- Roy DP, Borak JS, Devadiga S, Wolfe RE, Zheng M, Descloitres J. The MODIS Land product quality assessment approach. Remote Sens. Environ. 2002;83(1-2):62-76. DOI
- Hird JN, McDermid GJ. Noise reduction of NDVI time series: An empirical comparison of selected techniques. Remote Sens. Environ. 2009;113(1):248-58. DOI
- Shumway RH, Stoffer DS. ARIMA Models. In: Springer Texts in Statistics. Springer International Publishing. 2017. DOI
- Newbold P. ARIMA model building and the time series analysis approach to forecasting. J. Forecast. 1983;2(1):23-35. DOI
- Belgiu M, Drăguţ L. Random forest in remote sensing: A review of applications and future directions. ISPRS J. Photogramm. Remote Sens. 2016;114:24-31. DOI
- Wen X, Li W. Time Series Prediction Based on LSTM-Attention-LSTM Model. IEEE Access. 2023;11:48322-31. DOI
- Chai T, Draxler RR. Root mean square error (RMSE) or mean absolute error (MAE)? – Arguments against avoiding RMSE in the literature. Geosci. Model Dev. 2014;7(3):1247-50. DOI
- Bhandari A, Kumar A, Singh G. Feature Extraction using Normalized Difference Vegetation Index (NDVI): A Case Study of Jabalpur City. Procedia Technol. 2012;6:612-21. DOI
- Guan K, Pan M, Li H, Wolf A, Wu J, Medvigy D, Caylor KK, Sheffield J, Wood EF, Malhi Y. Photosynthetic seasonality of global tropical forests constrained by hydroclimate. Nat. Geosci. 2015;8(4):284-9. DOI
- Haddad NM, Brudvig LA, Clobert J, Davies KF, Gonzalez A, Holt RD, Lovejoy TE, Sexton JO, Austin MP, Collins CD. Habitat fragmentation and its lasting impact on Earth’s ecosystems. Sci. Adv. 2015;1(2):e1500052. DOI
- Greff K, Srivastava RK, Koutnik J, Steunebrink BR, Schmidhuber J. LSTM: A Search Space Odyssey. IEEE Trans. Neural Netw. Learn. Syst. 2017;28(10):2222-32. DOI
- Schmitt S, Fischer FJ, Ball JGC, Barbier N, Boisseaux M, Bonal D, Burban B, Chen X, Derroire G, Lichstein JW. TROLL 4.0: representing water and carbon fluxes, leaf phenology, and intraspecific trait variation in a mixed-species individual-based forest dynamics model – Part 2: Model evaluation for two Amazonian sites. Geosci. Model Dev. 2025;18(16):5205-43. DOI
Cite this article:
Nuskiya MHF, Sathyaseelan S, Nasar-u-Minallah M. Stable but stressed: Investigating vegetation dynamics in the Sinharaja Rainforest using satellite NDVI and climate-driven machine learning models. DYSONA-Applied Science. 2026;7(2):313-327. doi: 10.30493/das.2026.012706