Md Alamgir Hossin 1; Akramul Haque 1; Ovi Ranjan Saha 2*; Rabiul Islam 1; Tanzina Islam Shimin 3
1, Institute of Water and Environment (IWE), Dhaka University of Engineering and Technology (DUET), Gazipur-1707, Bangladesh
2, Department of Water Resources Engineering, Bangladesh University of Engineering and Technology (BUET), Dhaka-1000, Bangladesh
3, Chauddagram Government College (Ministry of Education), Chauddagram, Bangladesh
E-mail:
ovi@wre.buet.ac.bd
Received: 17/01/2025
Acceptance: 19/05/2025
Available Online: 20/05/2025
Published: 01/07/2025

Manuscript link
http://dx.doi.org/10.30493/DAS.2025.500496
Abstract
Air pollution constitutes a significant environmental hazard to urban sustainability and public health. The COVID-19 outbreak provided a significant opportunity to highlight the influence of human activities on air quality. This research employed TROPOMI-derived data on nitrogen dioxide (NO2), sulfur dioxide (SO2), and carbon monoxide (CO), in conjunction with MODIS-derived aerosol optical depth (AOD), to examine the spatiotemporal patterns in Dhaka Division from March to June in the years 2020, 2021, and 2022, encompassing the initial COVID-19 wave and the ensuing lockdown. The results indicated a significant rise in NO2, SO2, and CO concentrations in 2021 and 2022 relative to 2020, underscoring a troubling upward trend in air pollutant levels. Carbon monoxide (CO) concentrations demonstrated a notable rise, surpassing 2020 values by 6.08% in 2021 and 5.52% in 2022. Nitrogen dioxide (NO2) showed a significant increase of 37.3% in 2021 and 20.6% in 2022. Likewise, sulfur dioxide (SO2) concentrations exceeded 2020 values by 52% in 2021 and 297% in 2022. Moreover, it was noted that air pollution displayed significant connections with meteorological variables, including temperature and precipitation. These observations clearly indicate an urgent necessity for more stringent environmental legislation and the establishment of effective pollution control measures. The satellite-based spatiotemporal analysis conducted by Google Earth Engine (GEE) offers significant insights for policymakers, environmental agencies, and researchers, thereby supporting evidence-based decision-making.
Keywords: COVID-19, Air quality, Air pollutants, GEE, Dhaka
Introduction
Air pollution is a growing environmental issue [1][2] especially in developing nations where rapid industrialization, urbanization, and fossil fuel use significantly degrade air quality. Among air pollutants, Nitrogen dioxide (NO₂), sulfur dioxide (SO₂), carbon monoxide (CO), ozone (O₃), and particulate matter (PM2.5 and PM10) pose serious threats to human health, ecosystems, and climate change [3][4]. Vehicle emissions, industrial activities, and energy generation are the main contributors to air pollution in crowded cities, which therefore escalate the risk of respiratory diseases, heart problems, and environmental degradation [5].
Long-standing industrial emissions, traffic congestion, and energy-intensive activities have all contributed to Dhaka becoming one of the most polluted cities in the world. Conversely, by halting many human activities, the COVID-19 epidemic offered a special chance to evaluate air quality dynamics. Early 2020 global lockdowns resulted in notable drops in air pollutants as travel greatly declined and businesses closed [6]. Few studies have examined these short-term air quality fluctuations even if post-pandemic data indicate a return in emissions as economic activity resumed.
Though other studies have examined air pollution changes during the epidemic, few have assessed changes in Bangladesh using high-resolution satellite-based analysis. Google Earth Engine (GEE), a cloud-based geospatial analytic tool, allows quick processing of large-scale remote sensing data, hence enabling an in-depth study of pollution trends. Using GEE, this paper investigates NO₂, SO₂, CO, and aerosol optical depth (AOD) levels in the Greater Dhaka Division from March to June over 2020, 2021, and 2022. For that purpose, high-resolution satellite data will be utilized to locate spatial hotspots and highlight pollution trends, therefore offering insights on how air quality changed as human activity commenced again post-lockdown. The study also investigates how air pollutants are influenced by climatic factors such temperature and rain, so offering a more complete picture of the components influencing air quality. The findings will highlight the potential of remote sensing and cloud computing technologies for large-scale environmental monitoring and assist lawmakers in developing effective air pollution control strategies.
Material and Methods
Study area
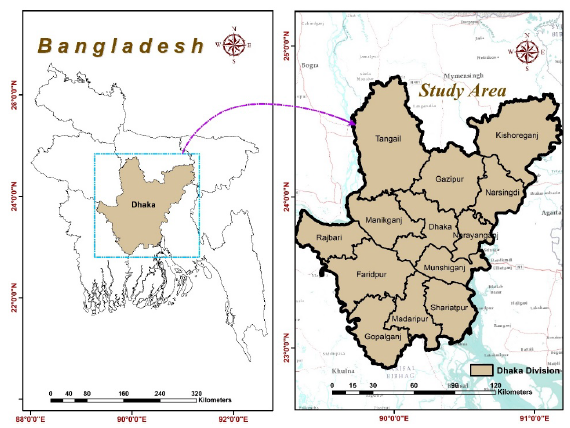
Dhaka Division is the most densely populated region in Bangladesh. Situated at the center of Bangladesh, Dhaka Division hosts the capital and the world’s fourth most populous city, along with key industrial and economic hubs (Gazipur, Narayanganj, Norshingdi, Manikganj, and Tangail) (Fig. 1). Coal-burning electric utilities represent the prime responsible for SO2 emissions. The division is known for its cement production, petroleum refining, paper pulp manufacturing, metal smelting, and processing facilities, all of which predominantly depend on coal and burning wood as the primary fuel source. This reliance notably contributes to air pollution in the region [7]. Additionally, heavy-duty vehicles, predominantly powered by high-sulfur diesel fuel, are prevalent on Dhaka’s roads. Consequently, motor vehicles and brick kilns emerge as prominent sources of particulate air pollution, including black carbon emissions, within the Dhaka region [8]. Vehicles account for 40.5% of carbon monoxide (CO) emissions in Greater Dhaka, followed by fossil fuel combustion at 27.1%, and industrial emissions at 16.4% [9]. The combustion of fossil fuels, particularly gasoline in vehicles, along with various industrial processes such as nitric acid production, welding, and petroleum refining, constitutes the primary source of nitrogen dioxide (NO2) emissions [10].
Data collection
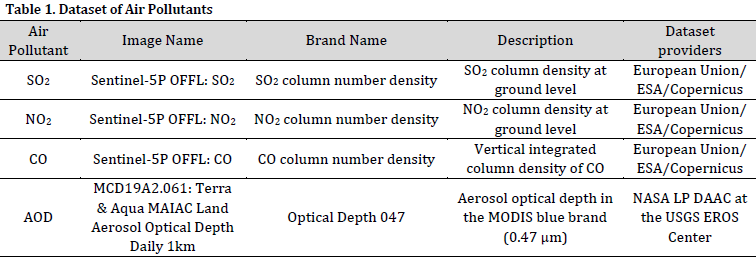
This study utilizes satellite-derived air pollution datasets obtained from Sentinel-5P/TROPOMI and MODIS through Google Earth Engine (GEE). The datasets include nitrogen dioxide (NO₂), sulfur dioxide (SO₂), carbon monoxide (CO), and aerosol optical depth (AOD). Land surface temperature (LST) data were acquired from MOD11A2 dataset, while rainfall data were obtained from CHIRPS Pentad dataset. Table 1 provides a comprehensive list of data collections, including brief details of the data sources, such as the name of the data provider institute.
Since Sentinel-5P provides pollutant concentrations in mol/m², direct comparisons with ground-based air quality standards (e.g., µg/m³) require conversion using atmospheric scaling factors. However, this study focuses on relative changes in pollutant levels over time rather than absolute concentrations, making mol/m² appropriate for trend analysis [11][12].
Satellite data processing
Sentinel-5 satellite data were employed through Google Earth Engine to examine the levels of air pollutants in Dhaka during various periods in 2020 (during COVID-19), 2021, and 2022 (post-COVID-19). Launched by the European Space Agency (ESA) on October 13, 2017, the Sentinel-5P satellite conducts daily environmental monitoring and analysis of air pollutants worldwide, utilizing the TROPOMI sensor to track atmospheric gases such as NO2, CO, SO2, O3, formaldehyde (CH₂O), methane (CH4), and aerosols [13]. The bulk of the data was acquired through the Google Earth Engine platform using its proprietary JavaScript API, thereby overcoming the limitations of traditional data analysis methods and revolutionizing the extraction of valuable insights from extensive remote sensing datasets, with Google Earth Engine (GEE) serving as an essential tool across a diverse array of applications including land use and land cover analysis, agricultural monitoring, hydrological modeling, environmental disaster assessment, and various other geospatial tasks [14]. The units for gas products (NO2, SO2, CO) were calculated as mol/m2, with minimum and maximum limits specified, followed by the presentation of brand names in the column labeled “number density,” while the units for aerosol optical depth (AOD) were represented in µg/m³. The MOD11A2 version 6.2 datasets was the source of temperature data for the Greater Dhaka region, offering 8-day average land surface temperature and emissivity (LST&E) measurements for each pixel with a spatial resolution of 1 kilometer. Typically represented in Kelvin, with a minimum scale of 7500 and a maximum of 65535. Consequently, temperature values were converted to Celsius. Additionally, the CHIRPS Pentad dataset, which amalgamates satellite-based precipitation estimates with station data, was utilized to derive average precipitation data for any given region in millimeters.
Analysis technique
This study focuses on the analysis of SO2, NO2, and CO levels from March to June of 2020, 2021, and 2022. Time series data for each product facilitated the acquisition of relevant data to analyze air quality conditions during the study period. Temperature, air pollutant density (AOD), and rainfall data were also analyzed during the same period to investigate correlation between these factors [15]. For that purpose, two-tailed Pearson correlation was utilized.
The framework of this research
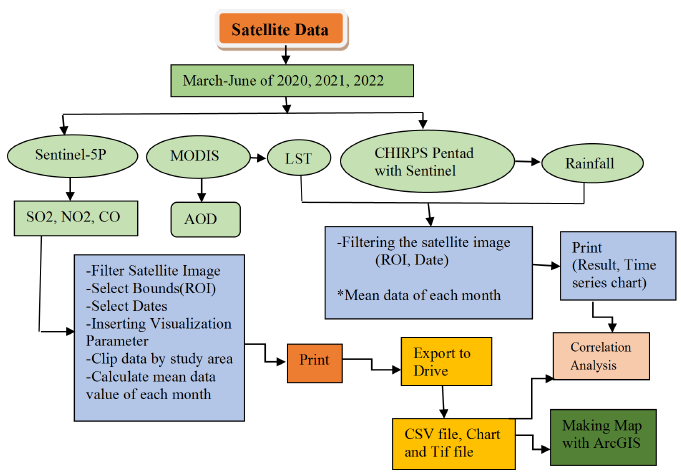
To analyze air quality across the Greater Dhaka division, various datasets were selected and processed using Google Earth Engine, which enabled data extraction, visualization, and manipulation (Fig. 2). Open-source satellite imagery data has emerged as a valuable resource for researchers and individuals interested in mapping and geographic information, offering extensivecoverage and increasingly higher resolution, thus serving as a largely untapped source for scientific research. This accessibility has fostered a vibrant community of map enthusiasts and researchers [16]. SO2, NO2, CO, and AOD satellite data from March to June in the years 2020, 2021, and 2022 were analyzed. MODIS land cover data were utilized to assess the spatial resolution of air parameter data obtained from Sentinel-5P/TROPOMI. Programming in the GEE code editor involved using the built-in JavaScript API, alongside HTML and CSS, which are fundamental to the World Wide Web. Filter arrays were employed to selectively display and manage data, with JavaScript filter array functions enabling image filtering based on predefined criteria. The coding process was conducted within the scripts feature of the code editor, with the Assets feature facilitating the importation of shapefiles and other documents for analysis. Bangladesh’s vector data, downloaded from DIVA-GIS, was imported for analysis in GEE using the Java API. Time series of Land Surface Temperature (LST) and Aerosol Optical Depth (AOD) were evaluated and analyzed from MODIS data. The region of interest and study period were filtered to export CSV files, with rainfall data obtained from CHIRPS Pentad using the built-in Java API.
Validation of satellite data
Due to the lack of extensive ground-based air monitoring stations in Dhaka, satellite data were not directly validated with in-situ observations. However, previous studies have demonstrated that TROPOMI-derived NO₂, SO₂, and CO show high agreement (R² > 0.80) with ground-based measurements in urban settings [17][18].
Result and Discussion
Assessment of air pollutants and meteorological variables
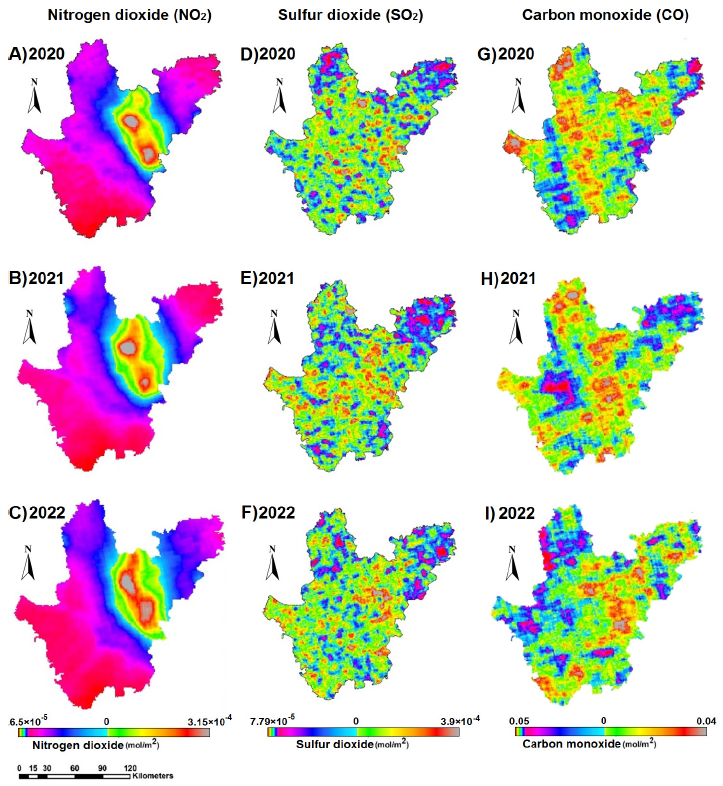
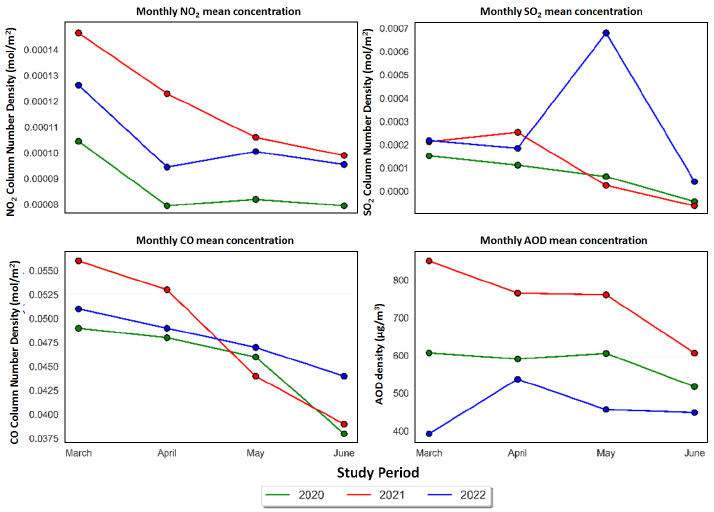
Nitrogen Dioxide (NO2) is a highly reactive air pollutant which experiences drastic fluctuations influenced by vehicular emissions, industrial activities, and weather patterns. The implementation of lockdown measures in Bangladesh starting from March 24 2020 [15], resulted in a significant reduction in NO2 emissions due to reduced human activities. Therefore, the restrictions implemented on travel and industrial operations led to reduced NO2 levels (Fig. 3 A). However, following the lifting of lockdown measures (2021 and 2022), there was a notable increase in NO2 concentrations, particularly evident in greater Dhaka (Fig. 3 B and C). A comparison of NO2 levels during the full lockdown period of 2020 with subsequent years revealed a considerable rise, with an increase of 37.3% in 2021 and 20.6% in 2022 (Fig. 4)
Detailed assessment of spatiotemporal fluctuations in yearly SO2 concentrations showed a notable increase in 2021 and 2022 (Fig. 3 D-F), rising by 52% in 2021 and a staggering 297% in 2022 (particularly in May) compared to levels observed in 2020 (during lockdown) (Fig. 4). Sulfur dioxide (SO2) can be present naturally due to volcanic activity; however, it is also considered a significant pollutant stemming from various industrial processes. Notably coal combustion containing sulfur compounds and the burning of fossil fuels are the main sources of SO2 pollution [19], which justifies the observed increased SO2 levels post lockdown. Exposure to elevated levels of SO2 can lead to various health issues, including respiratory ailments and lung damage. Therefore, the drastic surge in SO2 levels observed in 2022 calls for deeper investigation and up-to-date ground-based monitoring.
The data analysis reveals an increase in CO density by 6.08% in 2021 and by 5.52% in 2022 relative to the reference year (Fig. 3 G-I). The highest recorded CO density was observed in March 2021 (post-COVID-19 period) at 0.056 mol/m2, while the lowest density occurred in June 2020 at 0.038 mol/m2 (Fig. 4). The main source of carbon monoxide (CO) is the incomplete burning or combustion of fossil fuel in vehicles, industrial operations, and power generation facilities, all notably prevalent in the study area. Notably, vehicular exhaust contributes a significant portion of CO pollution. With the onset of the COVID-19 pandemic in Bangladesh, the initial phase witnessed a decrease in vehicular activity, thereby projecting a reduction in CO emissions [15].
In this study, telemetry parameters were utilized to acquire data on the atmosphere’s optical depth, focusing on aerosols, which encompass suspensions of liquid or solid particles in gases such as dust, ash, mist, or fog. Anthropogenic aerosols, particularly prevalent in densely populated regions, were examined. The geographic distribution of AOD, for the months of March, April, May, and June across the years 2020, 2021, and 2022, revealed notably high AOD concentrations in 2021, with the maximum AOD recorded in March (850.507 µg/m3). Conversely, the minimum recorded AOD was 392.309 µg/m3 in March 2022 (Fig. 4). A comparison between AOD levels during the post-COVID-19 period and lockdown periods indicated higher AOD post-COVID-19. Additionally, a significant decrease in AOD was observed during 2022.
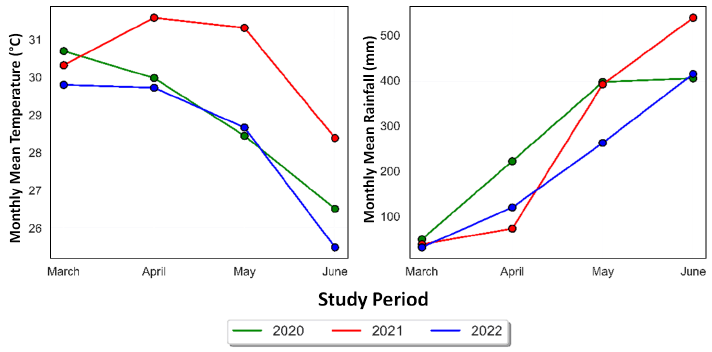
Comparable temperature and precipitation patterns were noted across the examined years. Nevertheless, elevated temperatures were documented in 2020 in contrast to 2021 and 2022 (Fig. 5). Rainfall exhibits an upward tendency from March to June, preceding the monsoon season in Bangladesh, with these months contributing 2%, 5.2%, 11.2%, and 19.2% to the country’s yearly precipitation [20].
Correlation between air pollutants and meteorological variables
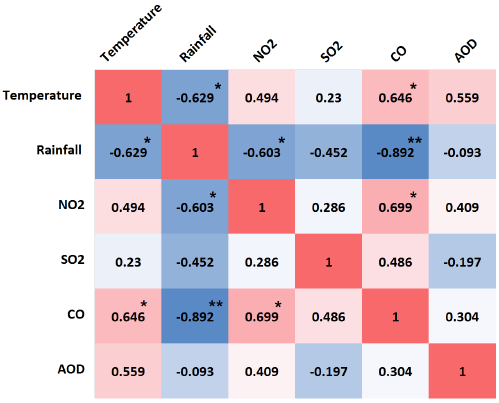
Correlation analysis (Fig. 6) showed that all air pollutant (NO2, SO2, CO, and AOD) negatively correlate with rainfall. However, this correlation was significant only in NO2 (R=-0.603 p<0.05) and CO (R=-0.892 p<0.01). On the other hand, a positive correlation was observed between temperature and air pollutants, with CO recording the only significant correlation (R=0.646 p<0.05). It is worth noting that NO2 and CO levels were positively correlated (R=0.699 p<0.05).
Conflicting reports exist concerning the relationship between temperature and air pollution. While several studies concur with the prevailing findings in the Dhaka division that temperature positively correlates with air pollution levels [21][22], other data indicate that elevated temperatures may contribute to a reduction in pollutant levels [23]. These discrepancies may be ascribed to varying study times across distinct locales and settings.
Conversely, recent research indicates a negative correlation between precipitation and air pollution in urban and industrial areas [24][25]. Rainfall serves as a natural cleaner for the environment by eliminating pollutants during its descent and impeding human activities associated with heightened air pollution.
This study reveals a significant post-pandemic increase in air pollutants across the Greater Dhaka Division, with notable surges in NO₂, SO₂, and CO levels due to the resumption of industrial activities and transportation. Similar trends have been reported in other urban centers such as Delhi, Beijing, and Jakarta, where post-lockdown emissions rebounded due to increased industrial production and relaxed environmental regulations [26-28]. This comparative perspective suggests that Dhaka’s pollution trajectory aligns with global patterns, emphasizing the urgency of implementing targeted mitigation strategies to prevent long-term air quality deterioration.
Given the alarming rise in pollution, this study underscores the need for concrete policy interventions to mitigate air quality degradation. Stricter industrial emissions regulations should be enforced, particularly for SO₂-emitting industries such as brick kilns, cement factories, and power plants. The implementation of low-emission zones in Dhaka, particularly in high-traffic areas, could reduce vehicular emissions, while expanding public transportation infrastructure—such as electric buses and metro rail—would lower NO₂ and CO levels by reducing dependence on fossil fuel-powered vehicles. Additionally, urban greening initiatives, such as increased tree cover in industrial zones and along major roads, could enhance pollutant absorption and improve air quality.
Notwithstanding the study’s capabilities in utilizing Google Earth Engine (GEE) for extensive remote sensing analysis, certain limits must be recognized. Satellite-based data introduces uncertainty, as Sentinel-5P assesses column densities instead of near-surface concentrations, potentially leading to overestimations or underestimations of pollution levels. The absence of ground-based validation further limits the accuracy of findings, as satellite-derived values could be enhanced through cross-verification with local air quality monitoring stations. Moreover, this study lacks source attribution analysis, complicating the quantification of the precise contributions from industrial, vehicle, and residential emissions. Therefore, future research should concentrate on the integration of satellite and terrestrial monitoring data, the development of machine learning models for predictive air quality evaluations, and the execution of sector-specific pollution source analyses to enhance policy recommendations.
Conclusion
This research utilized Google Earth Engine (GEE) to examine the spatiotemporal fluctuations of air pollutants (NO₂, SO₂, CO, and AOD) in Dhaka, Bangladesh, during and after to the COVID-19 pandemic. The results indicate a notable resurgence in pollution levels following the lockdown, with NO₂ escalating by 37.3% in 2021 and 20.6% in 2022, SO₂ soaring by 52% and 297%, and CO climbing by 6.08% and 5.52% relative to 2020. These trends suggest that the resumption of human activity has led to a decline in air quality, highlighting the necessity for more stringent environmental laws. Meteorological factors significantly influenced air quality patterns, with temperature positively correlating with pollutant levels and rainfall negatively correlating, suggesting precipitation-induced pollutant washing. The research confirms the efficacy of satellite-based remote sensing for extensive environmental monitoring and decision-making. Subsequent study ought to investigate sophisticated machine learning algorithms to forecast air pollution patterns and evaluate prospective mitigation measures. Incorporating socioeconomic data, including population density, industrial growth, and transportation emissions, would yield a more thorough comprehension of pollution causes and their enduring effects. Furthermore, integrating terrestrial air quality monitoring data for validation could improve the precision of satellite-derived results. These strategies will assist policymakers in formulating data-driven initiatives to enhance air quality and protect public health in areas with rapid urbanization such as Dhaka.
References
- Angelevska B, Atanasova V, Andreevski I. Urban Air Quality Guidance Based on Measures Categorization in Road Transport. Civ. Eng. J. 2021;7(2):253–67. DOI
- Ghasempour F, Sekertekin A, Kutoglu SH. Google Earth Engine based spatio-temporal analysis of air pollutants before and during the first wave COVID-19 outbreak over Turkey via remote sensing. J. Clean. Prod. 2021;319:128599. DOI
- Kahyaoğlu-Koračin J, Bassett SD, Mouat DA, Gertler AW. Application of a scenario-based modeling system to evaluate the air quality impacts of future growth. Atmos. Environ. 2009;43(5):1021–8. DOI
- Zhang G, Xu H, Wang H, Xue L, He J, Xu W, Qi B, Du R, Liu C, Li Z, Gui K. Exploring the inconsistent variations in atmospheric primary and secondary pollutants during the 2016 G20 summit in Hangzhou, China: implications from observations and models. Atmos. Chem. Phys. 2020;20(9):5391-403. DOI
- Eckhoff RK. Understanding dust explosions. The role of powder science and technology. J. Loss Prev. Process Ind. 2009;22(1):105-16. DOI
- Shammi M, Bodrud-Doza M, Islam AR, Rahman MM. Strategic assessment of COVID-19 pandemic in Bangladesh: comparative lockdown scenario analysis, public perception, and management for sustainability. Environ. Dev. Sustain. 2021;23:6148-91. DOI
- Majumdar D, Gajghate DG. Sectoral CO₂, CH₄, N₂O and SO₂ emissions from fossil fuel consumption in Nagpur City of Central India. Atmos. Environ. 2011;45(25):4170–9. DOI
- Rahman MM, Mahamud S, Thurston GD. Recent spatial gradients and time trends in Dhaka, Bangladesh, air pollution and their human health implications. J. Air Waste Manag. Assoc. 2019;69(4):478–501. DOI
- Randall S, Sivertsen B, Ahammad SS, Cruz ND, Dam VT. Emissions Inventory for Dhaka and Chittagong of Pollutants PM₁₀, PM₂.₅, NOₓ, SOₓ, and CO. Norwegian Institute for Air Research Dhaka (NILU), Client: Bangladesh Department of Environment. 2015.
- Jion MM, Jannat JN, Mia MY, Ali MA, Islam MS, Ibrahim SM, Pal SC, Islam A, Sarker A, Malafaia G, Bilal M. A critical review and prospect of NO₂ and SO₂ pollution over Asia: Hotspots, trends, and sources. Sci. Total Environ. 2023;876:162851. DOI
- Luo X, Jiang R, Yang B, Qin H, Hu H. Air quality visualization analysis based on multivariate time series data feature extraction. J. Vis. 2024;27(4):567–84. DOI
- Amaechi CF, Igbinoba QA, Okoduwa AK. Assessment of Atmospheric Pollutants (NO₂, CO, and Aerosols) in Kano State, Northwestern Nigeria, from 2019-2023. J. Appl. Sci. Environ. Manage. 2024;28(11B Supplementary):3777-86.
- Morozova AE, Sizov OS, Elagin PO, Agzamov NA, Fedash AV, Lobzhanidze NE. Integral Assessment of Atmospheric Air Quality in the Largest Cities of Russia Based on TROPOMI (Sentinel-5P) Data for 2019–2020. Cosm. Res. 2022;60(S1):S57–68. DOI
- Amani M, Ghorbanian A, Ahmadi SA, Kakooei M, Moghimi A, Mirmazloumi SM, Moghaddam SH, Mahdavi S, Ghahremanloo M, Parsian S, Wu Q. Google earth engine cloud computing platform for remote sensing big data applications: A comprehensive review. IEEE J. Sel. Top. Appl. Earth Obs. Remote Sens. 2020;13:5326-50. DOI
- Haque MdN, Sharif MdS, Rudra RR, Mahi MM, Uddin MdJ, Ellah RGA. Analyzing the spatio-temporal directions of air pollutants for the initial wave of Covid-19 epidemic over Bangladesh: Application of satellite imageries and Google Earth Engine. Remote Sens. Appl. Soc. Environ. 2022;28:100862. DOI
- Su W, Sui D, Zhang X. Satellite image analysis using crowdsourcing data for collaborative mapping: current and opportunities. Int. J. Digit. Earth 2018;13(6):645–60. DOI
- Choo GH, Hong H, Kim G, Kim SM. Comparison of GEMS and TROPOMI NO₂ observations with ground-based measurements over South Korea. InEGU General Assembly Conference Abstracts. 2024:6890. DOI
- Liu F, Beirle S, Joiner J, Choi S, Tao Z, Knowland KE, Smith SJ, Tong DQ, Ma S, Fasnacht ZT, Wagner T. High-resolution mapping of nitrogen oxide emissions in large US cities from TROPOMI retrievals of tropospheric nitrogen dioxide columns. Atmos. Chem. Phys. 2024;24(6):3717-28. DOI
- Ghasempour F, Sekertekin A, Kutoglu SH. Google Earth Engine based spatio-temporal analysis of air pollutants before and during the first wave COVID-19 outbreak over Turkey via remote sensing. J. Clean. Prod. 2021;319:128599. DOI
- Monir MM, Rokonuzzaman M, Sarker SC, Alam E, Islam MK, Islam AR. Spatiotemporal analysis and predicting rainfall trends in a tropical monsoon-dominated country using MAKESENS and machine learning techniques. Sci. Rep. 2023;13(1):13933. DOI
- He J, Gong S, Yu Y, Yu L, Wu L, Mao H, Song C, Zhao S, Liu H, Li X, Li R. Air pollution characteristics and their relation to meteorological conditions during 2014–2015 in major Chinese cities. Environ. Pollut. 2017;223:484-96. DOI
- Li R, Wang Z, Cui L, Fu H, Zhang L, Kong L, Chen W, Chen J. Air pollution characteristics in China during 2015–2016: Spatiotemporal variations and key meteorological factors. Sci. Total Environ. 2019;648:902-15. DOI
- Liu Y, Zhou Y, Lu J. Exploring the relationship between air pollution and meteorological conditions in China under environmental governance. Sci. Rep. 2020;10(1):14518. DOI
- Rahman M, Meng L. Examining the Spatial and Temporal Variation of PM₂.₅ and Its Linkage with Meteorological Conditions in Dhaka, Bangladesh. Atmosphere 2024;15(12):1426. DOI
- Nayeem AA, Hossain MS, Majumder AK. PM 2.5 concentration and meteorological characteristics in Dhaka, Bangladesh. Bangladesh J. Sci. Ind. Res. 2020;55(2):89-98. DOI
- Sahoo PK, Salomão GN, da Silva Ferreira Júnior J, de Lima Farias D, Powell MA, Mittal S, Garg VK. COVID-19 lockdown: a rare opportunity to establish baseline pollution level of air pollutants in a megacity, India. Int. J. Environ. Sci. Technol. 2021;18(5):1269–86. DOI
- Bhatti MA, Song Z, Bhatti UA, Ahmad N. Predicting the Impact of Change in Air Quality Patterns Due to COVID-19 Lockdown Policies in Multiple Urban Cities of Henan: A Deep Learning Approach. Atmosphere 2023;14(5):902. DOI
- Sharma E, Deo RC, Yaseen ZM, Khare M, Dhawan S. Artificial Intelligence Models and Association of Air Pollutants and Novel Coronavirus: A Survey for Asia and Oceania. Knowl.-Based Eng. Sci. 2024;5(2):31–53. DOI
Cite this article:
Hossin, M. A., Haque, A., Saha, O. R., Islam, R., Shimin, T. I. A spatiotemporal analysis of air pollutants during and after COVID-19: A case study of Dhaka Division using Google Earth Engine. DYSONA – Applied Science, 2025;6(2): 411-421. doi: 10.30493/das.2025.500496