Almustafa Abd Elkader Ayek 1; Bilel Zerouali 2,3; Mohannad Ali Loho 4,5*; Nadjem Bailek 6,7; Celso Augusto Guimarães Santos 8,9; Safieh Eid 5; Suzan Fathe Karmoka 10
1, Department of Topography, Faculty of Civil Engineering, University of Aleppo, Aleppo, 12212, Syria
2, Laboratory of Architecture, Cities and Environment, Faculty of Civil Engineering and Architecture, Department of Hydraulic, Hassiba Benbouali University of Chlef, B.P. 78C, Ouled Fares, Chlef 02180, Algeria
3, Vegetal Chemistry-Water-Energy Research Laboratory, Faculty of Civil Engineering and Architecture, Department of Hydraulic, Hassiba Benbouali University of Chlef, B.P. 78C, Ouled Fares, Chlef 02180, Algeria
4, Department of Geography, Faculty of Arts and Humanities, Damascus University, Damascus, Syria
5, Department of Geography, Faculty of Arts and Humanities, Tartous University, Tartous, Syria
6, Laboratory of Mathematics Modeling and Applications, Department of Mathematics and Computer Science, Faculty of Sciences and Technology, Ahmed Draia University of Adrar, Adrar 01000, Algeria
7, Energies and Materials Research Laboratory, Faculty of Sciences and Technology, University of Tamanghasset, 11000, Tamanghasset, Algeria
8, Department of Civil and Environmental Engineering, Federal University of Paraíba, João Pessoa, 58051-900, Paraíba, Brazil
9, Stokes School of Marine and Environmental Sciences, University of South Alabama, Mobile, AL 36688, USA
10, Department of Agricultural Studies and Research, General Organization of Remote Sensing (GORS), Damascus, Syria
E-mail:
lohomohannad@gmail.com
Received: 06/02/2025
Acceptance: 21/06/2025
Available Online: 22/06/2025
Published: 01/07/2025

Manuscript link
http://dx.doi.org/10.30493/DAS.2025.504896
Abstract
The precise derivation of spectral indices, including the Normalized Difference Vegetation Index (NDVI) and the Normalized Difference Water Index (NDWI), plays a crucial role in ensuring reliable environmental assessments through the application of remote sensing methodologies. This research examines the manner in which the transformation of Landsat 8–9 Level 2 digital numbers (DN) into surface reflectance (SR) influences the precision and clarity of NDVI and NDWI measurements in the ecologically significant Sabkhat Al-Jabbul area of Syria. For that purpose, a comprehensive analysis was conducted utilizing Google Earth Engine and ArcGIS Pro, focusing on 307 cloud-filtered Landsat images collected between 2014 and 2024. The analysis employed time series, spatial maps, and statistical comparisons, including t-tests, RMSE, and KDE plots, to evaluate the distinctions between DN- and SR-derived indices. The findings demonstrate that SR conversion markedly improves the value range of the both indices and the identification of land cover types, particularly in heterogeneous areas characterized by seasonal water bodies and irrigated agricultural fields. It is significant that the indices derived from SR-images provide a comprehensive insight into the dynamics of water and the health status of vegetation. This study emphasizes the effectiveness of data derived from Landsat and its significance in the precise monitoring of environmental issues. It particularly underscores the necessity of converting Digital Numbers to Surface Reflectance, with a focus on research conducted in arid and semi-arid regions. Consequently, it is advisable to incorporate the DN to SR conversion process during the pre-processing phase of remote sensing data, thereby enhancing the precision of environmental assessments.
Keywords: Digital number, Surface reflectance, NDVI, NDWI, Remote sensing, Google Earth Engine
Introduction
Remote sensing has emerged as a crucial instrument for the observation and management of terrestrial environmental ecosystems, marking a significant advancement in the environmental monitoring [1][2]. This versatile technology has afforded scholars significant understanding of ecosystem dynamics that were challenging to examine through the monitoring of environmental phenomena on a broad scale [3]. Furthermore, it has been applied across a wide range of domains, including the evaluation of vegetation health, the surveillance of aquatic environments and algal proliferation, as well as the estimation of soil moisture levels [4]. Its capacity to deliver precise and reliable spatiotemporal data has rendered it essential in the field of environmental studies [5].
The Landsat satellite program is widely recognized as a fundamental component of Earth observation among various remote sensing platforms. Since its initial launch in 1972, Landsat has provided one of the most extensive and enduring public archives of multispectral imagery [6]. This distinctive collection allows scholars to examine years of environmental transformation, offering exceptional prospects for the analysis of time series and the identification of trends [7]. Landsat effectively integrates both regional and local scales, achieving a spatial resolution of 30 meters. This facilitates its application across various domains, including land use and land cover mapping, vegetation monitoring, and the management of water resources [8][9]. The 16-day revisit interval facilitates consistent data collection, allowing for comprehensive monitoring of seasonal trends, environmental alterations, and anthropogenic effects [8][10].
Recent advancements in cloud computing platforms, exemplified by the Google Earth Engine (GEE), have significantly enhanced the utility of Landsat imagery [11][12]. Landsat platforms facilitate convenient access to extensive datasets and support swift and scalable analyses, allowing researchers to tackle intricate environmental challenges with enhanced efficiency [13][14]. Consequently, it is regarded as a crucial instrument for the observation and administration of ecosystems in light of the challenges posed by climate change and anthropogenic influences.
On December 1, 2020, the USGS made Landsat Level-2 products that provide surface reflectance (SR) data available, thereby enhancing the efficacy of imagery for environmental analysis [15]. Unlike previous data which was confined to reflectance measurements at the top of the atmosphere (TOA), the newly developed products offer values that have been corrected for atmospheric influences, incorporating factors such as aerosols, water vapor, and ozone [15]. Nonetheless, the adjusted values continue to be represented as digital numbers (DN) instead of reflectance values ranging from 0 to 1 [16][17]. The digital numbers captured by satellite sensors are discrete integer values arising from the quantization process, thus lacking direct physical significance [18]. Therefore, the conversion of these values into physical measurements, similar to radiance for instance, is essential for the estimation of land surface variables [18]. The utilization of prevalent vegetation indices, including NDVI and NDWI, is fundamentally based on spectral ratios derived from radiance or reflectance values, thereby necessitating conversion for the attainment of precise outcomes.
The process of conversion holds significant importance in the context of radiometric correction and calibration. Conversion coefficients, typically found within the metadata of satellite image files, serve the purpose of transforming digital numbers into spectral radiance values. Furthermore, this modification constitutes a critical prerequisite for the implementation of physical models grounded in radiation transfer principles, which necessitate precise inputs [18]. Neglecting the conversion of DN to SR can result in considerable inaccuracies in the computation of spectral indices like NDVI and NDWI [15], ultimately leading to skewed spatio-temporal analyses and questionable results [19][20].
Indices obtained from Landsat are frequently employed in the fields of agriculture, water resource assessment, and ecosystem observation. The NDVI facilitates the evaluation of crop health, the assessment of biomass vitality, and the monitoring of drought conditions, whereas the NDWI is employed for the identification of wetlands, water bodies, and the moisture content within vegetation cover [21][22]. Their extensive applicability underscores their significance in the examination of ecosystems influenced by climate variability [23]. In this context, GEE provides complimentary access to these indices, facilitating advanced geospatial analyses without the necessity for costly computing resources [24][25].
This study examines the impact of transforming digital numbers (DN) to surface reflectance (SR) on the precision of NDVI and NDWI calculations derived from Landsat 8-9 Level 2 data. Through a comparative analysis of the results obtained prior to conversion and those acquired subsequently, the critical role of this preprocessing phase in maintaining the precision and uniformity of environmental monitoring outcomes will be underscored. Consequently, this research seeks to address the subsequent inquiry: What is the degree to which the conversion of digital numbers to surface reflectance impacts the accuracy and consistency of NDVI and NDWI values derived from Landsat data?
the findings particularly significant for research pertaining to environmental, agricultural, and climate-related studies, where these indices are utilized to observe and assess alterations in vegetation and aquatic systems.
Material and Methods
Study area
The Sabkhat al-Jabbul region is located in the southeastern section of Aleppo Governorate, northern Syria (Fig. 1). The area encompasses around 4,800 km², with the saline lake (Sabkha) of Sabkhat al-Jabbul serving as its principal geographical characteristic. This lake is situated within a closed endorheic basin encompassing approximately 5,075 km². It is located at an altitude of 312 meters above sea level and exhibits considerable seasonal and spatial change in its surface area. The basin is flanked by the Euphrates River to the east and elevated basaltic topography to the west and south, with altitudes varying from 350 to 600 meters above sea level. The Qwayq River valley from the northwest contributes to the basin [26][27].
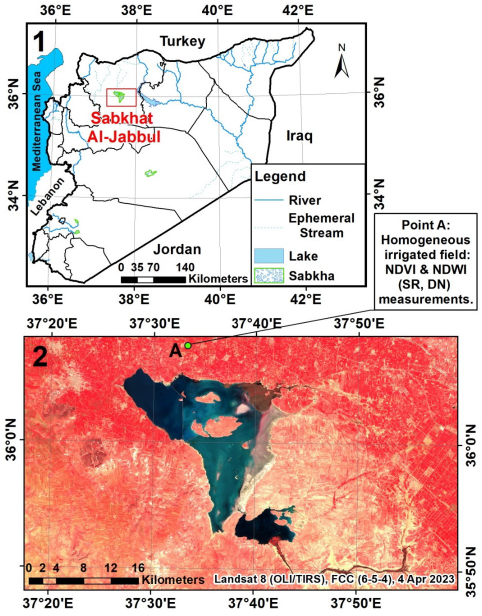
A terrestrial dam was erected in 1996, partitioning the lake into three semi-autonomous sub-basins with unique hydrological and salinity regimes. The northwestern basin (47 km²) is utilized for industrial salt extraction because to its highest salinity among the three, whilst the middle basin (194 km²) receives inputs from agricultural drainage, groundwater, in addition to industrial and urban wastes. The southeastern basin, covering 29 km², expands in the summer due to surplus irrigation water discharged from adjacent cotton fields, and is referred to as Lake Al Hamrat [26].
The region is situated in a semi-arid climate, marked by minimal annual rainfall (about 200 mm) and elevated summer temperatures that often surpass 40°C, exacerbating evapotranspiration and saline buildup in the lake. The substrate at the lake’s bottom is characterized by high salinity and clay content, whilst adjacent areas display a gradation into clay-sandy soils. This sustains a halophytic vegetation cover of species such as Aeluropus lagopoides, Halopeplis perfoliata, and Arthrocnemum macrostachyum. Ecologically, Sabkhat al-Jabbul is an essential habitat, functioning as a critical stopover and wintering location for migratory water birds, including the Greater Flamingo (Phoenicopterus roseus), Greater White-fronted Goose, Ruddy Shelduck (Tadorna ferruginea), and Common Crane (Grus grus) [28]. Sabkhat al-Jabbul has experienced a deterioration in water quality and ecological equilibrium due to adverse human activities, including sewage discharge, agricultural chemical runoff, and industrial contamination [26].
This region is a distinctive natural setting for remote sensing-based environmental research due to its diverse topography, encompassing salty marshes, ephemeral lakes, arable land, and marginal soils. This combination of settings renders it an ideal location for evaluating spectral indices like NDVI and NDWI, which are responsive to variations in vegetation, moisture, and land surface conditions. The significant climatic stresses and diverse topography present a crucial opportunity to examine how pre-processing procedures, especially DN to SR conversion, influence the accuracy and dependability of satellite-based indices in dry and semi-arid areas.
Datasets
Landsat 8 and 9 satellite data were used in this research since they provide essential information about land cover, vegetation, and environmental changes, and they have a powerful ability to monitor the Earth’s surface globally [6].
Landsat Level-2 surface reflectance products are generated using different algorithms depending on the satellite generation. For Landsat 4-7, the Landsat Ecosystem Disturbance Adaptive Processing System (LEDAPS) algorithm is used, which applies atmospheric correction using MODIS-derived aerosol information and metadata from the Level-1 product [29][30]. To provide improved correction by taking into account modern atmospheric modelling and the specific characteristics of each sensor, the Landsat Surface Reflectance Code (LaSRC) is implemented for Landsat 8 and 9 [31][32]. This provides high-quality data for more accurate monitoring and detection of environmental changes by ensuring consistent radiometric and geometric corrections for the two algorithms [33][34].
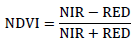
Cloud filtering with a threshold of less than 1% was applied to ensure higher accuracy and reliability of the input data. The Landsat 8 Level 2 image, dated April 4, 2023 (Path ck 173/Row 35), was selected for spatial analysis due to its low cloud cover (approximately 0.25%) and representing a seasonal period with a variety of land cover types, such as cultivated and natural vegetation, saline soils, and water bodies of varying depths. These circumstances improve the NDVI and NDWI indices’ ability to distinguish between different surface features. Between 2014 and 2024, Landsat 8 and 9 acquired cloud-filtered images from which 307 NDVI and NDWI measurements were extracted. These observations were distributed across all seasons, with multiple acquisitions in some months and gaps in others depending on data availability. This temporal coverage allowed for evaluating seasonal and climatic variability and, more importantly, for quantifying the statistical differences and relationships between the indices derived directly from DN and those computed from surface reflectance. The processing was primarily performed using GEE to enable efficient, large-scale cloud computation, while ArcGIS Pro software was used for additional spatial visualization and analysis.
Conversion to surface reflectance values
Landsat Level 2 outputs include applied atmospheric corrections, rendering them appropriate for the extraction of SR values. It might be presumed that these products are prepared for immediate application in calculating spectral indices, such as NDVI and NDWI, as the requisite corrections have been implemented [22][23].
The pixel values in these products are maintained as Digital Numbers (DN), which are not directly suitable for the computation of spectral indices. These values are not normalized to the (0-1) range, hence digital numbers do not accurately represent reflectance levels. Consequently, they require further conversions to yield precise results. The DN from the Level 2 data must be processed using the following equation to derive the actual surface reflectance values [15][31]:
Reflectanceband = (DNband × Scaling Factor) + Offset
Where: DNband is the digital number stored for each pixel in the given band, while the values for scaling factor (0.0000275) and offset (-0.2) are extracted from the metadata is from the metadata file.
In specific instances of converting DN to SR, extensive cloud cover, highly reflective surfaces (such as snow or ice), or extremely dim objects (including deep water or heavily shadowed regions) may result in anomalous readings, such as negative reflectance or values exceeding 1. Surface reflectance must range from 0 to 1; therefore, numbers outside this range are physically implausible. To address this issue, the Quality Assessment (QA_PIXEL) band is typically utilized to identify and mask erroneous pixels, including those associated with clouds, shadows, and other obstructions. This supplementary band, incorporated in the Landsat data, identifies problematic pixels to prevent interference with spectral index calculations [15][31]. Furthermore, to avoid inaccuracies, it is advisable to mask pixels exhibiting reflectance values exceeding 1 or below 0 in instances of deep-water bodies or snow-covered areas. These features typically exhibit values outside the anticipated physical reflectance range and may skew the findings if not masked [34].
Calculating the Normalized Difference Vegetation Index (NDVI)
The Normalized Difference Vegetation Index (NDVI) is a commonly utilized metric for assessing vegetation density and vitality. The subsequent formula is employed for the calculation of NDVI [35]:
Where RED denotes the surface reflectance in the red band, while NIR signifies the surface reflectance in the near-infrared band. NDVI values range from -1 to +1 and elevated readings (approaching +1) signify thick and healthy vegetation. Non-vegetated surfaces, including urban environments, bare soil, and aquatic bodies, generally exhibit values close to 0 or negative. Lower NDVI values are especially beneficial for identifying areas with minimal to no vegetation cover [23][36].
Calculating the Normalized Difference Water Index (NDWI)
The Normalized Water Difference Index (NWDI) is used to monitor water bodies and wetlands and estimate the water content of vegetation. It is calculated according to the following equation [37]:
Where: NIR is the surface reflectance in the near-infrared band, and green is the surface reflectance in the green band. NDWI values usually fall in between -1 and +1. Higher positive NDWI values refer to the existence of water bodies or wetlands, which makes it widely used in the field of monitoring water bodies. Negative NDWI values refer to dry areas or non-water bodies, such as bare soil, rocks, or urban regions, and vegetation cover [22].
Statistical analysis
To comprehend the significance of transforming Digital Numbers (DN) in Landsat pictures to Surface Reflectance (SR) for the computation of the spectral indices NDVI and NDWI, various statistical methods for distinct analytical objectives were applied.
The distribution and variability of NDVI and NDWI values across all utilized photos were analyzed by descriptive statistical visualizations, namely box plots and kernel density estimation (KDE) plots, to identify dispersion, skewness, and extremes potentially arising from the conversion of DN to SR [38]. Violin plots were employed to concurrently illustrate the probability distribution and summary statistics of each index, enhancing interpretability and enabling dataset comparisons [39].
The paired t-test was employed to ascertain if the differences between DN-derived and SR-derived NDVI and NDWI values were statistically significant. This test is extensively utilized in remote sensing to assess the impacts of preprocessing and data conversion [40]. The extent of variation between the two index types was quantified using the Root Mean Square Error (RMSE), a commonly employed statistic in assessments of remote sensing accuracy. The coefficient of variation (CV) was calculated to assess the relative variability of NDVI values across several pictures and temporal phases [41].
All analyses in this study were conducted using Python 3.x and employed the Pandas, NumPy, SciPy, Matplotlib, and Stats Models libraries for data processing, analysis, and visualization. The Pearson correlation coefficient was calculated to assess the degree and direction of linear correlations between the spectral index data before and after conversion to surface reflectance.
Results and Discussion
NDVI and NDWI maps
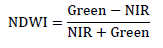
It is evident that the NDVI and NDWI SR-based maps (Fig. 2 A and B, respectively) provide a visual representation of spatial variability with enhanced accuracy, distinctly outlining vegetated regions and aquatic features. In contrast, the NDVI and NDWI maps derived from DN-based outputs (Fig. 2 C and D, respectively) exhibit diminished contrast and a more indistinct portrayal of environmental characteristics, especially in the transitional areas of the examined subjects, including moisture gradients and the absence of vegetation. The observed discrepancies can be ascribed to the absence of atmospheric correction in DN data, resulting in radiometric inconsistencies and diminished spectral separability [18]. This finding underscores the significance of implementing SR conversion in the utilization of spectral indices for environmental evaluations, particularly in heterogeneous landscapes like the Sabkha, where minor variations in reflectance are vital for differentiating between vegetation, saline crusts, and shallow water.
Analysis of the spatial distribution maps for the NDVI and NDWI indices (Fig. 2) reveals a limited color range in both indices prior to conversion, particularly in the Sabkha region. Notably, the NDVI index indicates that the entire water surface is predominantly represented in a near-uniform shade of green within the DN image (Fig. 2 C). While after transforming to SR values, the water surface can exhibit various shades of green (Fig. 2 A). This variation aids in distinguishing between deep water, shallow water, and the water at the periphery of the lake [4], particularly when it is intermingled with vegetation. This emphasizes the significance of the concept presented in this study, specifically the necessity of transforming the digital number into a reflector number. The NDWI index exhibits similar characteristics, revealing that the water surface in the SR image displays a reddish hue that transitions from light red to dark orange-red (Fig. 2 B), whereas the DN image presents a subtle color gradient (Fig. 2 D).
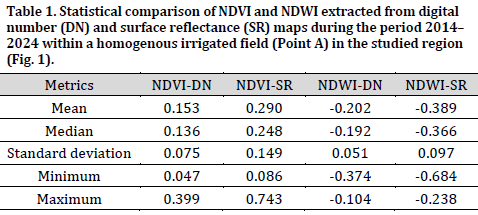
The same principle is applicable to the agricultural fields located to the north of the Sabkha, which encompass various irrigation initiatives. In the DN image, it is observed that the majority of the field area is represented in a nearly uniform shade of red (Fig. 2 C). However, upon the application of SR, a variety of red shades becomes apparent, suggesting variations in the vitality of the vegetation cover or differing densities, as indicated by the NDVI values measured across these fields (Fig. 2 A). Consequently, the conversion process from DN to SR facilitates an understanding of the current condition of vegetation cover, indicating whether it is experiencing stress or functioning optimally [15][20]. The normalized difference vegetation index, following its conversion to surface reflectance, attained a peak value of 0.743, representing an increase of 0.344 times compared to the maximum value derived from the digital number image (Table 1). This provides a more reliable indication of the values representing cultivated vegetation cover, as it is widely recognized that elevated NDVI values signify healthy irrigated agricultural areas or dense forest coverage.
Statistical analysis of spectral indices
A comprehensive time series analysis of NDVI and NDWI indices was performed utilizing 307 Landsat (8, 9) images collected from February 13, 2014, to December 18, 2024, focusing on a specifically delineated homogeneous agricultural field within the designated study area (Fig. 1). The findings underscore the enhancements achieved following the transformation of the data into surface reflectance (Fig. 3).
NDVI ranged between 0.047 to 0.399 prior to conversion, expanding to a range of 0.086 to 0.743 subsequent to conversion. Correspondingly, the mean value elevated from 0.153 to 0.289, while the median progressed from 0.136 to 0.248. The NDWI exhibited a comparable trend, with the range transitioning from (-0.374 to -0.104) prior to conversion to (-0.684 to -0.238) subsequent to conversion. The mean value altered from -0.2023 to -0.3885, while the median shifted from -0.192 to -0.366 (Fig. 3 and Table 1).
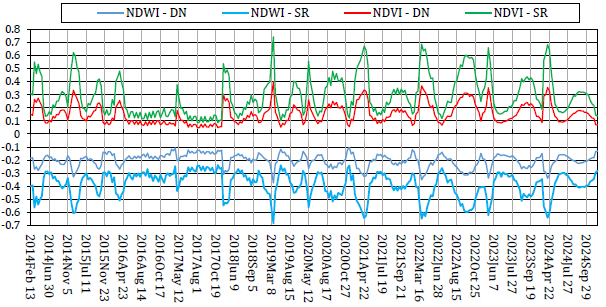
The transformation from DN to SR has amplified the extreme values in peaks and valleys for the NDVI and NDWI graphs (Fig. 3). The NDVI index exhibits identical peaks in the graph prior to conversion and subsequent to conversion; however, there is a significant disparity between these peaks before and after conversion. The disparity between the values prior to and after conversion is elucidated by the observation that the indices for barren or uncultivated lands consistently yield low values. The conversion process from DN to SR has augmented the probabilities associated with the types or conditions of vegetation cover for high values indicating vegetation cover. Prior to conversion, the maximum NDVI values in the DN image approximated 0.3, representing an average vegetation cover. Conversely, the SR map exhibited values about 0.7, signifying optimal vegetation cover, particularly with irrigated farmed land, characterized by elevated water content and substantial plant density. Therefore, the conversion procedure facilitated the accurate monitoring and analysis of various stages or conditions of vegetation cover concerning both indices.
A strong symmetry is evident between the two graphs. NDVI values span from 0 to nearly 1, whereas NDWI values extend from 0 to around -1. Significantly low NDWI values (approaching -1) generally signify thick and robust vegetation, corresponding with elevated positive NDVI values. Negative NDWI results do not indicate elevated surface water levels; rather, positive NDWI values serve as the true indicators of open water bodies [42]. Conversely, significantly negative NDWI results indicate elevated internal water content in vegetation. The relationship arises from the spectral characteristics of healthy vegetation, which demonstrates significant reflectance in the near-infrared (NIR) band due to leaf cell structure, and relatively lower reflectance in the green band—albeit still higher than in the red band, resulting in increased NDVI values. When NIR reflectance markedly surpasses that of the green band, the numerator in the NDWI formula (Green − NIR) becomes negative with a substantial absolute value, whilst the denominator (Green + NIR) remains positive, yielding NDWI values near -1. Dry soils typically demonstrate greater reflectance in the NIR band compared to the green band, resulting in negative or nearly zero NDWI values [43]. Consequently, this evident symmetry verifies that any alteration in the NDVI index following the transformation process transpired similarly in the NDWI index.
The results demonstrate that the transformation from DN to SR markedly improved the dynamic range and clarity of spectral indices over time, especially for vegetated and water-covered targets. This improvement was most evident in the observed expansion of NDVI and NDWI value ranges, accompanied by higher standard deviation and alterations in mean and median values, indicating enhanced sensitivity to surface conditions. The results immediately substantiate the primary aim of this work, which is to assess the analytical advantage of surface reflectance conversion in index-based monitoring. It was reported that Landsat Level-2 surface reflectance products provide improved temporal consistency and radiometric reliability, which is particularly advantageous for multi-date environmental analyses in heterogeneous and dynamic landscapes, such as irrigated fields and arid sabkhas [34].
A paired t-test demonstrated extremely significant changes in both the NDVI (t=-31.856, p<0.001) and the NDWI (t=65.520, p<0.001), affirming that the surface reflectance adjustment significantly influences the average values of these indices. To assess the mean magnitude of the discrepancies between the two methodologies, RMSE values were calculated, yielding 0.155 for the NDVI and 0.193 for the NDWI. This disparity validates that the SR-based methodology yields more efficacious outcomes, particularly in moisture-sensitive regions. The NDVI coefficient of variation (CV) increased from 0.489 in DN photos to 0.513 in SR images, indicating greater temporal variability and consequently an improvement in the index values. Although there was no substantial difference in the NDWI, a marginal change was seen (-0.250 in DN and -0.252 in SR), indicating that despite the variation in index values, their internal consistency remained intact. The statistical studies and visualizations unequivocally indicate that the conversion of Landsat data from DN to SR improved the accuracy, distribution, and interpretability of NDVI and NDWI.
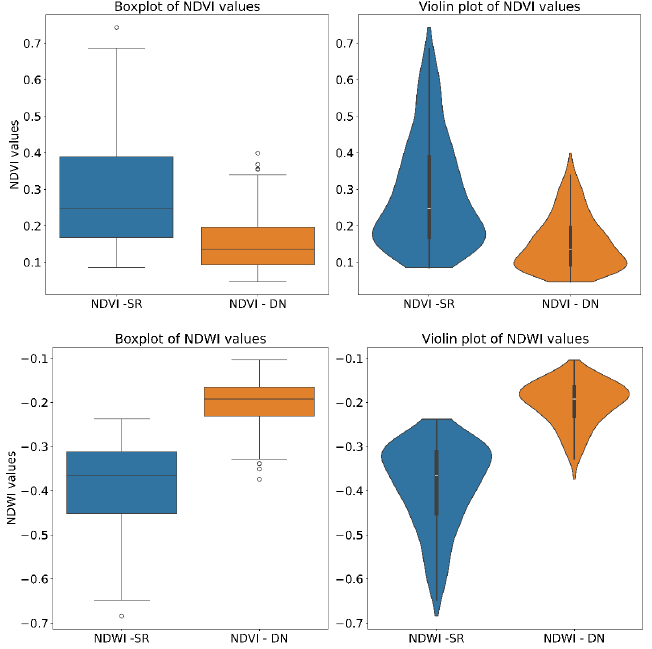
The box and violin plots (Fig. 4) demonstrate wider, more ecologically significant distributions for both NDVI and NDWI following conversion. Specifically, NDVI violin forms broaden and achieve more equilibrium, signifying that SR-based indices more precisely reflect the intrinsic variability in vegetation cover. These observations are in agreement with previous works where SR-derived NDVI and NDWI improved the identification of environmental changes in semi-arid agricultural regions impacted by flooding [44].
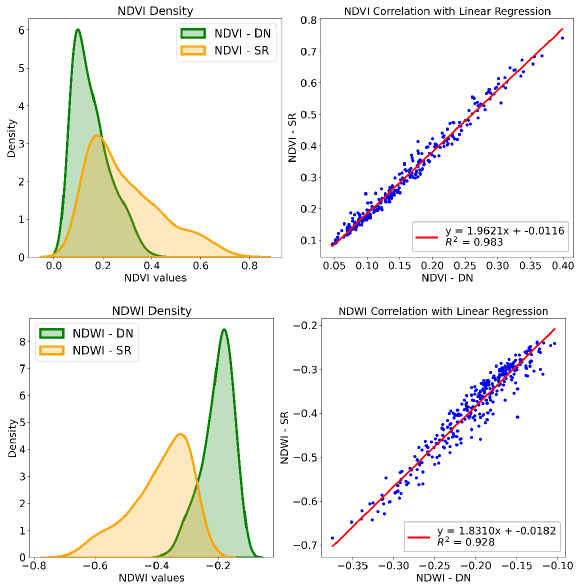
The results of the KDE plots and regression analysis (Figure 5) provide additional validation of the impact of converting DN to SR. The findings of this analysis indicate that the narrow, peak distributions observed in DN-based data evolve into broader, more representative patterns when considering SR-based data. The findings from the regression analysis indicate a robust correlation between the two data types, with R values of 0.991 and 0.928 for NDVI and NDWI, respectively. Significant variations in magnitude are underscored by alterations in slope, with values of 1.962 for NDVI and 0.507 for NDWI. A study conducted in semi-arid Iran [45] reported similar findings, indicating that the use of radio metrically corrected data facilitated enhanced differentiation of moisture conditions.
Liang (2004) [18] posited that DN values are affected by atmospheric conditions and sensor-related distortions, which compromises their reliability for consistent quantitative analysis—an assertion that supports the present findings. The transformation from DN to SR serves to alleviate these discrepancies, thereby facilitating a more accurate and consistent computation of spectral indices. This transformation transcends a mere preprocessing step; it is instrumental in augmenting the interpretation of spectral indices. This holds significant relevance in semi-arid regions such as Sabkhat al-Jabbul, where subtle seasonal variations may be obscured by atmospheric disturbances. As a result, the indices derived from surface reflectance imagery provide enhanced accuracy in understanding vegetation dynamics and moisture fluctuations within these delicate ecosystems. The indices further improve their responsiveness to environmental stresses, including drought and salinity, elements that are crucial for effective agricultural and environmental management.
Conclusions
This research highlights the significant role of transforming DN to SR in the computation of spectral indices like NDVI and NDWI, providing fresh perspectives on how this transformation influences index efficacy over time in semi-arid regions. In contrast to previous investigations that assessed SR conversion in generalized or short-term frameworks, this study implemented a long-term time series analysis (2014–2024) at a specifically delineated homogeneous agricultural site within the ecologically sensitive Sabkha al-Jabboul. The precision of the data, along with its ecological relevance, offers a comprehensive insight into the function of transforming the DN value into SR, facilitating an interpretation and comprehension of the behavior of the subjects examined through these spectral indices.
The findings further validated that at significant phenological phases, including peak vegetation growth or critical conditions like drought, the direct application of DN leads to an underestimation of the dynamic range of NDVI and NDWI. Conversely, the documentation of these environmental changes was more reliable and precise when utilizing SR-based indices. The findings unequivocally indicate that implementing this conversion before the calculation of indices markedly enhances both the sensitivity and precision of the resultant values. In particular, the value ranges of both indices increased following conversion, facilitating a clearer distinction of ground features. The improved contrast facilitates a more accurate identification and analysis of environmental alterations, underscoring the importance of integrating DN-to-SR conversion within remote sensing methodologies. In light of these findings, the systematic implementation of SR conversion across all workflows utilizing Landsat-based indices is highly encouraged. The incorporation of SR correction within cloud platforms such as GEE is particularly recommended, as this enhancement would significantly bolster accuracy, scalability, and scientific rigor in remote sensing applications, especially in vulnerable and environmentally dynamic systems like arid and semi-arid sabkhas.
References
- Li J, Pei Y, Zhao S, Xiao R, Sang X, Zhang C. A review of remote sensing for environmental monitoring in China. Remote Sens. 2020;12(7):1130. DOI
- Zerouali B, Bailek N, Islam AR, Katipoğlu OM, Ayek AA, Santos CA, Rajput J, Wong YJ, Abda Z, Chettih M, Elbeltagi A. Enhancing groundwater potential zone mapping with a hybrid analytical method: the case of semiarid basin. Groundw. Sustain. Dev. 2024;26:101261. DOI
- Sharma S, Beslity JO, Rustad L, Shelby LJ, Manos PT, Khanal P, Reinmann AB, Khanal C. Remote sensing and GIS in natural resource management: Comparing tools and emphasizing the importance of in-situ data. Remote Sens. 2024;16(22):4161. DOI
- Adjovu GE, Stephen H, James D, Ahmad S. Overview of the application of remote sensing in effective monitoring of water quality parameters. Remote Sens. 2023;15(7):1938. DOI
- Liu D, Cai S. A spatial-temporal modeling approach to reconstructing land-cover change trajectories from multi-temporal satellite imagery. Ann. Assoc. Am. Geogr. 2012;102(6):1329–47. DOI
- USGS. Landsat Missions. U.S. Geological Survey. 2023. 2023. Available from: Link
- Vogelmann JE, Gallant AL, Shi H, Zhu Z. Perspectives on monitoring gradual change across the continuity of Landsat sensors using time-series data. Remote Sens. Environ. 2016;185:258-70. DOI
- Anderson MC, Allen RG, Morse A, Kustas WP. Use of Landsat thermal imagery in monitoring evapotranspiration and managing water resources. Remote Sens. Environ. 2012;122:50–65. DOI
- Zerouali B, Santos CAG, Nascimento TVM, Silva RM. A cloud-integrated GIS for forest cover loss and land use change monitoring using statistical methods and geospatial technology over northern Algeria. J. Environ. Manage. 2023;341:118029. DOI
- Mitchell AL, Rosenqvist A, Mora B. Current remote sensing approaches to monitoring forest degradation in support of countries measurement, reporting and verification (MRV) systems for REDD+. Carbon Balance Manag. 2017;12:1–22. DOI
- Amani M, Ghorbanian A, Ahmadi SA, Kakooei M, Moghimi A, Mirmazloumi SM, Moghaddam SH, Mahdavi S, Ghahremanloo M, Parsian S, Wu Q. Google Earth Engine cloud computing platform for remote sensing big data applications: A comprehensive review. IEEE J. Sel. Top. Appl. Earth Obs. Remote Sens. 2020;13:5326–50. DOI
- Kumar L, Mutanga O. Google Earth Engine applications since inception: Usage, trends, and potential. Remote Sens. 2018;10(10):1509. DOI
- Ma Y, Wu H, Wang L, Huang B, Ranjan R, Zomaya A, Jie W. Remote sensing big data computing: Challenges and opportunities. Future Gener. Comput. Syst. 2015;51:47–60. DOI
- Schadt EE, Linderman MD, Sorenson J, Lee L, Nolan GP. Computational solutions to large-scale data management and analysis. Nat. Rev. Genet. 2010;11(9):647–57. DOI
- USGS, United States Geological Survey. Landsat 8–9 Collection 2 (C2) Level 2 Science Product (L2SP) Guide (Version 5.0). Department of the Interior; n.d. Available from: Link
- Chander G, Markham BL, Helder DL. Summary of current radiometric calibration coefficients for Landsat MSS, TM, ETM+, and EO-1 ALI sensors. Remote Sens. Environ. 2009;113(5):893–903. DOI
- Masek JG, Vermote EF, Saleous NE, Wolfe R, Hall FG, Huemmrich KF, Gao F, Kutler J, Lim TK. A Landsat surface reflectance dataset for North America, 1990-2000. IEEE Geosci. Remote Sens. Lett. 2006;3(1):68–72. DOI
- Liang S. Quantitative remote sensing of land surfaces. John Wiley & Sons. 2005. DOI
- Taloor AK, Manhas DS, Kothyari GC. Retrieval of land surface temperature, normalized difference moisture index, normalized difference water index of the Ravi Basin using Landsat data. Appl. Comput. Geosci. 2021;9:100051. DOI
- Zhou Y, Dong J, Xiao X, Xiao T, Yang Z, Zhao G, Zou Z, Qin Y. Open surface water mapping algorithms: A comparison of water-related spectral indices and sensors. Water. 2017;9(4):256. DOI
- Wulder MA, Roy DP, Radeloff VC, Loveland TR, Anderson MC, Johnson DM, Healey S, Zhu Z, Scambos TA, Pahlevan N, Hansen M. Fifty years of Landsat science and impacts. Remote Sens. Environ. 2022;280:113195. DOI
- Zerouali B, Ayek AA, Bailek N, Kuriqi A, Wong YJ, Srivastava A, Islam AR, Ouadja A, Santos CA. RUSLE model insights for soil conservation and sustainable land use in semiarid environments. Euro-Mediterr. J. Environ. Integr. 2024;1–24. DOI
- Persico G, Seyoum WM, Peterson EW. Interrelationships between NDVI, surface water, and regional hydro-climatic variables in the Sudd Wetland. Wetlands. 2024;44(7):92. DOI
- Gorelick N, Hancher M, Dixon M, Ilyushchenko S, Thau D, Moore R. Google Earth Engine: Planetary-scale geospatial analysis for everyone. Remote Sens. Environ. 2017;202:18–27. DOI
- Tamiminia H, Salehi B, Mahdianpari M, Quackenbush L, Adeli S, Brisco B. Google Earth Engine for geo-big data applications: A meta-analysis and systematic review. ISPRS J. Photogramm. Remote Sens. 2020;164:152–70. DOI
- Alhajjar MF. Assessment of the Impact of the Syrian Conflict on the Extent and Quality of Agricultural Land in the Sabkhat al-Jabbul Area (SJA). Doctoral dissertation. Toronto: Toronto Metropolitan University. 2022.
- Al-Hilal M, Aissa M. Characterizing the natural radiation levels throughout the main geological units of Sabkhat al Jabboul area, northern Syria. J. Environ. Radioact. 2015;140:1-10. DOI
- Ramsar Convention Secretariat. Sabkhat al-Jabbul Ramsar Site Information Sheet. 1998. Available from: DOI
- Schmidt G, Jenkerson CB, Masek J, Vermote E, Gao F. Landsat ecosystem disturbance adaptive processing system (LEDAPS) algorithm description. USGS Open-File Report 2013–1057. 2013. DOI
- Teixeira Pinto C, Jing X, Leigh L. Evaluation analysis of Landsat level-1 and level-2 data products using in situ measurements. Remote Sens. 2020;12(16):2597. DOI
- Vermote E, Justice C, Claverie M, Franch B. Preliminary analysis of the performance of the Landsat 8/OLI land surface reflectance product. Remote Sens. Environ. 2016;185:46–56. DOI
- Zhao C, Wu Z, Qin Q, Ye X. A framework of generating land surface reflectance of China early Landsat MSS images by visibility data and its evaluation. Remote Sens. 2022;14(8):1802. DOI
- Dwyer JL, Roy DP, Sauer B, Jenkerson CB, Zhang HK. Analysis ready data: enabling analysis of the Landsat archive. Remote Sens. 2018;10(9):1363. DOI
- Roy DP, Wulder MA, Loveland TR, Woodcock CE, Allen RG, Anderson MC, Helder D, Irons JR, Johnson DM, Kennedy R, Scambos TA. Landsat-8: Science and product vision for terrestrial global change research. Remote Sens. Environ. 2014;145:154–72. DOI
- Rouse JW, Haas RH, Schell JA, Deering DW. Monitoring vegetation systems in the Great Plains with ERTS. NASA Special Publication. 1974;351:309. Available from: Link
- Fonseca CA, Al-Ansari N, Silva RM, Santos CA, Zerouali B, Oliveira DB, Elbeltagi A. Investigating relationships between runoff–erosion processes and land use and land cover using remote sensing multiple gridded datasets. ISPRS Int. J. Geo-Inf. 2022;11(5):272. DOI
- Ghalehteimouri KJ, Ros FC, Rambat S, Nasr T. Spatial and temporal water pattern change detection through the normalized difference water index (NDWI) for initial flood assessment: A case study of Kuala Lumpur 1990 and 2021. J. Adv. Res. Fluid Mech. Therm. Sci. 2024;114(1):178–87. DOI
- Forkel M, Carvalhais N, Verbesselt J, Mahecha MD, Neigh CS, Reichstein M. Trend change detection in NDVI time series: Effects of inter-annual variability and methodology. Remote Sens. 2013;5(2):504–23. DOI
- Naserikia M, Hart MA, Nazarian N, Bechtel B. Background climate modulates the impact of land cover on urban surface temperature. Sci. Rep. 2022;12:15369. DOI
- Pirotti F, Parraga MA, Sturaro E. NDVI from Landsat 8 vegetation indices to study movement dynamics of Capra ibex in mountain areas. Int. Arch. Photogramm. Remote Sens. Spat. Inf. Sci. 2014;XL-7:147–52. DOI
- Sharma LK, Bali SK. Prediction of maize (Zea mays L.) population using normalized-difference vegetative index (NDVI) and coefficient of variation (CV). J. Plant Nutr. 2019;42(7):717–29. DOI
- Gao, B. C. NDWI—A normalized difference water index for remote sensing of vegetation liquid water from space. Remote Sens. Environ. 1996;58(3):257–66. DOI
- Xu, H. Modification of normalised difference water index (NDWI) to enhance open water features in remotely sensed imagery. Int. J. Remote Sens. 2006;27(14):3025–33. DOI
- Ahmed N, Akter R. Analysis of landcover change in southwest Bengal delta due to floods by NDVI, NDWI and K-means cluster with Landsat multi-spectral surface reflectance satellite data. Data Brief. 2017;12:11–5. DOI
- Bidgoli RD, Koohbanani H, Keshavarzi A, Kumar V. Measurement and zonation of soil surface moisture in arid and semi-arid regions using Landsat 8 images. Arab. J. Geosci. 2020;13(17):826. DOI
Cite this article:
Ayek, A. A. E., Zerouali, B., Loho, M. A., Bailek, N., Santos, C. A. G., Eid, S., Karmoka, S. F. Evaluating the impact of digital number to surface reflectance conversion on the accuracy of NDVI and NDWI: A case study of Sabkhat Al-Jabbul, Syria. DYSONA – Applied Science, 2025;6(2): 452-464. doi: 10.30493/das.2025.504896