Abdullah Alkaddour 1; Mirna Ahmad Shaddoud 2*; Masoumeh Hashemi 3; Fares Mahmoud 4,5; Muhannad Hammad 6; Youssef M. Youssef 7; László Mucsi 8
1, Department of Topography, Faculty of Civil Engineering, Aleppo University, Aleppo, Syria
2, Geography Department, Faculty of Arts and Humanities, Tartous University, Tartous, Syria
3, Plant, Soil and Climate Department, Utah State University, Logan, UT 84322, USA
4, Institute of Geography (GIUB), University of Bern, Hallerstrasse 12 CH-3012 Bern, Switzerland
5, Institute of Geography and Sustainability (IGD), University of Lausanne, UNIL-Mouline, Géopolis CH-1015 Lausanne, Switzerland
6, Department of Physical Geography, Faculty of Geosciences, Utrecht University, 3584 CS Utrecht, Netherlands
7, Geological and Geophysical Engineering Department, Faculty of Petroleum and Mining Engineering, Suez University, Suez, Egypt
8, Department of Atmospheric and Geospatial Data Science, Faculty of Science and Informatics, University of Szeged, Szeged 6722, Hungary
E-mail:
mirnashaddoud@tartous-univ.edu.sy
Received: 29/03/2025
Acceptance: 16/07/2025
Available Online: 24/07/2025
Published: 01/01/2026

Manuscript link
http://dx.doi.org/10.30493/DAS.2025.514366
Abstract
Flooding is a natural hazard that becomes increasingly devastating in urban areas when it endangers human life. Determining areas most susceptible to flooding is the initial phase of hydrological management. Integrating multiple criteria into the spatial flood assessment process enhances dependability. This study sought to evaluate flood susceptibility in the Quwaiq River Basin located in northeastern Syria through the Analytical Hierarchy Process (AHP). For that purpose, ten factors were employed to assess flood risk. Remote sensing (RS) and geographic information systems (GIS) data were utilized to ascertain the spatial distribution of flood criteria. Flood susceptibility was categorized into five classes: very low, low, moderate, high, and very high. These categories were found to represent 12.36%, 25.43%, 28.36%, 23.30%, and 10.55% of the study area, respectively. Out of the 103 neighborhoods within the urban area of Aleppo City, 18, 22, 37, 19, and 7 neighborhoods were located at very low, low, moderate, high, and very high flood susceptibility areas, respectively. The flood hazard susceptibility map of the Quwaiq River Basin in Aleppo City serves as a dependable instrument for hydrological management, facilitating sustainable planning and environmental preservation. The flood hazard susceptibility map allows decision-makers and planners to implement preventive steps to reduce flood risk.
Keywords: Flood susceptibility mapping, AHP, GIS, Urban flood, Aleppo
Introduction
Floods are among the most catastrophic natural disasters, disrupting ecosystems, damaging infrastructure, and causing economic and human losses [1][2]. In recent decades, the intensity of flood risk has escalated due to a confluence of natural and anthropogenic forces [3]. Climate change, altered precipitation patterns, and intricate topographical features, exacerbates the intensity of flooding [4][5]. The frequency of flooding is also influenced by population increase, urbanization, dam construction, alterations in land use, and inadequate drainage systems in urban areas [6][7].
In Mediterranean regions, river basin ecosystems serve as the principal zones for urbanization and commercial endeavors, making them susceptible to the most catastrophic flood disasters [8][9]. In this context, urban systems in the Eastern Mediterranean are experiencing a rising frequency of floods [10]. The inherent characteristics of river basins in the Eastern Mediterranean, combined with human activities and inadequate infrastructure, intensify the frequency of flooding [11]. The risk of flooding is particularly heightened in regions employing conventional natural hazard planning methodologies [12-14]. Moreover, the absence of anticipatory and proactive flood event preparation exacerbates the risk severity [15][16].
Multiple localities in Syria are repeatedly encountering flash floods, leading to significant repercussions at many levels [17][18]. Therefore, mapping flood risk in each flood prone region is a crucial initial step in the context of sustainable development [19][20]. However, conventional field surveys and measurements fail to offer a comprehensive spatial overview of the regions most susceptible to flooding. The precision of the findings can be validated by pinpointing several sites and performing field surveys to align with the spatial simulation [21]. In this regard, Remote sensing (RS) data, Digital Elevation Models (DEMs), and satellite photos serve as dependable simulation instruments [22][23]. DEMs offer high-resolution delineation of river basins and topography features [24]. The representations facilitate the observation of evolving population distributions and land use patterns within river systems [25]. Moreover, the amalgamation of geographic information systems (GIS) and remote sensing (RS) data enhances precise spatial simulations, hence facilitating flood risk mapping [26][27].
Numerous methodologies exist to evaluate and delineate the most susceptible regions to flooding. [28-30]. Machine learning (ML) and deep learning (DL) algorithms, when integrated with GIS, provide exceptional efficacy in forecasting urban flood hazard susceptibility, provided that adequate data is accessible [31][32]. Nonetheless, Multi-Criteria Decision (MCD) methods, such as the Analytical Hierarchy Process (AHP), have demonstrated objectivity in forecasting flood hazard susceptibility [33][34]. Incorporating the previously described modeling techniques within a GIS framework yields more dependable thematic maps across diverse urban systems [35][36]. The majority of research in Syria has been on assessing flood risk, especially in western [17] and southern regions [18]. However, research on flood sites in northern Syria is limited.
The northern region of Syria has experienced significant changes in precipitation patterns and a higher risk of flooding due to fast evolving climatic scenarios [37]. The main aim of this study is to delineate the flood risk profile of the Quwaiq River Basin in Aleppo Governorate, northern Syria. Employing MCD-AHP to define the flood risk profile of the region may produce a more accurate spatial representation to aid hydrologists in developing necessary hydrological conservation and maintenance strategies. The importance of this construction is emphasized by the Quwaiq River flowing through the populous city of Aleppo.
Material and Methods
Study area
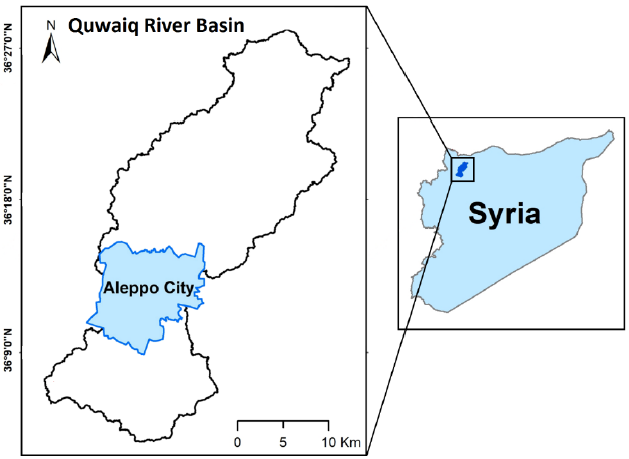
The Quwaiq River basin is located in the eastern region of the Mediterranean basin. It is situated in the northwest region of Syria, within Aleppo governorate, encompassing an area of 626.73 km², positioned between latitudes 35° 53ʹ–36° 07ʹ N and longitudes 35° 00ʹ–35° 18ʹ (Fig. 1).
Data
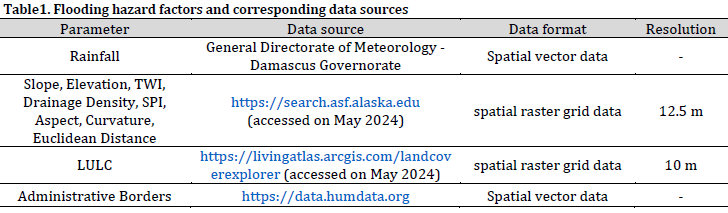
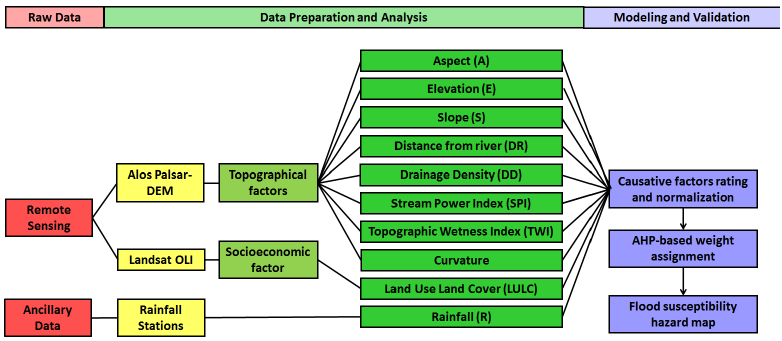
Effectively evaluating flood hazard susceptibility necessitates the collection and analysis of diverse spatial datasets that include numerous environmental and climatic parameters affecting flood risks. This comprehensive method is crucial for pinpointing flood-prone regions and developing efficient mitigation solutions. The flood danger elements evaluated in this study (Table 1) were determined through a literature analysis and fieldwork [38-41]. Rainfall data, obtained from the General Directorate of Meteorology in the Damascus Governorate, was utilized for climate analysis in spatial vector format. The Slope, Elevation, Topographic Wetness Index (TWI), Stream Power Index (SPI), Aspect, Curvature, and Euclidean distance were obtained from the Earth Explorer website of the United States Geological Survey (USGS). The data is provided in raster spatial grid format with a spatial resolution of 12.5 meters. The Land Use/Land Cover (LULC), obtained from Sentinel 2 images of May 2024, was accessed from the USGS Earth Explorer website in May 2024 as a raster spatial grid data format with a resolution of 10 meters. Ultimately, administrative boundaries were obtained as specialized vector data via the Humanitarian Data Exchange website.
Mapping flood hazards susceptibility
Mapping flood susceptibility hazards is essential for identifying at-risk locations, facilitating effective planning and mitigation techniques to reduce potential damage [39][42-45]. It offers essential data for legislators, urban planners, and disaster response teams to allocate resources effectively, safeguard infrastructure, and maintain community safety. After data acquiring, the obtained datasets were processed and AHP analysis was conducted in order to obtain flood susceptibility hazard map of the studied area (Fig. 2).
Analytic hierarchy process (AHP)
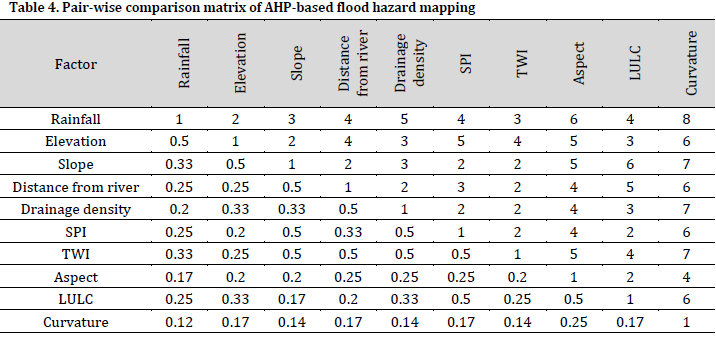
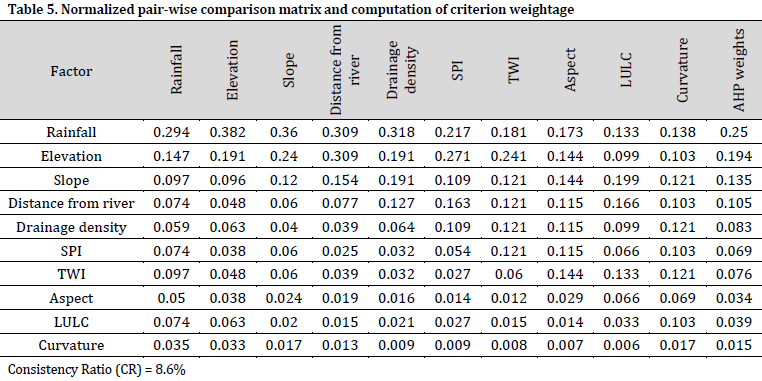
Assigning weights to various factors involved in flood risk assessment is fundamental in creating a reliable flood susceptibility map. These factors, including Rainfall (R), Elevation (E), Slope (S), Distance from river (DR), Drainage Density (DD), Stream Power Index (SPI), Topographic Wetness Index (TWI), Aspect (A), Land Use Land Cover (LULC), and Curvature (C), are ranked based on their relative importance in contributing to the flood risk of a particular area. The Analytical Hierarchy Process (AHP) method is employed to assign these weights [46]. AHP involves pairwise comparisons of the factors, which are used to derive the weights that reflect their relative importance. These weights are then normalized so that their sum equals one, ensuring a proportional representation of each factor in the flood risk model.
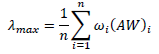
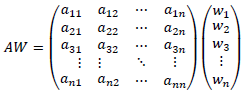
The calculation of the maximum eigenvalue (λmax) is central to this process and is given by the formula:
where AW represents the matrix product of the pairwise comparison matrix A and the weight vector , and A contains elements , which represents the relative importance of factor i over factor j (Table 2). The weight vector ω contains the assigned weights for each factor. The pairwise comparison matrix AW is structured as follows:
To ensure the reliability of the results, the consistency of the pairwise comparisons is assessed. The Consistency Index (CI) is calculated using the formula:
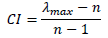
where n is the number of criteria (factors). The final step is to compute the Consistency Ratio (CR) to evaluate the degree of consistency in the pairwise comparisons:

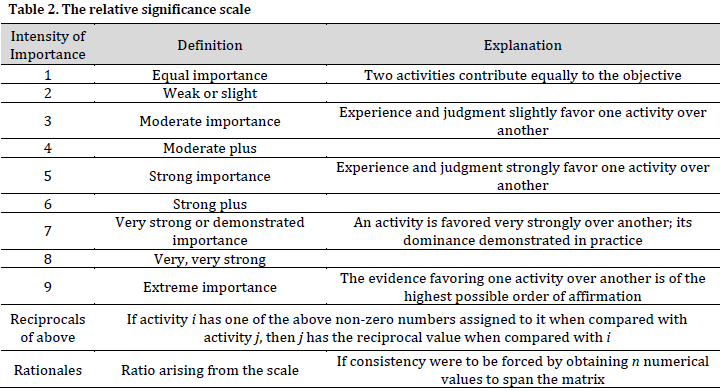
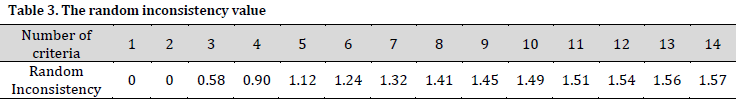
where RI is the Random Index, which depends on the number of criteria. If the CR is less than or equal to 0.1, the consistency is considered acceptable [47] (Table 3). If the CR exceeds this threshold, the pairwise comparison matrix must be revised to improve consistency. This process ensures that the AHP method is applied robustly, and the resulting flood susceptibility map reflects reliable and consistent weightings for the contributing factors.
Results and Discussion
Conditioning factors
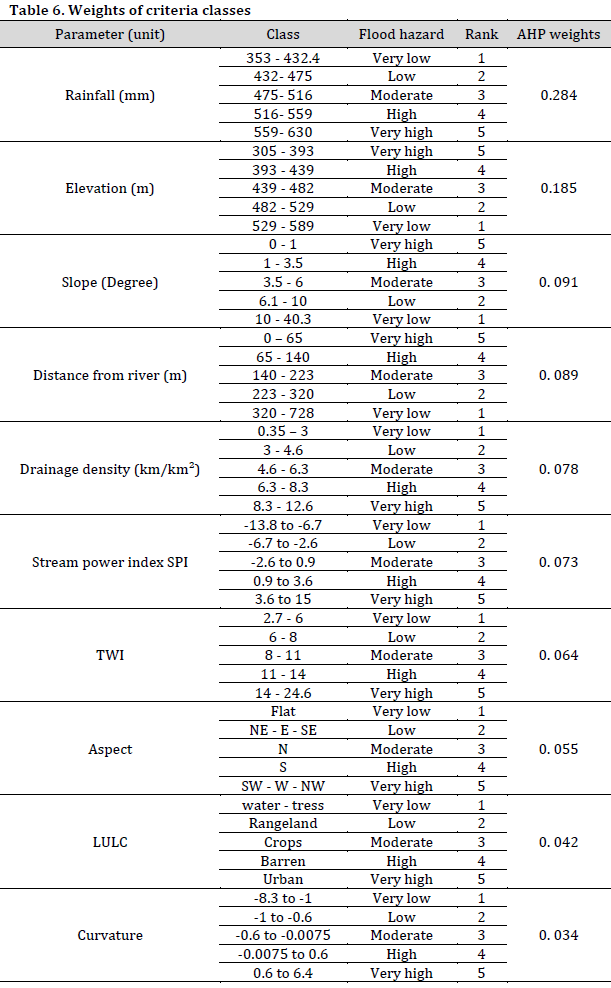
Flood susceptibility class within the study area was analyzed based on the ten conditioning factors. Ten raster layers were generated for each flood modeling criterion. The outcomes of the pairwise comparison matrix (Table 4 and 5) was utilized to ascertain the weights of the principal criterion. Each raster was evaluated and assigned a rank based on five scores (1 to 5), corresponding to the flood effect threshold. The prioritization of each flood criterion facilitates the precise delineation of the final vulnerability map.
Rainfall (R)
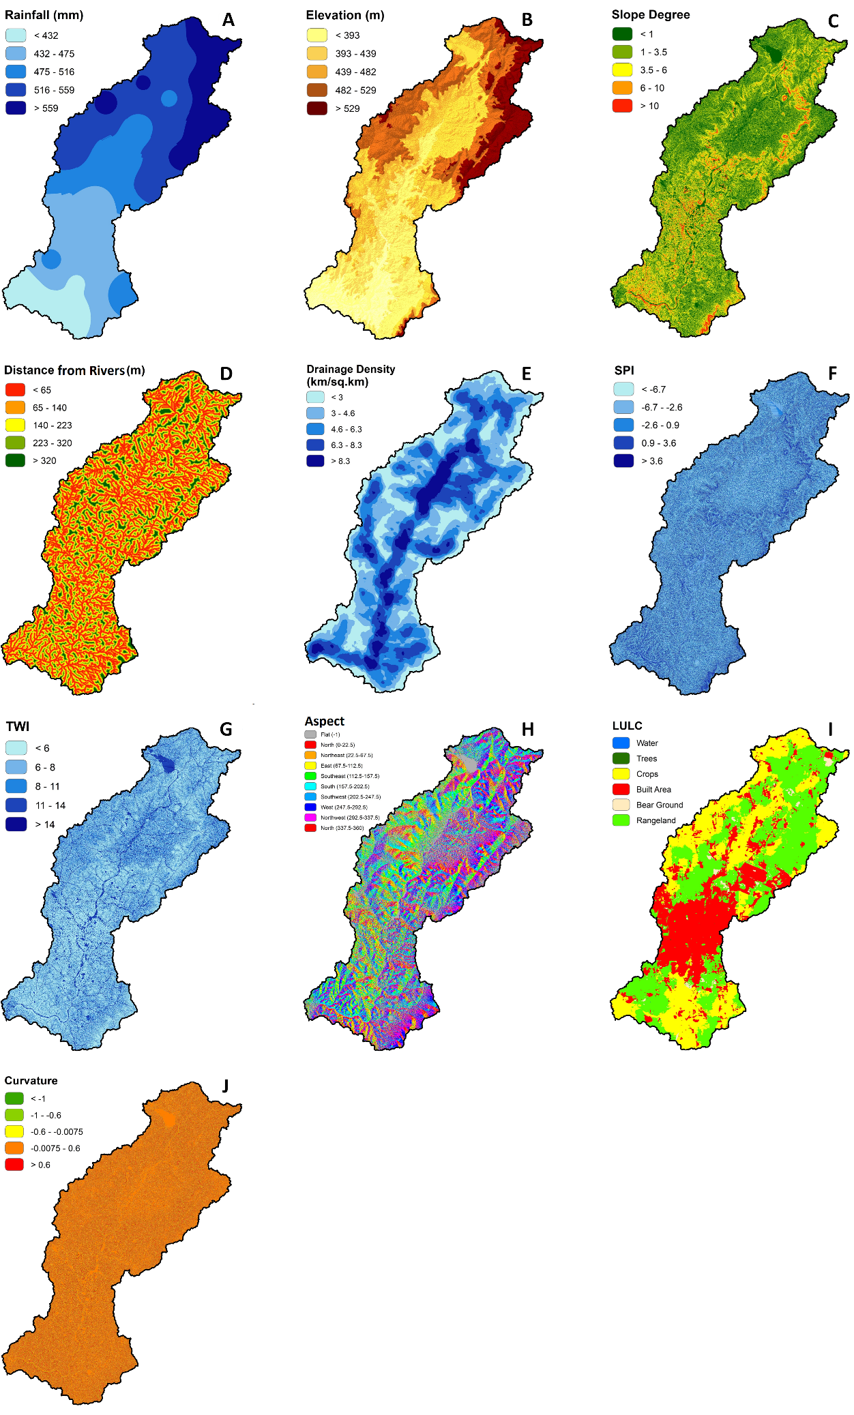
The yearly precipitation in the study area varies from 353 mm to 630 mm (Fig. 3 A). R values increase from the southern toward the areas with higher altitudes. R values are categorized into five classifications based on flood susceptibility severity: very low (353-432 mm), low (432-475 mm), moderate (475-516 mm), high (516-559 mm), and very high (559-630 mm) (Table 6). Since flood susceptibility escalates with increased R values, flood susceptibility values are expected to increase in the northeastern and north-central regions (Fig. 3 A).
Precipitation is integral to flood risk evaluation, markedly affecting the probability and intensity of flooding [43]. The intensity, duration, and frequency of rainfall are essential factors in flood formation. Intense or protracted rainfall episodes result in soil saturation, diminishing the ground’s ability to absorb water and thus increasing surface drainage. This is especially problematic in regions with little drainage, where significant flooding may occur. The spatial distribution of rainfall significantly influences the accumulation of water, potentially inundating local watercourses and drainage systems. In metropolitan areas, wide impermeable surfaces intensify flooding threats, since a modest precipitation episode can result in significant runoff peaks due to diminished penetration. The variability in precipitation patterns, exacerbated by climate change, affects flood risk forecasts. This underscores the necessity of accounting for rainfall variability and its evolving patterns in the formulation of thorough flood risk assessments and management methods.
Elevation (E)
Low E values are categorized as more vulnerable to floods. Consequently, E values were classified into five groups based on the severity of flood risk: Very low (529–589 m), low (482–529 m), moderate (439–482 m), high (393–439 m), and very high (305–393 m) (Table 6). It was noted that the spatial distributions of R correlated with elevation (Fig. 3 A and B).
Elevation is crucial in flood risk assessment as it influences the flow and buildup of floodwaters. Low-lying areas are particularly susceptible to flooding because of their inherent propensity to accumulate water from elevated terrains, often worsened by their inefficient drainage capabilities. These regions function as principal sites for water accumulation, rendering them more vulnerable to extended and intense flooding. In contrast, elevated areas, although less susceptible to direct inundation, substantially increase flood hazards downstream. Runoff higher locations can augment water volume and flow velocity in lower areas, intensifying flood severity and broadening the affected zones [42].
Topographical changes significantly affect the velocity and trajectory of surface water flow. In areas with steep gradients, water can flow swiftly, eroding riverbanks and altering floodplains, potentially establishing new flood-prone areas. Comprehending these processes is essential for identifying vulnerable zones and formulating appropriate mitigation strategies.
Integrating elevation data into flood risk assessment yields critical insights into water flow patterns and hydrodynamics. This knowledge is crucial for formulating tailored flood protection plans, including protective infrastructure for low-lying regions and runoff management in elevated terrains. A thorough comprehension of elevation’s influence on flooding facilitates more accurate planning and enhances flood resilience at local and regional levels, ensuring a proactive flood management strategy.
Slope (S)
Similar to elevation, Low S values are associated with higher flood risk. Therefore, the S-factor values were categorized into five classes based on flood risk severity: Very low (10-40.3°), low (6-10°), moderate (3.5-6°), high (1-3.5°), and very high (0-1°) (Table 6). Based on E and S criteria, the regions most susceptible to flooding are clustered along river courses in the northern, middle, and southern areas (Fig. 3 B and C).
Slope (Fig. 3 C) is an essential topographical characteristic in flood risk evaluation, as it significantly influences flood dynamics and surface water movement. Steeper gradients promote swift water movement, potentially elevating runoff speed, exacerbating soil erosion, and increasing the likelihood of abrupt and severe flooding. This fast movement frequently results in the quick convergence of water, especially in river channels or steep valleys, increasing flood risks and intensifying downstream effects [42][48]. Conversely, level landscapes impede water flow, facilitating accumulation and heightening the probability of localized flooding. Such regions may experience extended water accumulation, exacerbating drainage issues and heightening flood threats. Furthermore, slope affects rainwater infiltration and groundwater recharge, hence influencing the hydrological attributes of an area and its susceptibility to flooding.
In urban environments, modified gradients resulting from infrastructure, including edifices and thoroughfares, can interfere with natural hydrological processes. These alterations may channel floodwaters or concentrate runoff in undesired locations, exacerbating urban flood hazards. Therefore, integrating slope analysis into flood risk assessments improves the prediction of high-risk areas by elucidating the influence of slope on water flow and accumulation. This information is crucial for formulating successful flood mitigation strategies, including erosion control structures, runoff management systems, and urban drainage planning. By addressing slope-related dynamics, flood management solutions can be customized to reduce hazards in both natural landscapes and constructed contexts, thereby facilitating proactive urban planning and catastrophe preparedness.
Distance from Rivers (DR)
Low DR values indicate higher vulnerability to flood risk. DR values in the study area were categorized into five tiers based on escalating flood risk severity: Very low (320-728 m), low (223-320 m), moderate (140-223 m), high (65-140 m), and very high (0-65 m) (Table 6). The locations most vulnerable according to the DR criteria are located in the northern, central, and southern areas where river routes are prevalent (Fig. 3 D).
Distance from River is a critical metric in flood risk assessment, providing insights into an area’s susceptibility to river-related flooding. Regions adjacent to rivers face increased vulnerability, particularly during instances of intense precipitation or substantial elevations in river levels. When rivers inundate, neighboring low-lying areas are generally the initial sites of floods, rendering disaster risk a crucial factor for hazard forecasting and alleviation. Furthermore, DR affects groundwater dynamics since proximity to rivers can result in heightened groundwater levels, particularly in low-lying regions, hence augmenting the danger of soil saturation and surface water buildup during significant hydrological events [43]. This interaction frequently intensifies prevailing flood conditions, highlighting the necessity of managing water resources in regions next to rivers.
Urban areas adjacent to rivers necessitate improved flood defense measures. Urban rivers often function both as natural waterways and as elements of drainage systems, requiring coordinated planning to reduce dangers. DR is similarly important in rural areas, as agricultural and residential zones adjacent to rivers are more susceptible to the detrimental effects of flooding [38]. Consequently, effective flood risk management methods should integrate DR factor to identify high-risk areas and prioritize preventive measures.
Drainage Density (DD)
Drainage density directly results from the interplay of climatic and topography elements within the hydrological sequence. DD indicates the intensity of river flows subsequent to precipitation. Elevated DD values identified areas with increased flood risk. Consequently, DD values were classified into five groups based on increasing flood danger severity: Very low (0.35 – 3 km/km²), low (3 – 4.6 km/km²), moderate (4.6 – 6.3 km/km²), high (6.3 – 8.3 km/km²), and very high (8.3 – 12.6 km/km²). Table 6. The most susceptible areas, as per the DD criterion, are situated along the watercourse throughout the research region (Fig. 3 E).
Drainage Density is an essential factor in flood risk evaluation, estimating the proportion of drainage networks to the total area of a location. It offers significant information into the efficacy of a landscape in managing surface water runoff. Areas with elevated drainage density, marked by large river or drainage channel networks, typically possess a superior ability to manage rainfall-induced surface water, thus reducing flood risks. Conversely, regions with poor drainage density, characterized by infrequent drainage routes, frequently encounter difficulties in efficiently discharging surface water, hence heightening the risk of water collection and flooding [49].
The density of drainage critically affects the movement and allocation of surface water. High-density regions can swiftly channel water into larger water bodies, diminishing the probability of extended water accumulation. Conversely, low-density areas are susceptible to water accumulation during intense or prolonged rainfall, increasing the risk of localized floods. Moreover, drainage density influences soil erosion and runoff quality. Although dense networks promote rapid water flow, they may also hasten erosion, diminishing soil quality and impacting vegetation sustainability.
Comprehending drainage density is crucial for efficient flood management and land-use planning. Through the analysis of drainage patterns, planners may pinpoint susceptible regions, devise effective water management systems, and enact strategies to mitigate erosion and flood hazards.
Stream Power Index (SPI)
The Stream Power Index (SPI) considers the spatial variance between stream intensity and topographical features. The SPI values categorize stream strength into five tiers based on escalating flood danger severity: Very low (-13.8 to -6.7), low (-6.7 to -2.6), medium (-2.6 to 0.9), high (0.9 to 3.6), and very high (3.6 to 15) (Table 6). SPI values are predominantly concentrated along the watercourse, as well as in the northeastern and north-central regions (Fig. 3 F).
The Stream Power Index (SPI) is a crucial topography characteristic utilized in flood risk evaluations, as it quantifies the potential energy present in a stream or river system for erosion and sediment transport [48]. The SPI integrates data regarding land gradient and the associated drainage area, offering insights into the velocity and intensity of water flow within a region. Elevated SPI values generally signify sites with pronounced slopes and extensive drainage basins, where water movement is accelerated, hence enhancing erosion potential and elevating flood risk.
SPI is crucial for detecting regions vulnerable to severe erosion, streambed deterioration, and sediment accumulation, all of which can affect flooding. Areas with elevated SPI values are more prone to heightened runoff and subsequent floods downstream, particularly after intense precipitation events. Through the analysis of SPI, flood risk assessments can identify high-energy flow zones necessitating focused flood management and erosion control interventions, hence enhancing flood prevention and response methods in susceptible areas.
Topographic Wetness Index (TWI)
The Topographical Wetness Index (TWI) rises in the flat and low-lying regions of the research area. TWI values were categorized into five classifications based on flood risk severity: Very low (2.7-6), low (6-8), medium (8-11), high (11-14), and very high (14-24.6) (Table 6). TWI data indicate the locations of water retention and stagnant water regions in the northern sections and along the streams within the study area (Fig. 3 G).
The Topographic Wetness Index (TWI) is an essential instrument in flood risk evaluation, acting as a terrain-based metric for the potential accumulation of surface water. By integrating data on slope and upstream catchment areas, TWI offers a comprehensive insight into the interaction of water with the landscape across diverse topographic situations. Elevated TWI readings generally indicate places susceptible to water accumulation, such as level or low-lying terrain, hence increasing their risk of flooding. Conversely, areas with low TWI values, typically marked by steep gradients or effective drainage, have less flood danger owing to accelerated water runoff. TWI is crucial in identifying regions vulnerable to flooding, especially where topographical characteristics inherently promote water retention and stagnation. This renders it an effective instrument for predicting flood-prone areas during episodes of heavy or extended precipitation. In addition to flood risk assessment, TWI is essential for pinpointing wetlands and low-lying ecosystems, which are vital for natural water retention and flood mitigation.
TWI analysis facilitates informed decision-making in both urban and rural settings by identifying high-risk locations and directing infrastructure development, land-use planning, and water management methods. Utilizing TWI data, planners can adopt proactive strategies to mitigate flood effects, improve drainage systems, and bolster the resilience of natural environments and human communities against extreme weather occurrences.
Aspect (A)
The northern and northwestern regions are more humid and susceptible to water accumulation, while the southern and southwestern slopes were deemed more vulnerable to snowmelt and seasonal inundation (Fig. 3 H). The slope aspects were categorized into five classifications based on flood risk severity: Very low (flat), low (northeast), moderate (north), high (south), and very high (southwest, south, and southeast) (Table 6).
Aspect, denoting the orientation of a slope, significantly influences local climatic conditions, vegetation, and hydrology, all of which affect flood risk. South-facing slopes in the northern hemisphere generally exhibit drier conditions, whereas north-facing slopes, receiving diminished sunlight, are usually wetter [43]. These fluctuations can influence soil moisture and vegetation cover, hence impacting runoff patterns. Regions characterized by moist conditions are more susceptible to surface water collection, hence heightening the risk of flooding during intense precipitation.
Moreover, aspect affects the pace of snowmelt and evaporation, which are critical elements in flood dynamics, especially in mountainous areas. South-facing slopes may undergo faster snowmelt, resulting in accelerated runoff and increased flood hazards, whereas north-facing slopes may retain snow for an extended duration, influencing seasonal flooding patterns. Comprehending and incorporating aspect in flood risk assessments can facilitate precise predictions of flood-prone regions, aiding in the development of enhanced flood mitigation methods and the more effective management of water resources.
Land Use Land Cover (LULC)
Urbanized regions were deemed more susceptible to flooding., while forests and grasslands diminish runoff velocity, hence decreasing flood danger. The data was resampled from 10 m to 12.5 m to maintain compatibility with other datasets. Land use categories were classified into five grades based on escalating flood risk severity: Very low (water – trees), low (rangeland), moderate (crops), high (barren), and very high (urban) (Table 6). Urban areas were concentrated in the middle-southern regions (mainly represented by Aleppo city) and dispersed throughout of the study area (Fig. 3 I).
Land Use and Land Cover (LULC) is a pivotal element in flood risk assessment, profoundly influencing the dynamics of surface water transport, infiltration, and buildup. Alterations in land use and land cover (LULC) directly impact rainfall runoff dynamics, affecting the frequency and distribution of floods.
Urban areas, characterized by impermeable surfaces like concrete and asphalt, impede water infiltration, leading to heightened surface runoff. This phenomenon is especially evident in densely urbanized areas, where substantial rainfall frequently results in increased flood hazards [38][48]. In contrast, natural landscapes such as woods and grasslands enhance water infiltration and retention, decreasing runoff velocity and alleviating flood hazards.
Alterations in land use and land cover, such as urban expansion, forestation and deforestation, or land utilization, alter regional hydrological cycles. These modifications can either enhance or reduce flood vulnerability by altering natural water routes and storage capabilities. Deforestation can result in decreased water absorption, leading to increased surface runoff, whereas urban development frequently intensifies flooding due to less permeable surfaces.
Examining land use and land cover patterns and their alterations is essential for forecasting flood-prone regions and formulating efficient flood management plans. Integrating land use and land cover evaluations into flood prevention planning enables stakeholders to formulate adaptive land use policies that reconcile development with hydrological sustainability, thereby boosting flood resilience and encouraging sustainable water resource management.
Curvature (C)
The crustal regions were categorized into five classifications based on the intensity of flood hazard vulnerability: Very low (-8.3 to -1), low (-1 to -0.6), moderate (-0.6 to -0.0075), high (-0.0075 to 0.6), and very high (0.6 to 6.4) (Table 6). It is worth noting that the predominant portion of the study area is classified within high and very high susceptibility (Fig. 3 J).
Curvature, an essential topographic characteristic, profoundly affects flood risk by dictating the movement of water across the terrain. Concave regions, characterized by an inward curvature of the land surface, are prone to water accumulation, hence heightening the risk of floods, particularly after substantial precipitation events. Conversely, convex surfaces that curve outward promote the drainage of water, hence diminishing flood danger in those regions [43]. Curvature influences erosion and sedimentation, since concave parts are susceptible to increased erosion rates, but convex areas may facilitate sediment transfer downstream, thus modifying flood dynamics over time.
In urban environments, anthropogenic alterations, like roads and structures, can disrupt the natural hydrological flow, rendering curvature analysis vital for precise flood risk evaluation. Comprehending curvature aids in pinpointing flood-prone regions, particularly in places characterized by intricate topography. Integrating curvature with additional topography and hydrological data can facilitate the development of more efficient flood management techniques, thereby mitigating flood risks and enhancing water resource management.
Flood susceptibility hazard map
Using pair-wise comparison matrix (Table 4) and the normalized pair-wise comparison matrix (Table 5), the final weights for the flood hazard drivers were calculated. Consequently, a flood hazard susceptibility index formula was developed:
Flood hazard susceptibility index = (R×0.250) + (E×0.194) + (S×0.135) + (DR×0.105) + (DD×0.083) + (SPI×0.069) + (TWI×0.076) + (A×0.034) + (LULC×0.039) + (C×0.015)
This formula was applied in a GIS environment, producing a flood risk map for the study basin (Fig. 4). It is noted from the risk map that high and very high spatial hazard susceptibility is concentrated in the central and southern parts of the study area. Furthermore, it can be noted that these hazardous areas are distributed along the drainage network. Thus, floodplain areas are generally considered high-risk areas. However, these areas constitute the economic basis for the population of the study area.
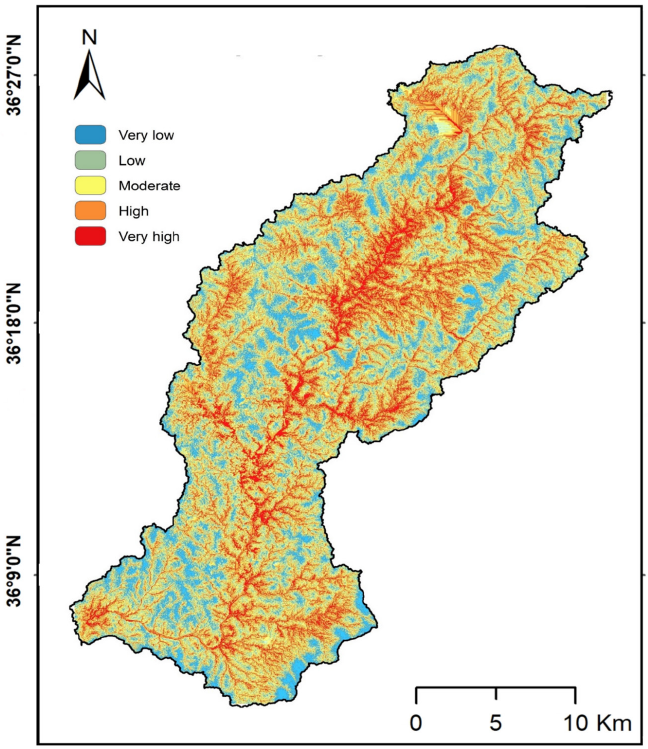
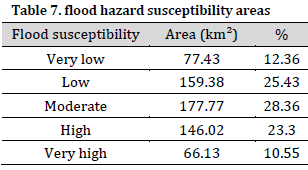
Using the Natural Breaks tool in a GIS environment, flood hazard susceptibility was classified into five categories, including very low (77.43 km²), low (159.38 km²), moderate (177.77 km²), High (146.02 km²), very high (66.13 km²) (Table 7). In this regard, it was found that the proportion of high and very high flood hazard susceptibility areas in the study area exceeds 23% of the total area. This indicates the need to accelerate the implementation of flood risk management measures in the study area.
It is noted that high and very high flood susceptibility was identified in the north-central, central, and southern parts of the basin. This is explained by the interrelationship between rainfall and runoff within the basin. The primary drivers of the concentration of large amounts of runoff in the north-central parts are elevation and slope. The spatial confinement of river channels, discharge density, and stream strength is correlated with precipitation, elevation, and slope. The hierarchical relationship between these factors is an influential factor in increasing flood risk. Moreover, flood susceptibility is highest in areas surrounding the main channels in the flat north-central parts and in floodplain areas in the southern parts.
The extent of flood risk along river courses decreases between the northern and southern regions. This decrease is explained by the fact that the runoff flows over a long distance. As a result, the runoff loses a significant amount of energy and sediment.
Flood susceptibility in the neighborhoods of Aleppo city
The city of Aleppo constitutes the largest urban area within the studied region, comprising more than 19% of the total study area. Aleppo’s neighborhoods are characterized by their ancient, interlocking design. The floodplain, the proximity to the Quwaiq river, and the flat terrain are the reasons for the large number of neighborhoods in the southern part of the basin and, ultimately, the emergence of Aleppo.
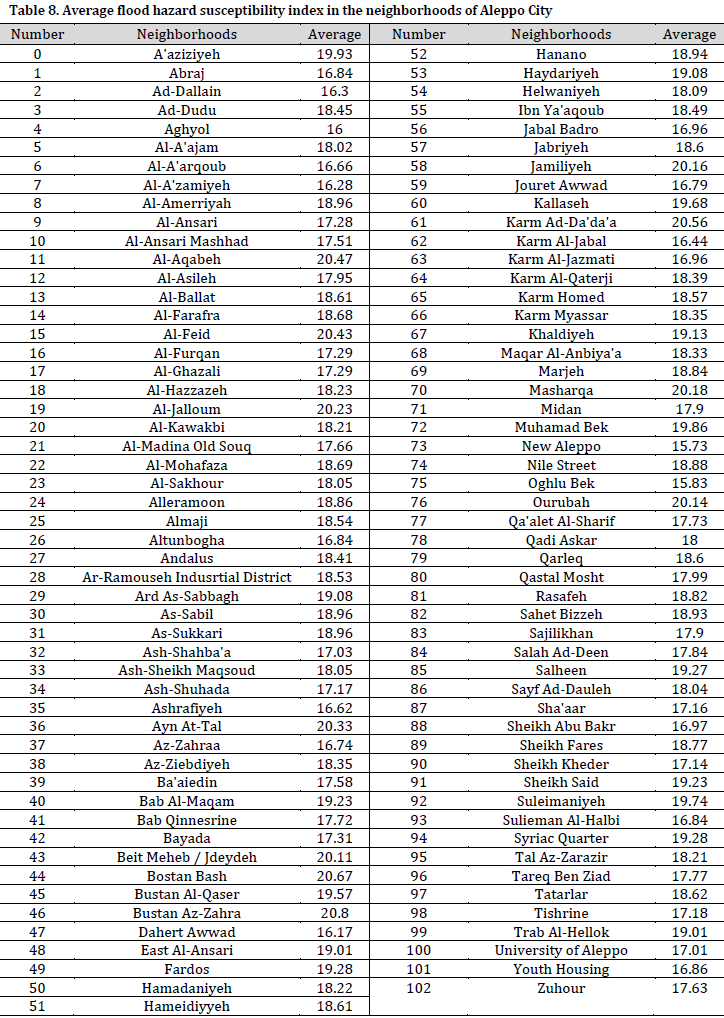
To maximize the benefit of the resulting flood hazard susceptibility map, the flood susceptibility was investigated across Aleppo city neighborhoods. Each neighborhood was assigned a number to determine its flood risk intensity based on the calculated flood hazard index equation (Table 8).
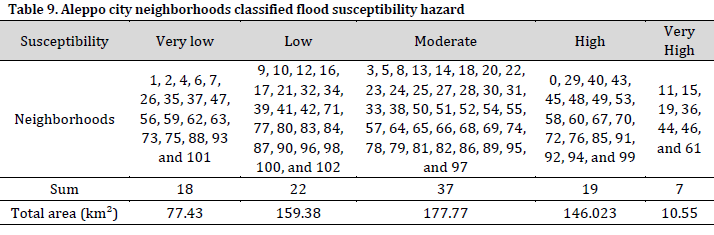
Based on the calculated flood risk intensity, the flood risk map of the neighborhoods of Aleppo city was constructed (Fig. 5). The map was divided into five flood risk categories: very low (18 neighborhoods), low (22 neighborhoods), moderate (37 neighborhoods), high (19 neighborhoods), and very high (7 neighborhoods) (Table 9).
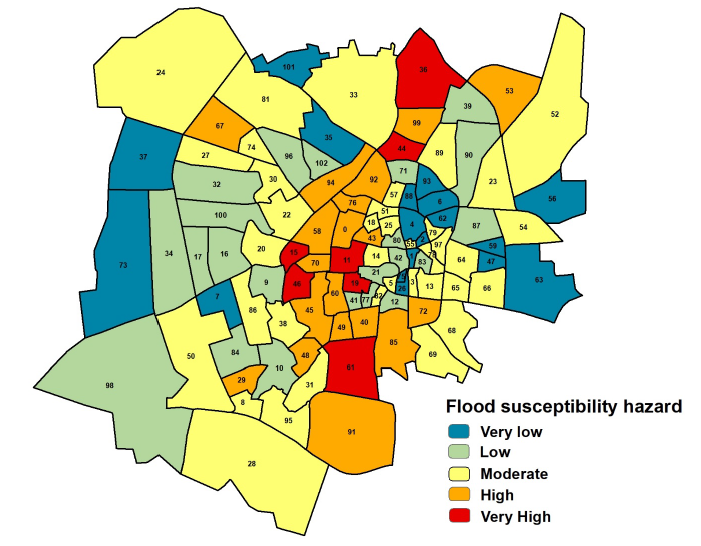
The delineated neighborhoods with high and very high flood susceptibility index represent impermeable land use, exacerbating the likelihood of floods. Neighborhoods with a very high flood susceptibility index, including Al-Aqabeh, Al-Feid, Al-Jalloum, and Bustan Az-Zahra (neighborhoods 11, 15, 19, and 45, respectively), together with adjacent areas of high flood susceptibility index, are located within the old city center of Aleppo. These districts are distinguished by their classic architecture and, consequently, exhibit reduced reliance on contemporary infrastructure. This necessitates substantial and strategic interventions in these neighborhoods using revised methodologies to alleviate the flooding danger.
Conclusion
Multi-criteria assessment is a prevalent tool in natural hazards mapping. Flooding constitutes a natural hazard that jeopardizes environmental sustainability in urban river basins within the Eastern Mediterranean. Consequently, multi-criteria assisted flood risk mapping is the primary objective of numerous contemporary studies. This study involved flood susceptibility mapping in the Quwaiq River Basin utilizing a GIS environment and ten fundamental factors: Rainfall (R), Elevation (E), Slope (S), Distance from River (DR), Drainage Density (DD), Stream Power Index (SPI), Topographic Wetness Index (TWI), Aspect (A), Land Use Land Cover (LULC), and Curvature (C). Flood susceptibility was classified into five categories: very low, low, moderate, high, and very high. The categories constituted 12.36%, 25.43%, 28.36%, 23.30%, and 10.55% of the research area, respectively. Moreover, the formulated susceptibility index was utilized in the region of Aleppo city to identify neighborhoods with elevated flood danger. The generated map signifies a crucial advancement in environmental and urban preservation aimed at attaining sustainable development in northern Syria.
Conflict of interest statement
The authors declared no conflict of interest.
Funding statement
The authors declared that no funding was received in relation to this manuscript.
Data availability statement
The authors declared that all used data and data sources are mentioned in the manuscript. All datasets will be available upon reasonable request from the corresponding author.
References
- Jerome Glago F. Flood Disaster Hazards; Causes, Impacts and Management: A State-of-the-Art Review. Nat. Hazards – Impacts, Adjustments Resil. Intech Open, London. 2021. DOI
- Papagiannaki K, Petrucci O, Diakakis M, Kotroni V, Aceto L, Bianchi C, Brázdil R, Gelabert MG, Inbar M, Kahraman A, Kılıç Ö. Developing a large-scale dataset of flood fatalities for territories in the Euro-Mediterranean region, FFEM-DB. Sci. Data. 2022;9(1):166. DOI
- Nkwunonwo UC, Whitworth M, Baily B. A review of the current status of flood modelling for urban flood risk management in the developing countries. Sci. Afr. 2020;7:e00269. DOI
- Cea L, Costabile P. Flood Risk in Urban Areas: Modelling, Management and Adaptation to Climate Change. A Review. Hydrology. 2022;9(3):50. DOI
- Rahayu R, Mathias SA, Reaney S, Vesuviano G, Suwarman R, Ramdhan AM. Impact of land cover, rainfall and topography on flood risk in West Java. Nat. Hazards. 2022;116(2):1735–58. DOI
- Allafta H, Opp C. GIS-based multi-criteria analysis for flood prone areas mapping in the trans-boundary Shatt Al-Arab basin, Iraq-Iran. Geomatics, Nat. Hazards Risk. 2021;12(1):2087–116. DOI
- Rajendran S, Al Kuwari HAS, Sadooni FN, Nasir S, Govil H, Ghrefat H. Remote sensing of desertification and study of temporal variability of aeolian deposits in parts of the Arabian Desert for sustainable development in an arid environment. Environ. Res. 2023;232:116279. DOI
- Du J, Cheng L, Zhang Q, Yang Y, Xu W. Different Flooding Behaviors Due to Varied Urbanization Levels within River Basin: A Case Study from the Xiang River Basin, China. Int. J. Disaster Risk Sci. 2018;10(1):89–102. DOI
- Tramblay Y, Mimeau L, Neppel L, Vinet F, Sauquet E. Detection and attribution of flood trends in Mediterranean basins. Hydrol. Earth Syst. Sci. 2019;23(11):4419–31. DOI
- Ben Dor Y, Armon M, Ahlborn M, Morin E, Erel Y, Brauer A, Schwab MJ, Tjallingii R, Enzel Y. Changing flood frequencies under opposing late Pleistocene eastern Mediterranean climates. Sci. Rep. 2018;8(1):8445. DOI
- Kansal ML, Singh S. Flood Management Issues in Hilly Regions of Uttarakhand (India) under Changing Climatic Conditions. Water. 2022;14(12):1879. DOI
- Mosavi A, Ozturk P, Chau K wing. Flood Prediction Using Machine Learning Models: Literature Review. Water. 2018;10(11):1536. DOI
- Membele GM, Naidu M, Mutanga O. Examining flood vulnerability mapping approaches in developing countries: A scoping review. Int. J. Disaster Risk Reduct. 2022;69:102766. DOI
- Amirmoradi K, Shokoohi A. River Flash Flood Economical Loss and its Uncertainty in Developing Countries. Water Resour. Manage. 2023;38(1):81–105. DOI
- Diakakis M, Papagiannaki K, Fouskaris M. The Occurrence of Catastrophic Multiple-Fatality Flash Floods in the Eastern Mediterranean Region. Water. 2022;15(1):119. DOI
- Hochman A, Marra F, Messori G, Pinto JG, Raveh-Rubin S, Yosef Y, Zittis G. Extreme weather and societal impacts in the eastern Mediterranean. Earth Syst. Dyn. 2022;13(2):749–77. DOI
- Abdo HG. Evolving a total-evaluation map of flash flood hazard for hydro-prioritization based on geohydromorphometric parameters and GIS–RS manner in Al-Hussain river basin, Tartous, Syria. Nat. Hazards. 2020;104(1):681–703. DOI
- Abdo HG, Almohamad H, Al Dughairi AA, Karuppannan S. Sub-basins prioritization based on morphometric analysis and geographic information systems: a case study of the Barada river basin, Damascus countryside governorate, Syria. Proc. Indian Natl. Sci. Acad. 2023;89(2):376–85. DOI
- Demissie Z, Rimal P, Seyoum WM, Dutta A, Rimmington G. Flood susceptibility mapping: Integrating machine learning and GIS for enhanced risk assessment. Appl. Comput. Geosci. 2024;23:100183. DOI
- Mudashiru RB, Sabtu N, Abustan I, Balogun W. Flood hazard mapping methods: A review. J. Hydrol. 2021;603:126846. DOI
- Lin L, Wu Z, Liang Q. Urban flood susceptibility analysis using a GIS-based multi-criteria analysis framework. Nat. Hazards. 2019;97(2):455–75. DOI
- Wang X, Xie H. A Review on Applications of Remote Sensing and Geographic Information Systems (GIS) in Water Resources and Flood Risk Management. Water. 2018;10(5):608. DOI
- El-Aal AA, Radwan AE, Abdelshafy M, Omaar AE, Youssef YM. A Synergistic Use of Remote Sensing and Hydrodynamic Techniques for Flash Flood Mitigation Toward Sustainable Urban Expansion in Najran Valley, Saudi Arabia. Earth Syst. Environ. 2024;8(2):465–82. DOI
- Nguyen BQ, Vo ND, Le MH, Nguyen QD, Lakshmi V, Bolten JD. Quantification of global Digital Elevation Model (DEM)–A case study of the newly released NASADEM for a river basin in Central Vietnam. J. Hydrol.: Reg. Stud. 2023;45:101282. DOI
- Khalil MME, Khodary SM, Youssef YM, Alsubaie MS, Sallam A. Geo-Environmental Hazard Assessment of Archaeological Sites and Archaeological Domes—Fatimid Tombs—Aswan, Egypt. Buildings. 2022;12(12):2175. DOI
- Hossain MdN, Mumu UH. Flood susceptibility modelling of the Teesta River Basin through the AHP-MCDA process using GIS and remote sensing. Nat. Hazards. 2024;120(13):12137–61. DOI
- Ramadan MS, Almurshidi AH, Razali SF, Ramadan E, Tariq A, Bridi RM, Rahman MA, Alshamsi S, Alshamisi M, Alrashdi S. Spatial decision-making for urban flood vulnerability: A geomatics approach applied to Al-Ain City, UAE. Urban Clim. 2025;59:102297. DOI
- Diaconu D, Costache R, Popa M. An Overview of Flood Risk Analysis Methods. Water. 2021;13(4):474. DOI
- Munawar HS, Hammad AWA, Waller ST. Remote Sensing Methods for Flood Prediction: A Review. Sensors. 2022;22(3):960. DOI
- Maranzoni A, D’Oria M, Rizzo C. Quantitative flood hazard assessment methods: A review. J. Flood Risk Manage. 2022;16(1). DOI
- Islam T, Zeleke EB, Afroz M, Melesse AM. A Systematic Review of Urban Flood Susceptibility Mapping: Remote Sensing, Machine Learning, and Other Modeling Approaches. Remote Sens. 2025;17(3):524. DOI
- Al-Ruzouq R, Shanableh A, Jena R, Gibril MB, Hammouri NA, Lamghari F. Flood susceptibility mapping using a novel integration of multi-temporal sentinel-1 data and eXtreme deep learning model. Geosci. Front. 2024;15(3):101780. DOI
- Uçar Z, Güney CO, Akay AE, Bilici E, Erkan N. Mapping the probability of Forest fire in the Mediterranean region of Türkiye using the GIS-based fuzzy-AHP method. Hum. Ecol. Risk Assess.: Int. J. 2025;31(1–2):234–59. DOI
- Stavropoulos S, Zaimes Gn, Filippidis E, Diaconu Dc, Emmanouloudis D. Mitigating Flash Floods with The Use of New Technologies: A Μulti-Criteria Decision Analysis to Map Flood Susceptibility for Zakynthos Island, Greece. J. Urban Reg. Anal. 2020;12(2). DOI
- Riaz R, Mohiuddin Md. Application of GIS-based multi-criteria decision analysis of hydro-geomorphological factors for flash flood susceptibility mapping in Bangladesh. Water Cycle. 2025;6:13–27. DOI
- Wilkho RS, Gharaibeh NG, Chang S. A GIS‐based tool for dynamic assessment of community susceptibility to flash flooding. J. Flood Risk Manage. 2024;18(1). DOI
- Zittis G, Almazroui M, Alpert P, Ciais P, Cramer W, Dahdal Y, Fnais M, Francis D, Hadjinicolaou P, Howari F, Jrrar A. Climate change and weather extremes in the Eastern Mediterranean and Middle East. Rev. Geophys. 2022;60(3):e2021RG000762. DOI
- Abdo HG, Zeng T, Alshayeb MJ, Prasad P, Ahmed MF, Albanai JA, Alharbi MM, Mallick J. Multi-criteria analysis and geospatial applications-based mapping flood vulnerable areas: a case study from the eastern Mediterranean. Nat. Hazards. 2025;121(1):1003–31. DOI
- Membele GM, Naidu M, Mutanga O. Application of analytic network process (ANP), local and indigenous knowledge in mapping flood vulnerability in an informal settlement. Nat. Hazards. 2023;120(3):2929–51. DOI
- Luo Z, Tian J, Zeng J, Pilla F. Flood risk evaluation of the coastal city by the EWM-TOPSIS and machine learning hybrid method. Int. J. Disaster Risk Reduct. 2024;106:104435. DOI
- Erena SH, Reddy RU, Wodnimu MA, Mohamed A. Flood vulnerability mapping and local mitigation strategies: The case of Adama City, Ethiopia. Urban Clim. 2024;55:101906. DOI
- Al-Kindi KM, Alabri Z. Investigating the Role of the Key Conditioning Factors in Flood Susceptibility Mapping Through Machine Learning Approaches. Earth Syst. Environ. 2024;8(1):63–81. DOI
- Amiri A, Soltani K, Ebtehaj I, Bonakdari H. A novel machine learning tool for current and future flood susceptibility mapping by integrating remote sensing and geographic information systems. J. Hydrol. 2024;632:130936. DOI
- Lelieveld J, Hadjinicolaou P, Kostopoulou E, Chenoweth J, El Maayar M, Giannakopoulos CE, Hannides C, Lange MA, Tanarhte M, Tyrlis E, Xoplaki E. Climate change and impacts in the Eastern Mediterranean and the Middle East. Clim. Change. 2012;114(3):667–87. DOI
- Black E, Brayshaw DJ, Rambeau CMC. Past, present and future precipitation in the Middle East: insights from models and observations. Philos. Trans. R. Soc. A Math. Phys. Eng. Sci. 2010;368(1931):5173–84. DOI
- Saaty TL. The analytic hierarchy process (AHP). J. Oper. Res. Soc. 1980;41(11):1073–6.
- Stefanidis S, Stathis D. Assessment of flood hazard based on natural and anthropogenic factors using analytic hierarchy process (AHP). Nat. Hazards. 2013;68(2):569–85. DOI
- Wahba M, Sharaan M, Elsadek WM, Kanae S, Hassan HS. Examination of the efficacy of machine learning approaches in the generation of flood susceptibility maps. Environ. Earth Sci. 2024;83(14). DOI
- Mukherjee R, Deb P. Application of GIS-based analytical hierarchy process for assessment and mapping of flood risk zone in the lower Ramganga River Basin, Western Gangetic Plain, India. Environ. Dev. Sustain. 2023;26(3):6163–93. DOI
Cite this article:
Alkaddour, A., Shadoud, M. Ahmad, Hashemi, M., Mahmoud, F., Hammad, M., Youssef, Y. M., Mucsi, L. Urban flood susceptibility mapping using the AHP model and geospatial tools in Quwaiq River Basin, Aleppo Governorate, Syria. DYSONA – Applied Science, 2026;7(1): 1-19. doi: 10.30493/das.2025.514366