Qayssar M. Ajaj 1; Noor A. Awad 2; Huda J. Jumaah 3*; Hossein M. Rizeei 4
1, Department of Surveying Engineering Techniques, Technical Engineering College of Kirkuk, Northern Technical University, Kirkuk, Iraq
2, Department of Fuel and Energy Engineering, College of Oil and Gas Techniques Engineering Kirkuk, Northern Technical University, Kirkuk, Iraq
3, Department of Environment and Pollution Engineering Techniques, Technical Engineering College of Kirkuk, Northern Technical University, Kirkuk, Iraq
4, The Centre for Advanced Modelling and Geospatial Information Systems (CAMGIS), Faculty of Engineering and Information Technology, University of Technology Sydney, Sydney, New South Wales, Australia
E-mail:
huda80@ntu.edu.iq
Received: 12/09/2024
Acceptance: 08/02/2025
Available Online: 09/02/2025
Published: 01/07/2025

Manuscript link
http://dx.doi.org/10.30493/DAS.2025.478260
Abstract
The monitoring of air quality has become increasingly essential due to the detrimental health impacts of air pollutants, especially in areas susceptible to intense dust storms such as Iraq. This research aims to forecast the Air Quality Index (AQI) during dust storm occurrences by utilizing PM2.5 data obtained from remote sensing (RS) and previous AQI data from ground monitoring stations. The study used three regression models—linear, exponential, and logarithmic—to examine the correlation between PM2.5 concentrations and AQI values from April to July 2022. The findings demonstrate that the linear regression model surpasses the alternatives, with a R² value of 0.928 and a Pearson Correlation Coefficient (PCC) of 0.963. Spatial distribution maps indicate that central and southern Iraq encountered unhealthy to hazardous air quality throughout the study period, with the most severe effects observed in July 2022. The results highlight the effectiveness of remote sensing (RS) and geographic information systems (GIS) in environmental monitoring and establish a basis for creating sophisticated models to enhance air quality predictions and dust storm control approaches.
Keywords: Air quality, PM2.5, Dust storms, Remote sensing, GIS
Introduction
The monitoring and evaluation of air quality have garnered significant attention during the past few years [1-5]. It is essential to regulate the fluctuating levels of air pollutants [6] due to their detrimental effects on health [7]. Consequently, it is imperative to assess thresholds when pollution levels above tolerable limits to accurately anticipate air quality [8]. The Environmental Protection Agency (EPA) established a series of air quality regulations encompassing dangerous air contaminants [9].
The Air quality index (AQI) serves as an effective tool for the regular monitoring of air quality levels [7], providing updates on recent air quality in relation to its health impact [10]. Therefore, it is widely considered a crucial metric for assessing and documenting daily air quality ratings [11]. The World Health Organization (WHO) indicates that particulate matter less than 2.5 micrometers in diameter, also recognized as fine particles or PM2.5, is accountable for the health consequences of associated diseases and epidemics [6][12]. Given its intricate makeup, it is essential to monitor PM2.5 sources that contribute to the harmful components [13].
Iraq is among the nations most impacted by severe dust storms, which have become a persistent issue, with clearly defined seasonal patterns of recurrence and significant intensity [14]. Previous works detected elevated PM2.5 concentration levels in Iraq during dust occurrences [15][16]. Remote sensing (RS) and geographic information systems (GIS) are advantageous for environmental monitoring investigations [3][17]. Various methodologies combined with GIS have been employed for mapping and statistical modeling objectives [18]. Additionally, efforts have been made to create and produce statistical models that effectively forecast and retrieve air quality-related data, ensuring that the outcomes of these models accurately represent the optimal methods for the distribution and assessment of air pollutant levels [6][19][20].
During 2022, Iraq witnessed multiple sand and dust storms, resulting in an orange-hued sky that impaired visibility and deposited substantial layers of dust. The occurrence of storms in Iraq is not a new phenomenon, with numerous documented dust storm events throughout the past two decades. Since January 2022, over a dozen such occurrences have been reported, each lasting two days or longer. The storms resulted in numerous Iraqis being hospitalized in May and July 2022. These sandstorms affected adjacent nations as far south as Saudi Arabia and Bahrain and disrupted air travel in Kuwait. This indicates that their quantity has risen relative to the corresponding period in previous years. Consequently, this study utilized particle data derived from remotely sensed pictures and historical Air Quality Index (AQI) from ground stations with verified measurements during the period from April to July 2022. Regression method was employed to model and analyze the relationship between the response variable (AQI) and the predictor variable PM2.5, enabling the predicted values to characterize AQI levels during severe dust events, while the predictor variables effectively elucidate the spatial variability of air pollutant concentrations.
Material and Methods
Study area
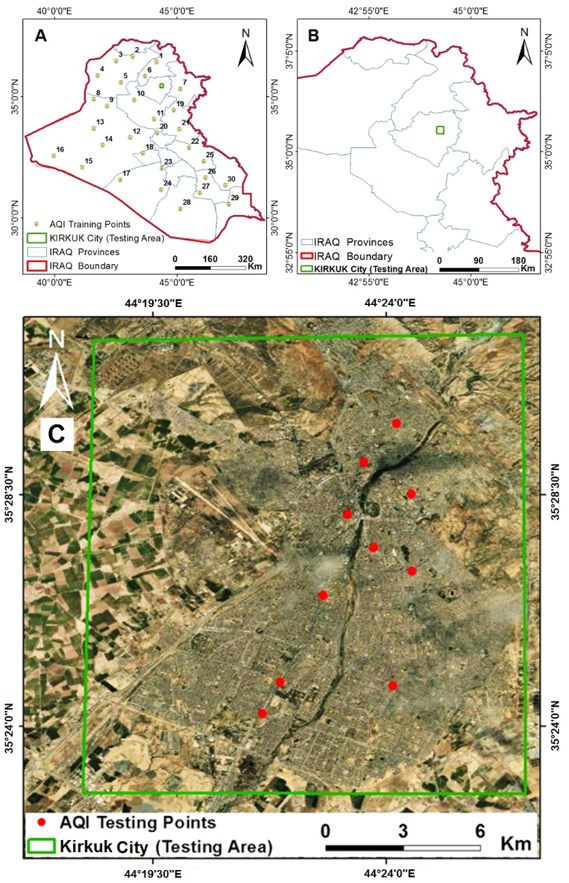
Iraq is situated between longitudes 38° 40′ and 48° 50′, and latitudes 29° 10′ and 37° 24′. Figure 1 illustrates the study region of Iraq, indicating the locations of training (Fig. 1 A) and validation (Fig. 1 C) samples. The topography of Iraq is defined by mountainous regions in the north, desert landscapes in the west, wetlands in the south, and plains in the central area [21]. Temperatures fluctuate during the year between 0 to 50°C, while annual precipitation ranges from 100 to 180 mm. The peak precipitation occurs from December to April [22][23].
Methodology
Modeling and forecasting geographic variations in air quality are crucial for obtaining trustworthy forecasts [8]. Moreover, statistical models offer a potential approach for estimating air quality-related data across extensive regions [2]. These models can subsequently furnish detailed information and precise maps of air pollution, and estimate the likelihood of future events occurring.
The present investigation relies on a remotely sensed dataset of PM2.5 obtained from NASA satellite data via the open-source program accessible at (Link). Additionally, historical AQI data have been obtained from Air Matters (The Global Air Quality Provider) via the website (Link). Moreover, nine ground truth AQI training data points in Kirkuk City were used for model validation (Fig. 1 C). This data was collected using an air quality monitoring system in July 2022.
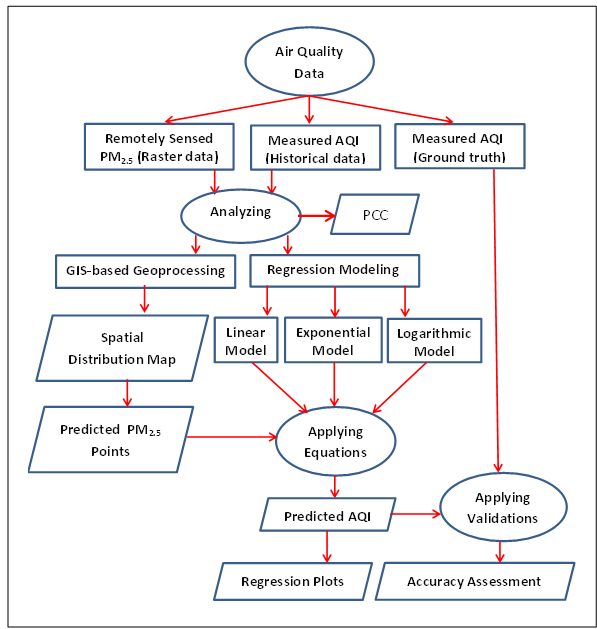
Geostatistical and geoprocessing analysis utilizing ArcGIS has been employed for mapping the spatial distribution of air quality. Three regression models were employed for constructing AQI models and elucidating correlation, alongside the Pearson’s correlation coefficient technique. The models were utilized during each month of the study duration. Figure 2 illustrates the flowchart of the study procedures.
Regression model
Simple linear regression model
The standard method for fitting a provisional linear mean function to geostatistical data is Least Squares (LS) [24]. In this investigation, the LS regression for PM2.5 (independent parameter) can be specified as:

Where (AQIPredicted) is the predicted dependent air quality parameter, (I) denotes to intercept coefficient (constant factor), (C) is the coefficient of independent air quality parameter (measured PM2.5), and (ε) denotes the error term (neglected).
Linear regressions are statistical techniques for modeling the linear relationships between variables to describe the relationship between a dependent variable and various independent variables in such a way that the behavior of the dependent variable can be predicted from the independent variables if the relationship exists [3][25].
Exponential regression model
In general, when the independent variable of a particular exponential function is used as an exponent, the function is considered to be exponential [26]. The following equation represents an exponential regression model:

Where (PM2.5measured) is the independent value, (AQIPredicted) is the dependent value, and there are two parameters a and b where the optimal values are explored with curve fit [27]. The model will be constructed by training AQI dataset with the PM2.5 RSdataset.
Logarithmic regression model
Logarithmic regression is generally used for modeling environmental statistics when data measurements tend to display positively deviated frequency curves with higher variance at higher concentrations [28].
The logarithmic formula [29] can be specified as:

Where (AQIPredicted) is the response variable, (PM2.5measured) is the explanatory variable, and a and b are the coefficients that define the correlation between the two variables.
Pearson correlation coefficient (PCC)
Pearson correlation coefficient (PCC) is widely used to estimate the linear relation between two features for a definite number of pairs [30]. PCC value describes the potential and direction of the two used features’ correlation which is between -1 and 1. The value describes how the feature will change based on the other feature in a similar path. The correlation between PM2.5 data, acquired from satellite images of the four periods (April, May, June, and July), and the measured AQI was estimated for 30 points located in the study area. The PCC formula can be specified as:

Here, Pearson correlation coefficient (PCC) correlates between AQI and PM2.5 for n specific points.
Results and Discussion
RS-based PM2.5 spatial distribution map
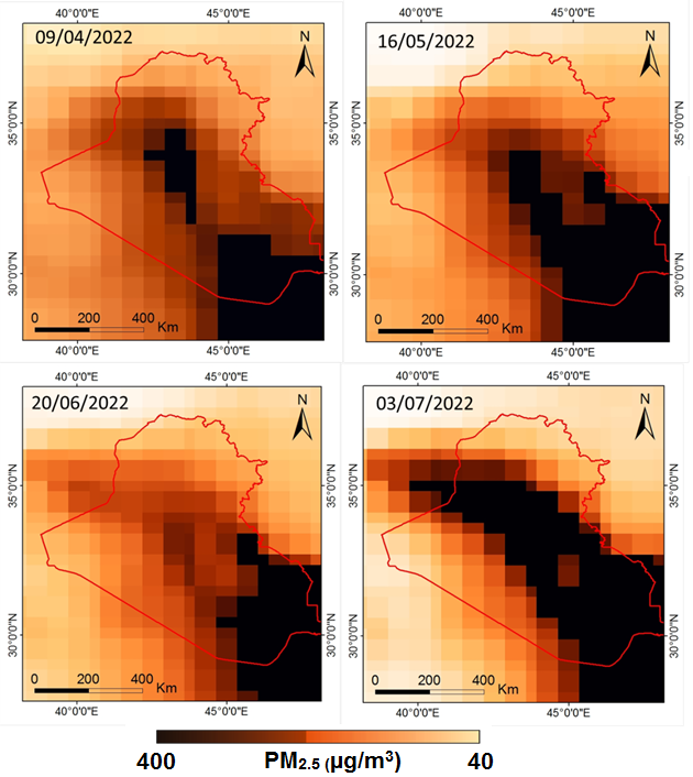
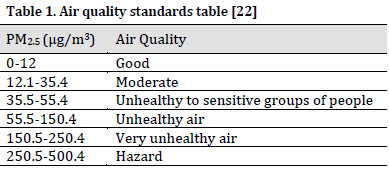
The PM2.5 spatial distribution maps of the period April to July 2022 were visualized (Fig. 3). The maps are based on GIS geo-processes and RS imagery from Modern-Era Retrospective Analysis for Research and Applications (MERRA-2) which integrates observations by latest satellite sensors. The image properties involve monthly mass concentrations of PM2.5 dust, cloudless with high resolution, WGS 84 coordinate system, UTM zone 38N, and image raw size (8200px × 8200px, 5593px × 4860px). MERRA-2 is the newest version of universal atmospheric re-analysis for era satellites introduced by NASA. This reanalysis is a more reliable time series that uses assimilated interactive aerosol and spotted time-varying emissions. The PM2.5 values from resultant maps ranged between 40 and 400 µg/m3. For reference, many areas in central and southern Iraq were characterized with unhealthy to hazardous air based on the air quality standards table [22] (Table 1), during the studied incidents. The direction of exceeding concentrations was from southeast to northwest, and July 2022 was the most severe incident.
Historical air quality index (AQI) spatial distribution map
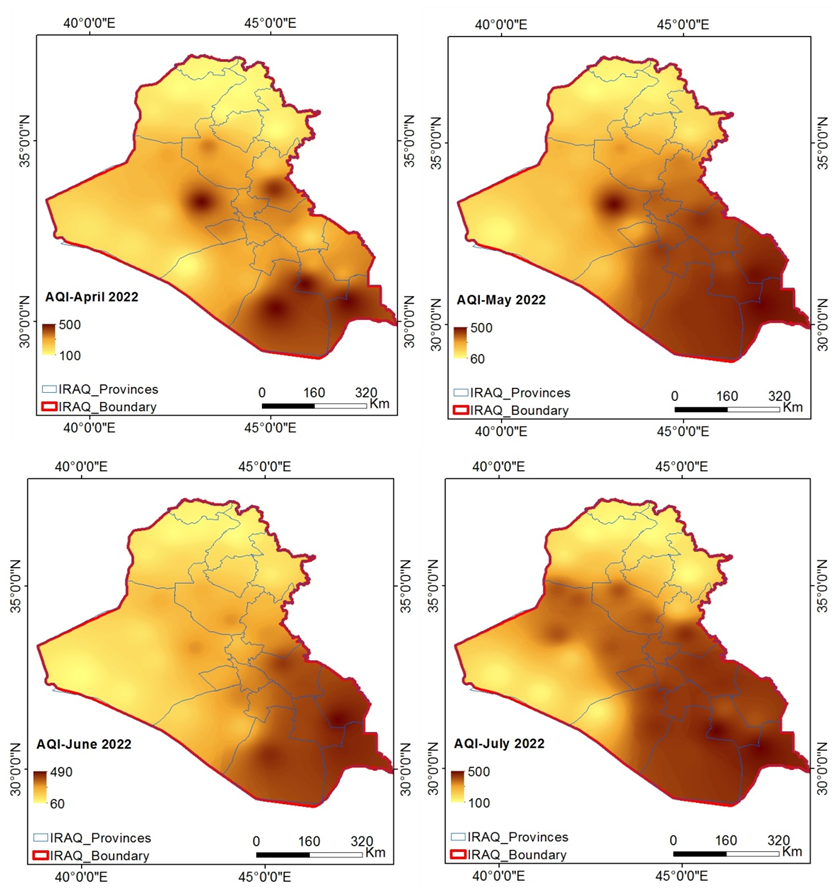
Based on historical AQI data and spatial reliance on adjacent stations using GIS-geostatistical processes, the spatial maps of AQI values distribution was produced (Fig. 4). The obtained maps of the period April-July 2022 revealed high values of AQI ranging from (60-500). Similar to PM2.5 distribution maps, the direction of exceeding concentrations was from southeast to northwest in the four periods. The severely contaminated period was also noted during July 2022 where AQI ranged between (100-500). Based on the air quality standards table (Table 1), the values which exceed 250 represent unhealthy to hazardous AQI.
3.3. AQI prediction models
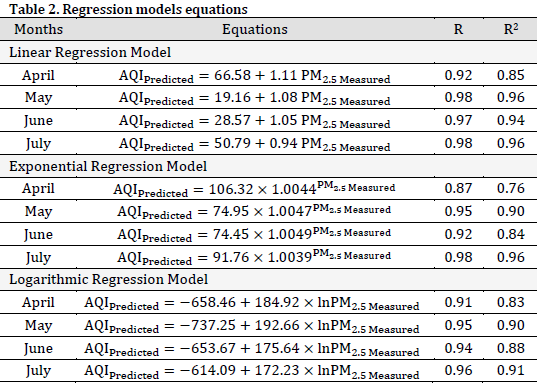
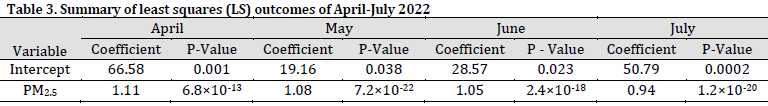
The equations of linear, exponential, and logarithmic recessional models for predicted AQI based on measured PM2.5 values were obtained for each month during the study period April-July 2022 (Table 2) (Supplementary Figures 1-3). On average, the lowest R2 and Pearson Correlation Coefficient (R) values were obtained by the exponential model (R2=0.865, R=0.93), while the highest was obtained by linear regression model (R2=0.928, R=0.963). A correlation value (R) of 0.70 is usually acceptable [3]. Therefore, all models were capable of adequately predict AQI values based on measure PM2.5 values. However, linear regression models were more accurate in predicting AQI in all studied cases. Consequently, four LS model equations were introduced to predict the AQI values at the randomly selected 30 recorded points. A summary of least squares outcomes of April-July 2022 is shown in Table 3.
Accuracy assessment
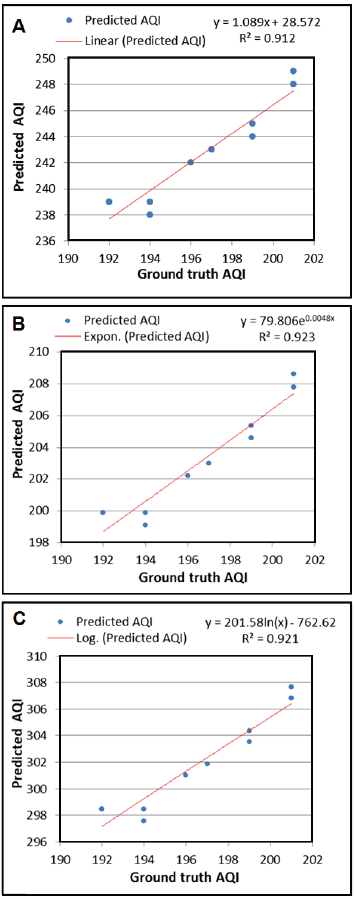
The developed regression models were validated against nine ground truth AQI validation points obtained from various locations in Kirkuk City (Fig. 1 C) in July 2022. The assessment uses fitting of predicted AQI in correspondence to measured AQI values (ground truths). The results showed that all calculated values by linear, exponential, and logarithmic models demonstrated a high fitting with testing samples with validation (R2) values of 0.91, 0.92, and 0.92, respectively (Fig. 5), which confirms the consistent accuracy of the developed models [31].
Conclusions
This study aimed to predict AQI during severe dust periods in Iraq based on PM2.5 values. Among the developed models, simple linear regression model scored the highest R2 and PCC values (R2=0.928, R=0.963). Moreover, all three models scored an R2 value higher than 0.9 against validation ground truth dataset. The findings indicated that air quality during the analyzed events was unhealthy and hazardous in central and southern regions of the country, with the most severe adverse effects extending over extensive distances from the south to the northeast, impacting several countries in the region. Advanced models can be constructed based on the established models to enhance decision-making and formulate storm management plans and soil stabilization strategies.
References
- Yang Y, Zheng Z, Bian K, Song L, Han Z. Real-time profiling of fine-grained air quality index distribution using UAV sensing. IEEE Internet Things J. 2017;5(1):186-98. DOI
- Mohtar AA, Latif MT, Baharudin NH, Ahamad F, Chung JX, Othman M, Juneng L. Variation of major air pollutants in different seasonal conditions in an urban environment in Malaysia. Geosci. Lett. 2018;5(1):1-13. DOI
- Jumaah HJ, Ameen MH, Kalantar B, Rizeei HM, Jumaah SJ. Air quality index prediction using IDW geostatistical technique and OLS-based GIS technique in Kuala Lumpur, Malaysia. Geomat. Nat. Hazards Risk. 2019;10(1):2185-99. DOI
- Han D, Zhang T, Zhang X, Tan Y. Study on spatiotemporal characteristics and influencing factors of pedestrian-level PM2. 5 concentrations in outdoor open spaces of Harbin in winter, using a generalized additive model (GAM). Urban Clim. 2022;46:101313. DOI
- Wang J, Yan Y, Si H, Li J, Zhao Y, Gao T, Pi J, Zhang R, Chen R, Chen W, Zheng Y. The effect of real-ambient PM2. 5 exposure on the lung and gut microbiomes and the regulation of Nrf2. Ecotoxicol. Environ. Saf. 2023;254:114702. DOI
- Jumaah HJ, Mansor S, Pradhan B, Adam SN. UAV-Based PM2. 5 Monitoring for Small-Scale Urban Areas. Int. J. Geoinf. 2018;14(4). DO
- Liu Y, Yuan Q, Zhang X, Chen Z, Jia X, Wang M, Xu T, Wang Z, Jiang J, Ma Q, Zhang M. Fine particulate matter (PM2. 5) induces inhibitory memory alveolar macrophages through the AhR/IL-33 pathway. Cell. Immunol. 2023;386:104694. DOI
- Gattrell A, Löytönen M, editors. GIS and Health. Houghton Mifflin Harcourt; 1998.
- Brook RD, Rajagopalan S, Al-Kindi S. Public health relevance of US EPA air quality index activity recommendations. JAMA Netw. Open. 2024;7(4):e245292. DOI
- Lin Y, Zhao L, Li H, Sun Y. Air quality forecasting based on cloud model granulation. EURASIP J. Wirel. Commun. Netw. 2018;2018(1). DOI
- Dadhich AP, Goyal R, Dadhich PN. Assessment of spatio-temporal variations in air quality of Jaipur city, Rajasthan, India. Egypt. J. Remote Sens. Space Sci. 2018;21(2):173-81. DOI
- Boldo E, Medina S, Le Tertre A, Hurley F, Mücke HG, Ballester F, Aguilera I, Daniel Eilstein on behalf of the Apheis group. Apheis: Health impact assessment of long-term exposure to PM 2.5 in 23 European cities. Eur. J. Epidemiol. 2006;21:449-58. DOI
- Adams K, Greenbaum DS, Shaikh R, van Erp AM, Russell AG. Particulate matter components, sources, and health: Systematic approaches to testing effects. J. Air Waste Manag. Assoc. 2015;65(5):544-58. DOI
- Al Ameri IDS, Briant RM, Engels S. Drought severity and increased dust storm frequency in the Middle East: a case study from the Tigris–Euphrates alluvial plain, central Iraq. Weather. 2019;74(12):416–26. DOI
- Kazem AA, Chaichan MT, Kazem HA. Dust effect on photovoltaic utilization in Iraq. Renew. Sustain. Energy Rev. 2014;37:734-49. DOI
- Attiya AA, Jones BG. Climatology of Iraqi dust events during 1980–2015. SN Appl. Sci. 2020;2(5):845. DOI
- Jumaah HJ, Ameen MH, Mahmood S, Jumaah SJ. Study of air contamination in Iraq using remotely sensed Data and GIS. Geocarto Int. 2023;38(1):2178518. DOI
- Jumaah HJ, Kamran KV. AQI-based box model using GIS and remote sensing over Kirkuk city, Iraq. Adv. Eng. Days. 2024; (9):144-146
- Ameen MH, Jumaah HJ, Kalantar B, Ueda N, Halin AA, Tais AS, Jumaah SJ. Evaluation of PM2. 5 particulate matter and noise pollution in Tikrit University based on GIS and statistical modeling. Sustainability. 2021;13(17):9571. DOI
- Corwin DL, Wagenet RJ. Applications of GIS to the modeling of nonpoint source pollutants in the vadose zone: A conference overview. J. Environ. Qual. 1996;25(3):403–11. DOI
- Jasim AI, Awchi TA. Regional meteorological drought assessment in Iraq. Arab. J. Geosci. 2020;13(7):284. DOI
- Hamed HH, Jumaah HJ, Kalantar B, Ueda N, Saeidi V, Mansor S, Khalaf ZA. Predicting PM2. 5 levels over the north of Iraq using regression analysis and geographical information system (GIS) techniques. Geomat. Nat. Hazards Risk. 2021;12(1):1778-96. DOI
- Khidher SA. Dust Storms in Iraq: Past and Present. Theor. Appl. Climatol. 2024;155(6):4721–35. DOI
- He Q, Huang B. Satellite-based mapping of daily high-resolution ground PM2. 5 in China via space-time regression modeling. Remote Sens. Environ. 2018;206:72–83. DOI
- Maulud D, Abdulazeez AM. A review on linear regression comprehensive in machine learning. J. Appl. Sci. Technol. Trends. 2020;1(2):140–7. DOI
- Torres R. Mathematical Investigation of Functions. J. Educ. Manag. Dev. Stud. 2021;1(1):42–9. DOI
- Tju TE, Maylawati DS, Munawar G, Utomo S. Prediction of the COVID-19 Vaccination Target Achievement with Exponential Regression. J. Inform. Sains. 2021;4(2):179-82. DOI
- El‐shaarawi A, Viveros(‐aguilera) R. Logarithmic Regression. Encycl. Environmetrics. 2006. DOI
- Alkaki ZR. Estimation of Non-Linear Regression Parameters by Newton Raphson’s Method of Nonlinear Equations. Solid State Technol. 2020;63(5):8447-60.
- Mohammed, Khan A, Kuri A, Ahammed S, Al Muqtadir Abir K, Arfin-Khan MA. A google earth engine approach for anthropogenic forest fire assessment with remote sensing data in Rema-Kalenga wildlife sanctuary, Bangladesh. Geol. Ecol. Landsc. 2023:1-22. DOI
- Mahmood MR, Jumaah HJ. NBR index-based fire detection using Sentinel-2 images and GIS: A case study in Mosul Park, Iraq. Int. J. Geoinf. 2023;19(3):67-74. DOI
Cite this article:
Ajaj, Q. M., Awad, N. A., Jumaah, H. Jamal, Rizeei, H. M. Air quality regression analysis over Iraq during severe dust periods using GIS and remotely sensed PM2.5. DYSONA – Applied Science, 2025;6(2): 300-308. doi: 10.30493/das.2025.478260