Ahmed A. Aldughairi 1*
1, Department of Geography, College of Languages and Human Sciences, Qassim University, Buraydah 51452, Saudi Arabia
E-mail:
adgierie@qu.edu.sa
Received: 07/09/2024
Acceptance: 30/09/2024
Available Online: 01/10/2024
Published: 01/01/2025

Manuscript link
http://dx.doi.org/10.30493/DAS.2024.477412
Abstract
Climate change is exerting considerable effects on arid and semi-arid regions. Increasing temperatures and dwindling precipitation in Saudi Arabia may negatively impact agricultural and water resources. This study focused on meteorological data in northern Saudi Arabia. Datasets comprised of meteorological data taken from the Al Jawf, Qaysumah, and Rafha climate stations in vicinity of the Imam Turki Bin Abdullah Royal Nature Reserve (ITBA) from 1978 to 2018. The Two-Sample T-Test, simple linear regression, and Mann-Kendall test were employed to analyze temperature, relative humidity, and wind speed as markers of climate change in the studied region. The analysis indicated that temperature parameters were much higher in the second period (1999-2018) than in the first (1978-1998), with minimum temperature being the most impacted parameter. The Mann-Kendall test indicated a warming trend in temperatures from 1985 to 2018. Qaysumah station exhibited the most pronounced alterations in all parameters, with an increase in humidity resulting from a decrease in wind velocity. The findings indicate an urgent necessity for responses and additional inquiry into the environmental effects of climate change on local biodiversity and agricultural production systems.
Keywords: Climate change, Temperature, Relative humidity, Saudi Arabia
Introduction
Numerous prior studies have concentrated on historical climate change [1-8]. Recent climate model simulations indicate that worldwide dry land areas may expand by approximately 10% by 2100, with the exception of India and northern tropical Africa, which are projected to see increased precipitation [9].
The Expert Team on Climate Change Detection and Indices (ETCCDI) recommended five daily climate indicators for evaluating and identifying global climate change [10]. The Intergovernmental Panel on Climate Change (IPCC) stated in 2007 that the rise in global average air and ocean temperatures since the mid-20th century is attributable to human activity, and the warming of the climate system is now “unequivocal” [11]. Temperature fluctuations and extreme temperatures affect numerous human endeavors, particularly agriculture, construction, and tourism. Therefore, these fluctuations have been analyzed over the years for numerous countries [12][13].
Semi-arid zones encompass around 15% of the Earth’s terrestrial surface and sustained 4.4% of the world population in the year 2000 [14]. The ecosystems in these regions are delicate and susceptible to significant interactions between human activities and climate change [15-19]. The majority of climate change impacts on dry regions pertain to water scarcity and the interplay between precipitation and severe daily temperatures. During the past decade, it has been reported that drought trends may manifest in arid places due to global warming [20-22]. Surface water resources essential for agricultural irrigation and human activities are persistently degrading [23][24], causing alterations in urbanization and land-use. These alterations have resulted in significant anthropogenic changes in various nations [25-31].
In arid locations, both empirical observations and modeling studies suggest that a warmer climate may result in prolonged and intensified droughts due to increased evapotranspiration and decreased precipitation [32]. Numerous researches were published in Arab countries within the same perspective. Climate variability was illustrated in Bahrain through alternating hot-dry and cool-wet occurrences [33]. In Kuwait, the occurrences of heat waves, hot days, very hot days, and extremely hot days during the warm seasons (May-August) from 1958 to 2000 were examined [34]. They determined that the exceptionally elevated temperatures throughout the warm season were attributed to the alterations in the regional circulation pattern. Signals of climatic trends, including an increase in maximum temperatures, a more pronounced rise in minimum temperatures, a decline in daily temperature range, and statistically insignificant reductions in precipitation, were seen in Jordan [35].
It was found that rising temperatures and declining precipitation in Saudi Arabia could significantly adversely affect agricultural and water resources [36]. The linear and Mann-Kendall analyses of future temperature and rainfall trends across several locations in Saudi Arabia indicated a rise in temperature in all areas and a decline in rainfall in numerous regions. Additionally, an excessive temperature trend was observed on the west coast of Saudi Arabia utilizing linear and Mann-Kendall tests [37]. The outputs of the NCAR Community Climate System Model for three emission scenarios (RCP8.5, RCP6, and RCP2.6) during the assessment periods of 2025-2044, 2045-2064, and 2065-2084, respectively, compared to the average values from the reference period (1986-2005), indicated an increase across all regions from 1986 to 2005 [38]. The same study indicates that under RCP8.5, temperature increases in Saudi Arabia are projected to be within the ranges of 0.8-1.6 °C, 0.9-2.7 °C, and 0.7-4.1 °C for the periods 2025-2044, 2045-2064, and 2065-2084, respectively [39].
This study provides a long-term examination of temperature trends using daily time series data gathered from 1985 to 2018 across three meteorological sites in Saudi Arabia (Al Jawf, Qaysumah, and Rafha climate stations). The analyses encompass the estimation of warming or cooling rates utilizing the T-student and Mann-Kendall statistical tests.
Material and Method
Study area
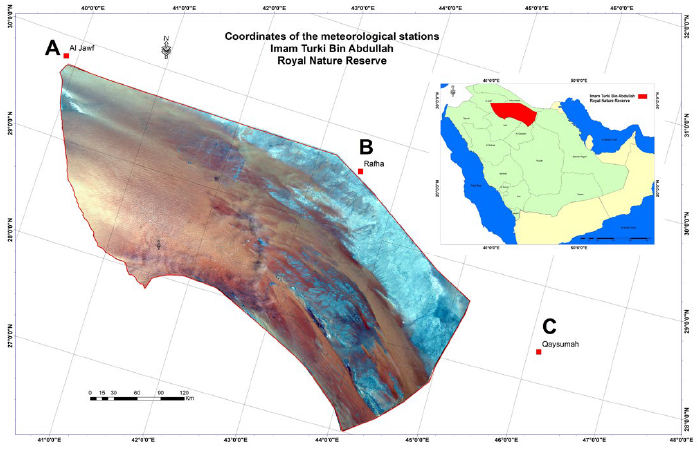
The study area is situated in Northeastern Saudi Arabia, encompassing a geographical area of approximately 91,500 km² and recognized as Imam Turki Bin Abdullah Royal Nature Reserve (ITBA) (Fig. 1). The area is located between 26°45′ and 30°15′ North latitudes and 40° to 45° East longitudes. It is bordered to the northwest by the Al-Jawf region, to the north by the Northern Borders with Iraq, to the south by Ha’il, to the southwest by the Al Qasim area, and to the east by the Eastern Province. The ITBA Nature Reserve is categorized as having a hot desert climate (BWh) according to the Köppen-Geiger climate classification, characterized by hot summers and cool winters. The region exhibits a relatively moderate climate compared to others, attributable to its elevated altitude.
The study area is primarily influenced by two air masses: The Polar Continental, present from December to February, and the Tropical Continental, which occurs during the summer months of June to September. Both systems experience minor incursions of Polar Maritime and Tropical Maritime air [39].
The climatic conditions, soil properties, and relief topography significantly contribute to flora diversity in the area. At-Taysiah and Al Hijra plateaus are notable for the prevalence of Dianthus cyri. Whereas Haloxylon salicornicum, Calligonum comosum, Ephedra alata, and Panicum turgidum are the primary plant species found in sand dune ecosystems. However, Suaeda is the most widespread plant genus in the Sabkhas (low-relief saline mudflats or sandflats) environment [40][41]. In the plateau environment, two predominant plant species, Rhanterium epapposum and Haloxylon salicornicum, are extensively distributed. Water courses serve as a significant habitat for various plant species, particularly Lycium shawii and Acacia gerrardii.
The primary agricultural activities of the population in western ITBA include date production, vegetable cultivation in addition to camel breeding and livestock management. The agricultural sector is lately experiencing significant development, serving as an essential resource in the livelihood of numerous farmers.
Datasets
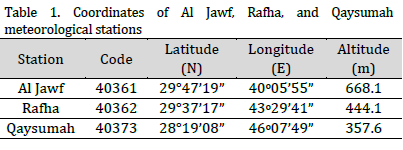
Temperature (daily average, daily maximum, and daily minimum), relative humidity (daily average, daily maximum, and daily minimum), and wind speed (daily average and daily maximum) datasets were collected from the Al Jawf, Qaysumah, and Rafha climate stations (Table 1) for the period 1978-2018. Datasets for Al Jawf, Qaysumah, and Rafha climate stations are provided in Supplementary Tables 1-3, respectively.
Trend tests
Semi-averages technique
The Two-Sample T-Test was utilized to compare the arithmetic means of two distinct samples. The time series for each climate indicator is partitioned into two segments: (1978-1998) and (1999-2018). The arithmetic means of the first and second segment were computed and compared employing Two-Sample T-Test through Minitab 19. The linear regression slope and R2 values of the trends were then calculated through GraphPad Prism 9.
Mann-Kendall test
The Mann-Kendall test was employed in the period between 1985 and 2018 to examine the important patterns of severe temperatures as indicators of climate change. Recognized by the IPCC and the World Meteorological Organization (WMO), this method offers a trend test and serves as a significant instrument for analyzing substantial changes in climatic and hydrological time series data [42-44]. Under the null hypothesis (Ho), the Mann-Kendall test statistic is defined by the subsequent mathematical expression:
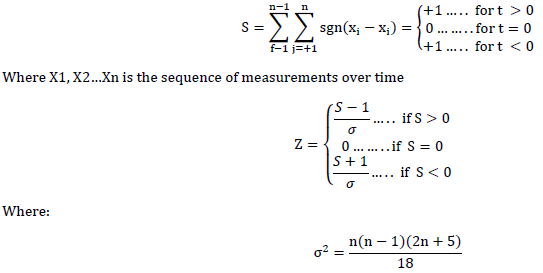
n: size of the time series.
S: the statistic of the Mann–Kendall test.
σ: standard deviation of the dataset.
The Mann-Kendall test is a non-parametric method that does not necessitate properly distributed data. Another benefit of this strategy is its minimal sensitivity to sudden disruptions caused by an inhomogeneous time series [37].
Results and Discussion
Climatic trends
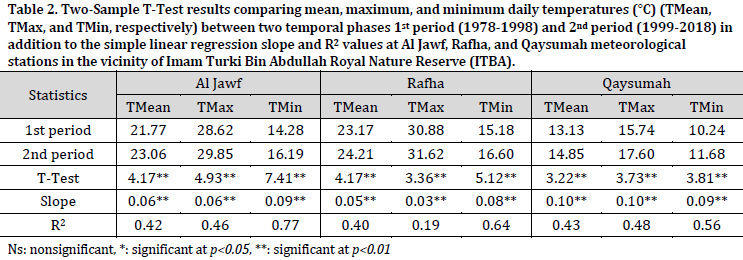
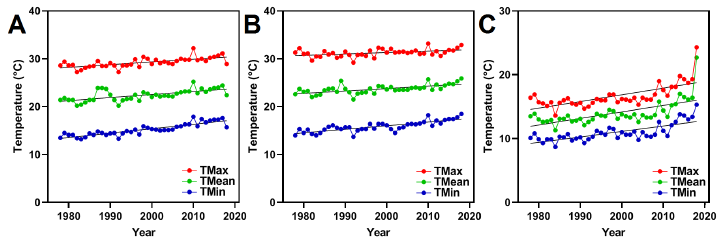
The Two-Sample T-Test for temperature data indicated that all examined parameters (TMax, TMin, and TMean) were substantially elevated in the second period (1999-2018) relative to the first (1978-1998) across all locations (Table 2). Notable regression slope values were likewise recorded for temperature parameters at the examined meteorological stations (Table 2) (Fig. 2). The values varied from 0.05 to 0.1, signifying a temperature increase of 0.5 to 1 °C during the investigated period, with TMin being the most affected variable. The results align with previous results derived from applying the regional climate model (PRECIS), indicating a rise in summer temperatures and the frequency of hot days annually, and demonstrating a 0.65 °C temperature increase per decade [45]. The findings from another study reveal a temperature increase of 1.8-4.1 °C across various regions of Saudi Arabia [46].
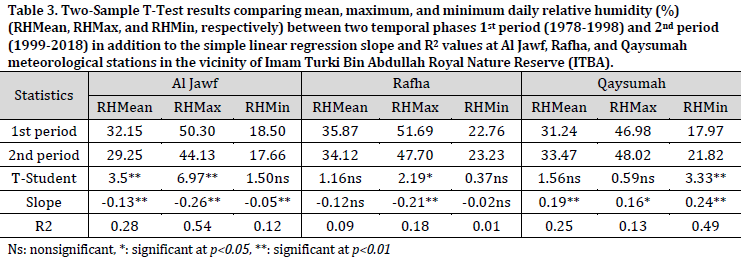
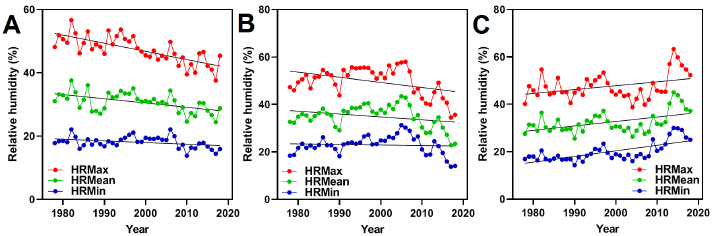
In contrast to the temperature parameter, humidity indicators (HRMax, HRMin, and HRMean) exhibited a notable decline at the Al Jawf and Rafha stations, but an increase was recorded at the Qaysumah station throughout the second period of the study (Table 3). In accordance with these observations, negative relative humidity slope values were recorded at the first two sites (Table 3) (Fig. 3). The largest significant alteration was noted in RHMax at Al Jawf station (slope=-0.26), indicating that, on average, maximum relative humidity declined by 1% per five years over the analyzed period (1978-2018). Relative humidity is a vital determinant for the survival of desert-acclimated plant species, such as those reported in the studied area [39-41], therefore influencing the survival of animal species reliant on these plants. A substantial reduction in relative humidity will likely lead to a drop in plant cover density and floral diversity, subsequently resulting in diminished faunal diversity in ITBA.
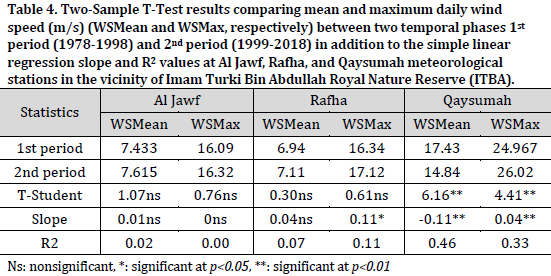
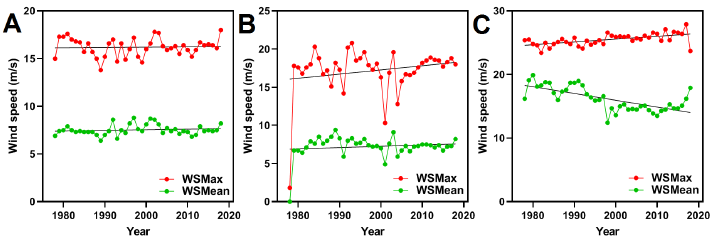
The Two-Sample T-Test for wind speed characteristics (WSMax and WSMean) between the second and first periods yielded insignificant results at the Al Jawf and Rafha sites, exhibiting low slope values. A substantial decrease in mean wind speed was seen at Qaysumah station, shown by a considerable T-Value and a negative slope, alongside a nearly constant maximum wind speed, reflecting an overall decline in wind speed at this location throughout the study period (Table 4) (Fig. 4).
Mann-Kendall test
All locations exhibited a positive Z-Value alongside a positive and substantial Sen’s slope value for all temperature parameters. The rising trend in temperatures signifies a general warming pattern throughout the analyzed period, particularly in minimum temperatures, as corroborated by linear regression analysis (Table 5). A discernible declining trend in Al Jawf relative humidity was noted, indicated by the negative Z-Value and the substantial negative Sen’s slope for mean and maximum daily relative humidity. Whereas a considerable rise in minimum and mean relative humidity was recorded at Qaysumah station. No notable alterations in relative humidity were detected at Rafha station (Table 5). Marked declining trends in wind speed were noted in Qaysumah, while Al Jawf and Rafha exhibited less dramatic and statistically insignificant trends (Table 5).
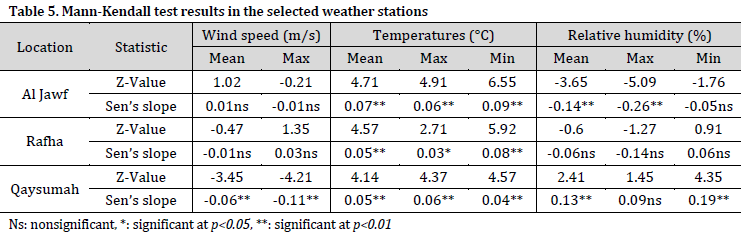
The findings from the Mann-Kendall test for the period 1985 to 2018 corroborate the patterns identified in the Two-Sample T-Test and the overall regression model. Both analytical methods indicated that the most significant alterations in temperature, relative humidity, and wind speed were recorded at the Qaysumah station located to the south of the study region. The elevated relative humidity at Qaysumah may be ascribed to the reduction in average wind speed over the analyzed period. The observed changes necessitate immediate reactions and greater investigation into the environmental impact of climate change in the region to better understand its effects on local biodiversity and agricultural production systems.
Conclusions
Climatic factors in the study region underwent considerable changes from 1978 to 2018. A rise in temperature, with the most pronounced alterations noted at Qaysumah station, was noticed. This indicates a prevailing warming trend, especially in minimum temperatures. The research indicated a decrease in relative humidity in Al Jawf, whereas Qaysumah observed an increase in humidity. The results indicate the necessity for prompt responses and more studies regarding climate change’s effects on local biodiversity and agricultural production systems. The study period encompassed the overall climate trends preceding the creation of the Imam Turki Bin Abdullah Royal Nature Reserve (ITBA) in 2018. The reserve’s initiatives to safeguard and expand natural vegetation cover, along with afforestation programs, are anticipated to significantly influence climate change, as will be underscored by future studies, with observable positive repercussions in the forthcoming decades.
References
- Bader J, Latif M. The impact of decadal‐scale Indian Ocean sea surface temperature anomalies on Sahelian rainfall and the North Atlantic Oscillation. Geophys. Res. Lett. 2003;30(22). DOI
- Giannini A, Saravanan R, Chang P. Oceanic Forcing of Sahel Rainfall on Interannual to Interdecadal Time Scales. Science. 2003;302(5647):1027–30. DOI
- Hoerling M, Hurrell J, Eischeid J, Phillips A. Detection and Attribution of Twentieth-Century Northern and Southern African Rainfall Change. J. Clim. 2006;19(16):3989–4008. DOI
- Lu J. The dynamics of the Indian Ocean sea surface temperature forcing of Sahel drought. Clim. Dyn. 2009;33(4):445–60. DOI
- Lu J, Delworth TL. Oceanic forcing of the late 20th century Sahel drought. Geophys. Res. Lett. 2005;32(22). DOI
- McCabe GJ, Betancourt JL, Gray ST, Palecki MA, Hidalgo HG. Associations of multi-decadal sea-surface temperature variability with US drought. Quat. Int. 2008;188(1):31–40. DOI
- Méndez M, Magaña V. Regional Aspects of Prolonged Meteorological Droughts over Mexico and Central America. J. Clim. 2010;23(5):1175–88. DOI
- Zeng N, Neelin JD, Lau KM, Tucker CJ. Enhancement of Interdecadal Climate Variability in the Sahel by Vegetation Interaction. Science. 1999;286(5444):1537–40. DOI
- Feng S, Fu Q. Expansion of global drylands under a warming climate. Atmos. Chem. Phys. 2013;13(19):10081–94. DOI
- Zhang X, Alexander L, Hegerl GC, Jones P, Tank AK, Peterson TC, Trewin B, Zwiers FW. Indices for monitoring changes in extremes based on daily temperature and precipitation data. WIREs Clim. Change. 2011;2(6):851-70. DOI
- Pachauri RK, Reisinger A, editors. Climate change 2007 synthesis report: Summary for policymakers. IPCC Secretariat; 2007.
- Choi G, Collins D, Ren G, Trewin B, Baldi M, Fukuda Y, Afzaal M, Pianmana T, Gomboluudev P, Huong PT, Lias N. Changes in means and extreme events of temperature and precipitation in the Asia‐Pacific Network region, 1955–2007. Int. J. Climatol. 2009;29(13):1906–25. DOI
- Alexander LV. Global observed long-term changes in temperature and precipitation extremes: A review of progress and limitations in IPCC assessments and beyond. Weather Clim. Extrem. 2016;11:4–16. DOI
- Safriel U, Adeel Z. Dryland systems. In Ecosystems and human well-being. Washington, DC: Island press. 2005.
- CHARNEY J. Dynamics of deserts and drought in the Sahel. Q. J. R. Meteorol. Soc. 1975;101(428):193–202. DOI
- Huang J, Minnis P, Yan H, Yi Y, Chen B, Zhang L, Ayers JK. Dust aerosol effect on semi-arid climate over Northwest China detected from A-Train satellite measurements. Atmos. Chem. Phys. 2010;10(14):6863–72. DOI
- Rotenberg E, Yakir D. Contribution of Semi-Arid Forests to the Climate System. Science. 2010;327(5964):451–4. DOI
- Xue Y. The Impact of Desertification in the Mongolian and the Inner Mongolian Grassland on the Regional Climate. J. Clim. 1996;9(9):2173–89. DOI
- Zhou Y, Li Y, Li W, Li F, Xin Q. Ecological responses to climate change and human activities in the arid and semi-arid regions of Xinjiang in China. Remote Sens. 2022;14(16):3911. DOI
- Chou C, Neelin JD, Chen CA, Tu JY. Evaluating the “Rich-Get-Richer” Mechanism in Tropical Precipitation Change under Global Warming. J. Clim. 2009;22(8):1982–2005. DOI
- Held IM, Soden BJ. Robust Responses of the Hydrological Cycle to Global Warming. J. Clim. 2006;19(21):5686–99. DOI
- Seager R, Naik N, Vecchi GA. Thermodynamic and Dynamic Mechanisms for Large-Scale Changes in the Hydrological Cycle in Response to Global Warming. J. Clim. 2010;23(17):4651–68. DOI
- Liu C, Xia J. Water problems and hydrological research in the Yellow River and the Huai and Hai River basins of China. Hydrol. Process. 2004;18(12):2197–210. DOI
- Schwinning S, Sala OE, Loik ME, Ehleringer JR. Thresholds, memory, and seasonality: understanding pulse dynamics in arid/semi-arid ecosystems. Oecologia. 2004;141(2):191–3. DOI
- Gao Q, Kang M, Xu H, Jiang Y, Yang J. Optimization of land use structure and spatial pattern for the semi-arid loess hilly–gully region in China. CATENA. 2010;81(3):196–202. DOI
- Li A, Wu J, Huang J. Distinguishing between human-induced and climate-driven vegetation changes: a critical application of RESTREND in inner Mongolia. Landsc. Ecol. 2012;27(7):969–82. DOI
- Xu Y, Tang B sin, Chan EHW. State-led land requisition and transformation of rural villages in transitional China. Habitat Int. 2011;35(1):57–65. DOI
- Bounoua L, Safia A, Masek J, Peters-Lidard C, Imhoff ML. Impact of Urban Growth on Surface Climate: A Case Study in Oran, Algeria. J. Appl. Meteorol. Climatol. 2009;48(2):217–31. DOI
- Georgescu M, Miguez‐Macho G, Steyaert LT, Weaver CP. Climatic effects of 30 years of landscape change over the Greater Phoenix, Arizona, region: 1. Surface energy budget changes. J. Geophys. Res. Atmos. 2009;114(D5). DOI
- Scanlon BR, Keese KE, Flint AL, Flint LE, Gaye CB, Edmunds WM, et al. Global synthesis of groundwater recharge in semiarid and arid regions. Hydrol. Process. 2006;20(15):3335–70. DOI
- Fricke K, Sterr T, Bubenzer O, Eitel B. The oasis as a megacity: Urumqi’s fast urbanisation in a semiarid environment: Megacity research. Erde. 2009;140(4):449-63.
- Dai A. Increasing drought under global warming in observations and models. Nat. Clim. Chang. 2012;3(1):52–8. DOI
- Elagib NA, Mansell MG. Recent trends and anomalies in mean seasonal and annual temperatures over Sudan. J. Arid Environ. 2000;45(3):263–88. DOI
- Nasrallah HA, Nieplova E, Ramadan E. Warm season extreme temperature events in Kuwait. J. Arid Environ. 2004;56(2):357–71. DOI
- Freiwan M, Kadioǧlu M. Climate variability in Jordan. Int. J. Climatol. 2008;28(1):69–89. DOI
- Alkolibi FM. Possible effects of global warming on agriculture and water resources in Saudi Arabia: impacts and responses. Clim. Change. 2002;54(1):225-45. DOI
- Rehman S, Al-Hadhrami LM. Extreme temperature trends on the west coast of Saudi Arabia. Atmos. Clim. Sci. 2012;2(3). DOI
- Tarawneh Q, Chowdhury S. Trends of Climate Change in Saudi Arabia: Implications on Water Resources. Clim. 2018;6(1):8. DOI
- Fisher M, Membery DA. Climate. In Vegetation of the Arabian Peninsula. Kluwer Academic Publishers: Netherlands. 1998:5-38.
- Chaudhary SA. Flora of the Kingdom of Saudi Arabia: Volume 1. Ministry of Agriculture and Water, Riyadh, Saudi Arabia. 2000.
- Chaudhary SA. Flora of the Kingdom of Saudi Arabia: Volume 2. Ministry of Agriculture and Water, Riyadh, Saudi Arabia. 2001.
- Mann HB. Nonparametric tests against trend. Econometrica. 1945;13(3):245-59.
- Kendall MG. Rank Correlation Methods 5th ed. Edward Arnold, London. 1990.
- Kendall MG, Gibbons JD. Rank Correlation Methods. Oxford University Press, New York. 1990.
- Almazroui M. Simulation of present and future climate of Saudi Arabia using a regional climate model (PRECIS). Int. J. Climatol. 2013;33(9):2247–59. DOI
- Chowdhury S, Al-Zahrani M. Reuse of treated wastewater in Saudi Arabia: an assessment framework. J. Water Reuse Desalin. 2013;3(3):297–314. DOI
Cite this article:
Aldughairi, A. Climate change assessment in middle and northern Saudi Arabia: Alarming trends. DYSONA – Applied Science, 2025;6(1): 60-69. doi: 10.30493/das.2024.477412