
Raghad S. Mouhamad1*; Ameerah H. Atiyah1; Ghassan AL-Azzawi1, Bassim R. AL-Bandawy2
1, Agricultural Research Directorate, Ministry of Science and Technology, Baghdad, Iraq
2, Department of Soil Sciences and Water Resources, University of Diyala, Iraq
E-mail:
raghad1974@yahoo.com
Received: 22/02/2020
Acceptance: 14/03/2020
Available Online: 16/03/2020
Published: 01/04/2020

Manuscript link
http://dx.doi.org/10.30493/das.2020.220730
Abstract
Carbon mineralization is the phenomenon where organic carbon forms are converted to carbon dioxide (CO2) which is then released to the surrounding environment. Many factors can affect carbon mineralization such as drought conditions and organic material compositing stage. This experiment aims to investigate the effect of different manure application levels in addition to different water availability levels on CO2 mineralization in calcareous soil over time. For this purpose, different mixed manure inputs of (0%, 5%, and 10%) were added to airily dried calcareous soil samples and different water availability levels (40%, 50%, and 60%) were applied. CO2 emissions were then monitored during an incubation period of 65 days 30 ±2 ○C.The results showed that by increasing organic matter input, CO2 fluxes were increased during the incubation period to reach 198.55 mg/100g soil in 10% organic matter treatments after 50 days of incubation. Water availability appeared to have little to no influence over CO2 emissions within the chosen experimental ranges. Furthermore, response surface model contours and fitted means factorial interaction plots of CO2 emissions showed that the added organic matter underwent a severe mineralization activity since the first day of incubation. These results refer to the high carbon mineralization rates in calcareous soils under dry conditions, and the increased CO2 emissions by increasing manure inputs refer to the importance of using more stable composted material rather than higher organic material inputs in this type of soil.
Keywords: Carbon dioxide, Organic fertilization, Drought, Soil
Introduction
Greenhouse gasses (GHGs) are mainly Methane (CH4), Carbon dioxide (CO2), and nitrous oxide (N2O) gases that escape as a result of different activities and form a trapping layer for the omitted earth infrared radiation resulting in a warmer climate. The energy production sector holds the main share of GHGs emissions with 66.5% of the total generated GHGs, while on the other hand, agricultural production processes contribute with 13.5% of the total emitted GHGs [1]. Although soil with its organisms is considered a fundamental CO2 reservoir; it was reported that 35%, 47%, and 53% of the total agricultural CO2, CH4, and N2O emissions respectively are soil originated [2]. Therefore, with the international relentless pursuit to cut on GHGs emissions including those induced by agricultural practices, more studies are required to monitor GHGs fluxes of different agricultural production phases and under different conditions [3]
The organic matter is one of the main soil components and it contributes to improving the physical, chemical, fertile and biological characteristics of the soil. Organic matter is a mixture of plants, animals and microorganisms residues in different states of decomposition and stability. The organic substance in the soil was classified according to the degree of decomposition into easily decomposing forms such as simple sugars and proteins; slow decomposing compounds such as cellulose And hemicellulose; and difficult to decompose such as lignins, waxes, chitin, and multiple phenols. Soils differ in their organic matter content depending on vegetation, climate, and agricultural exploitation; as this content is less than 0.1% in desert soils and 100% in peat soils [4].
Carbon mineralization is the process where organic carbon is converted into carbon dioxide (CO2) under the effect of soil microorganisms [5][6][7]. This phenomenon not only constantly minimizes the organic matter content in the soil but also imposes great hazards to the environment taking into consideration the huge amounts of CO2 escaping to the atmosphere especially under drought conditions and poor soil structure [8]. One of the most common methods for estimating the organic decomposition in the soil is measuring the amount of carbon dioxide released from organic matter during an incubation period and under standard conditions [9][10]. All the organic matter that is added to the soil undergoes a breakdown process by soil organisms and then respires as CO2 while the rest of it is synthesized into other more stable forms as it is reported that 60-80% of the remaining stabilized organic matter is humus [11].
Water stress occurs as a result of soil water availability shortages, resulting in plant growth disruption and an overall production decrease [12]. Various methods have been used to induce efficient tolerance to water stress and to enhance nutrients availability under water stress conditions such as the use of beneficial microorganisms; the addition of organic matter and nutrients; the use of chemicals such as proline, silicon, and Osmoprotectants [13]. Although organic matter plays a vital role in enhancing chemical and physical properties in soils including water stress tolerance, the fast mineralization of organic material under dry conditions is considered a major environmental setback [14]. Therefore, this study aimed to investigate the effects of different amounts of organic manure inputs under different levels of water stresses on CO2 emissions over time.
Materials and Methods
Soil and manure properties
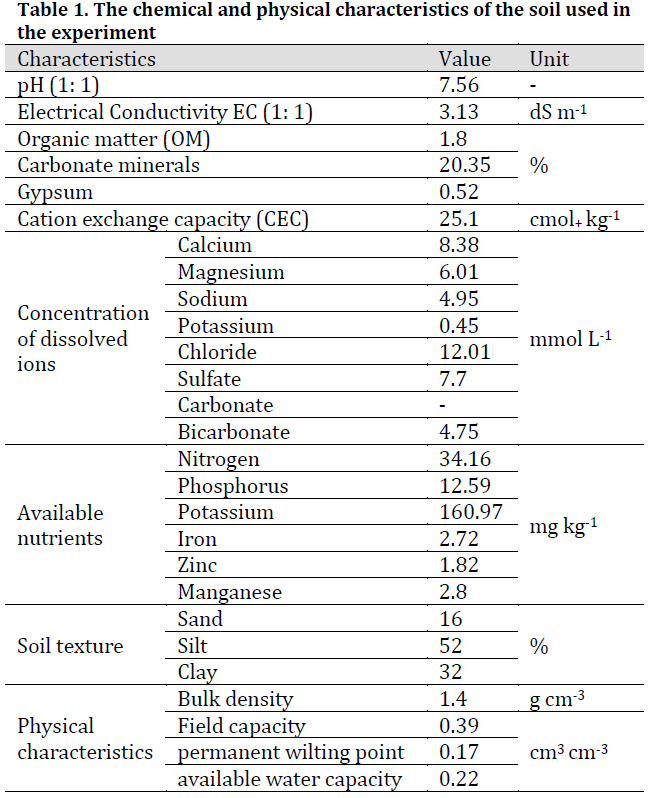
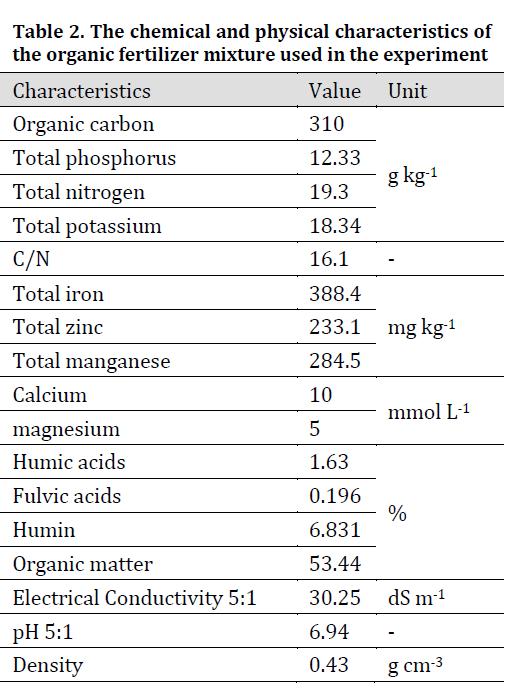
Soil and manure mixture (cows, sheep and poultry manure mixture 1: 1: 1) chemical and physical properties were determined by the methods provided in [15] and the results of the analysis are shown in (Table 1 and 2) respectively.
Experimental materials and levels
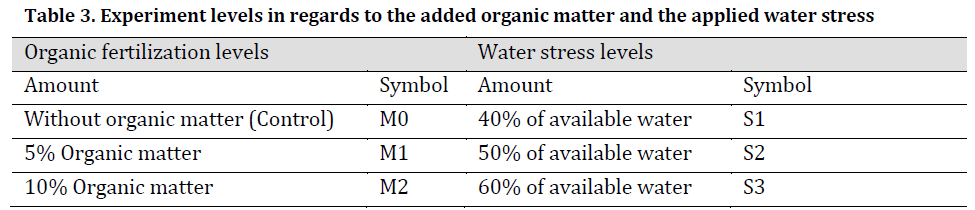
The soil was aerially dried and 100 g samples were weighed. Three levels of manure (0, 5, and 10% of the soil weight) were applied. The added manure was then mixed well with the soil and the formed mixtures were then transferred to plastic bottles with airtight septa. After that, three levels of water stress were applied by adding different amounts of water (40, 50 and 60% plant-available water capacity). The bottles were then incubated under a temperature of 30 ±2 ○C for a period of 65days, and the amount of carbon dioxide released from the soil was estimated after 0, 2, 5, 7, 13, 16, 31, 50, and 65 days of incubation. The lost water was compensated by registering the weights of the bottles and adding water according to the loss in weight. Experiment levels are shown in (Table 3).
Released CO2 measurement
Released CO2 was estimated based on [16] method. 20 mL of sodium hydroxide (1 N) was added to the air-tight bottles used in the experiment through the bottle’s septum, as CO2 reacts with sodium hydroxide and produces sodium carbonate. Then, by adding drops of barium chloride solution 50% to form barium carbonate as seen in the following equations:
2NaOH + CO2 → NaCO3 + H2O
NaCO3 + BaCl → 2NaCl + BaCO3↓
After that, the formed barium carbonate was titrated against 0.5 N of hydrochloric acid, using phenolphthalein as a reaction endpoint indicator. CO2 was then estimated using the following equation:
Released CO2 mg/100 g soil = (B-V) NE
When B: Volume of the acid consumed (ml) in control titration.
V: Volume of the acid consumed (ml) in treatment titration.
N: Hydrochloric acid normality
E: the equivalent weight of CO2 (22 g)
Statistical analysis
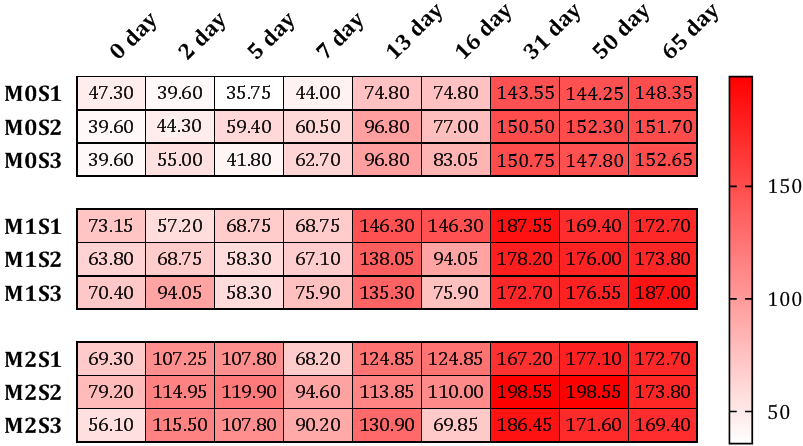
The experiment was carried out in a completely randomized experimental design with three replicates for each treatment at each evaluation. Means were compared using Tukey’s least significant difference (LSD) test at a confidence level of p=0.05. Mean CO2 fluxes heat map was constructed using GraphPad Prism 7 software. Contour plotting for CO2 emissions and response surface analysis was carried out using Minitab 19 software.
Results and Discussion
Results have shown a significant increase in CO2 emissions after 13 days of incubation and another increase was observed after 31 days even in control treatments without organic material additions (M0) and under all water stress conditions; however, CO2 emissions in both 5% (M1) and 10% (M2) treatment were significantly higher than those of (M0) treatment and under all water availability treatments (S1, S2, and S3) with no significant differences in CO2 levels between (M1) and (M2) (Fig. 1). These observations in M0 treatments are contributed to carbon mineralization in the already existed organic material in soil samples (Table 1) and the almost instantaneous increase in both (M1) and (M2) treatments (2-5 days after incubation) along with the additional increase later are attributed to the added manure. These results are similar to those obtained by [17] who reported that the addition of composted dairy manure caused a sudden increase in carbon mineralization mainly originated from the already present organic matter. The highest observations were noticed in M2S2 treatment with CO2 emission of 198.55 mg/100 g soil. The increasing trend in CO2 emissions after organic matter application and overtime was previously reported by [18-22].
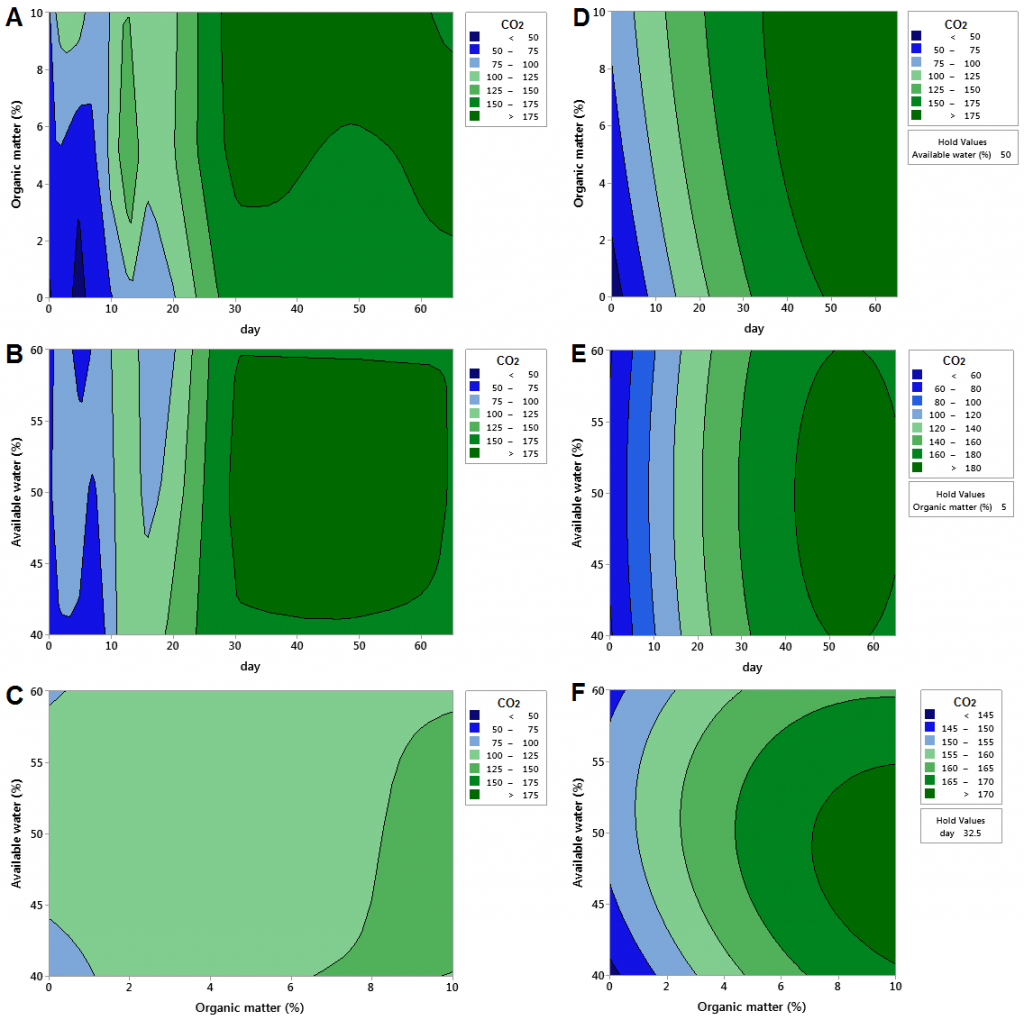
By fitting the data into a response surface design, original CO2 flux data contour plots (Fig 2. A, B, and C) showed high similarity to those of response surface contour plots (Fig. 2 D, E, and F). Evaluation day and organic matter interaction contour plot (Fig. 2 A) illustrated that regardless of water availability, soil underwent two sharp peaks of CO2 emissions with M1 treatments one of which after 30 days of incubation and the other after 60 days. On the other hand, those two peaks were substituted with a plateau of CO2 emission under M2 treatments while no sharp flux was noticed under M0 treatments (Fig. 2 A). However, response surface analysis showed that CO2 flux plateau extended to include M0 treatment after 50 days of incubation (Fig. 2 D). Fixing the manure input has shown a similar C mineralization behavior between all three water availability treatments (S1, S2, and S3) throughout incubation period with a CO2flux lower than 175 mg/100g soil during the first 30 days of incubation and higher during the following days (Fig. 2 B and E). Interestingly, the relation between different organic material and available water levels was less complicated with only three grades contour plot (Fig. 2 C). CO2 fluxes appeared to decrease either by decreasing organic matter input (M0) or by increasing water availability (S3) while on the other hand, the highest emission levels were observed with high organic matter and low available water treatments (Fig. 2 C and F). The increased CO2 fluxes observed when higher levels of organic matter were applied (Fig. 2 A and D) were also reported by [23] who observed an increase in CO2 emissions by increasing compost input of different sources; however, our results showed an even more increase throughout time which is contributed to the used manure in the current experiment which had much less composting stable profile.
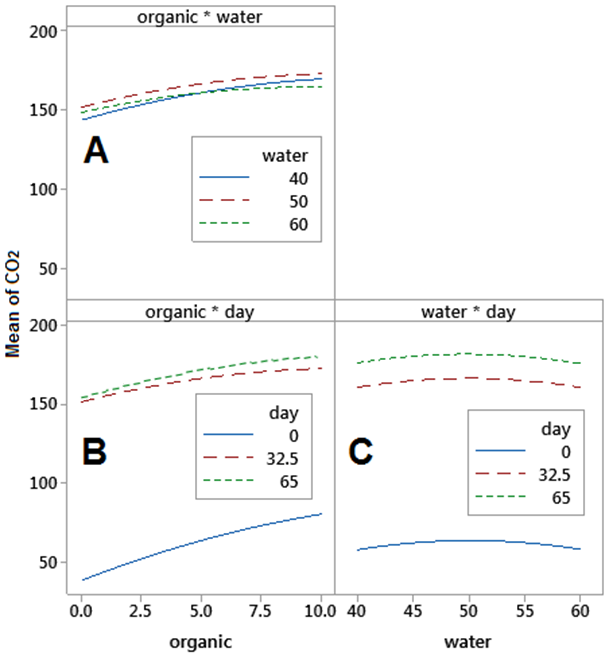
Fitted means factorial interaction plots of CO2 emissions were obtained (Fig. 3). Organic matter and water availability interaction plot showed that different levels of water availability had an almost identical CO2 flux (Fig. 3 A). Furthermore, water availability and evaluation day interaction plot showed that different water levels had no effect on CO2 emission for the same evaluation period (Fig. 3 C). These observations indicated that there was little to no effect contributed to water availability levels (S1, S2, and S3) on CO2 flux within the different other dimensions of the model (time and added organic material). Water availability treatments used in the current experiment (40%, 50%, and 60%) did not induce significant differences in CO2 fluxes under experiment condition; however, it was previously reported that increasing water levels to reach 100% of field capacity had significantly increased CO2 emissions when compared to CO2 fluxes under 70% of field capacity after 90 days of compost application for both sand and silt-clay soils [8]. Furthermore, [19] previously reported a dramatic increase in CO2 fluxes after re-wetting dry soils of high organic content. An increasing trend in CO2 emissions by increasing manure input was observed directly after organic material application (day 0) as can be seen in (Fig. 3 B) and the most dramatic increase in CO2 fluxes was observed during the first month of incubation(Fig. 3 B and C) which is similar to [17]. Therefore, to increase the stability of organic matter in dry soils, more stable organic sources rather than higher organic matter inputs should be used [18][23-25].
Conclusions
It is obvious that CO2 emissions in calcareous soil due to organic matter mineralization under drought conditions are already high and increase throughout time. Additionally, CO2 fluxes increase by increasing manure inputs and this increase is more dramatic during the first 30 days of application regardless of water availability conditions. These results refer to the importance of using more stable composted material rather than higher organic material inputs in this type of soil.
References
| 1 | Herzog T. World greenhouse gas emissions in 2005. World Resources Institute. 2009. |
| 2 | Yousefi M, Damghani AM, Khoramivafa M. Comparison greenhouse gas (GHG) emissions and global warming potential (GWP) effect of energy use in different wheat agroecosystems in Iran. Environ. Sci. Pollut. Res. 2016;23(8):7390-7. DOI |
| 3 | Mohammed S, Alsafadi K, Takács I, Harsányi E. Contemporary changes of greenhouse gases emission from the agricultural sector in the EU-27. Geology, Ecology, and Landscapes. 2019:1-6. DOI |
| 4 | Mouhamad RS, Rasheed AG, AL-Gburi HF, Nazir A, Iqbal M, Razaq I. Predicting Soil Organic Carbon Turnover in Soils at the Middle Region of Iraqi Using Infrared Spectra. Jacobs Journal of Plant Biology. 2019;4(1): 009. |
| 5 | Wu J, Brookes PC. The proportional mineralisation of microbial biomass and organic matter caused by air-drying and rewetting of a grassland soil. Soil Biol. Biochem. 2005;37(3):507-15. DOI |
| 6 | Mouhamad RS, Razaq IB, Fadhel AS, Yousir SA, Taha DI, Iqbal M. Urease activity under salinity stress in calcareous soils of semi-arid regions of Iraq. Int. J. Biol. Sci. 2014;6:68-71. |
| 7 | Mouhamad R, Atiyah A, Mohammad R, Iqbal M. Decomposition of organic matter under different soil textures. Curr. Sci. 2015;1(1):22-5. |
| 8 | Abdelhafez AA, Abbas MH, Attia TM, El Bably W, Mahrous SE. Mineralization of organic carbon and nitrogen in semi-arid soils under organic and inorganic fertilization. Environ Technol Inno. 2018;9:243-53. DOI |
| 9 | Awad YM, Blagodatskaya E, Ok YS, Kuzyakov Y. Effects of polyacrylamide, biopolymer and biochar on the decomposition of 14C‐labelled maize residues and on their stabilization in soil aggregates. Eur. J. Soil Sci. 2013;64(4):488-99. DOI |
| 10 | Awad YM, Blagodatskaya E, Ok YS, Kuzyakov Y. Effects of polyacrylamide, biopolymer, and biochar on decomposition of soil organic matter and plant residues as determined by 14C and enzyme activities. Eur. J. Soil Biol. 2012 Jan 1;48:1-10. DOI |
| 11 | Boyd CE. Water quality: an introduction. Springer Nature; 2019. |
| 12 | Barnes RT, Gallagher ME, Masiello CA, Liu Z, Dugan B. Biochar-induced changes in soil hydraulic conductivity and dissolved nutrient fluxes constrained by laboratory experiments. PloS one. 2014;9(9). DOI |
| 13 | Fang Y, Singh B, Singh BP. Effect of temperature on biochar priming effects and its stability in soils. Soil Biol. Biochem. 2015;80:136-45. DOI |
| 14 | Mouhamad RS, Mohammed ZJ, Abdulhadi AA, Abbas M, Iqbal M, Nazir A. Production and characterization of organic manure from liquorice residues. Inf. Process. Agric. 2019;18: 45-51. DOI |
| 15 | Page AL, Miller RH, Keeney DR. Methods of soil analysis. Part 2: Chemical and microbiological properties. Amer. Soc. Agron. Soil Sci. Soc. Amer. In, Madison, Wisconsin, USA. 1982. |
| 16 | Alavoine G, Nicolardot B. Comparison of potentiometric titration, IR spectrophotometry and segmented micro-flow analysis to determine inorganic C in alkaline solutions. Analytical and bioanalytical chemistry. 2002;374(2):354-8. DOI |
| 17 | Liang BC, Gregorich EG, Schnitzer M, Voroney RP. Carbon mineralization in soils of different textures as affected by water-soluble organic carbon extracted from composted dairy manure. Biol. Fertil. Soils. 1996;21(1-2):10-6. DOI |
| 18 | Bernal MP, Sanchez-Monedero MA, Paredes C, Roig A. Carbon mineralization from organic wastes at different composting stages during their incubation with soil. Agric. Ecosyst. Environ. 1998;69(3):175-89. DOI |
| 19 | Fenner N, Freeman C. Drought-induced carbon loss in peatlands. Nat. Geosci. 2011;4(12):895-900. DOI |
| 20 | Wang C, Lu X, Mori T, Mao Q, Zhou K, Zhou G, Nie Y, Mo J. Responses of soil microbial community to continuous experimental nitrogen additions for 13 years in a nitrogen-rich tropical forest. Soil Biology and Biochemistry. 2018;121:103-12. DOI |
| 21 | Wang R, Hu Y, Wang Y, Ali S, Liu Q, Guo S. Nitrogen application increases soil respiration but decreases temperature sensitivity: Combined effects of crop and soil properties in a semiarid agroecosystem. Geoderma. 2019;353:320-30. DOI |
| 22 | Taylor LL, Leake JR, Quirk J, Hardy K, Banwart SA, Beerling DJ. Biological weathering and the long‐term carbon cycle: integrating mycorrhizal evolution and function into the current paradigm. Geobiology. 2009;7(2):171-91. DOI |
| 23 | Zhang X, Zhao Y, Zhu L, Cui H, Jia L, Xie X, Li J, Wei Z. Assessing the use of composts from multiple sources based on the characteristics of carbon mineralization in soil. Waste Manag. 2017;70:30-6. DOI |
| 24 | Mouhamad R, Atiyah A, Iqbal M. Behavior of Potassium in Soil: A mini review. Chem. Int. 2016;2(1):58-69. |
| 25 | Chen F, Yan G, Xing Y, Zhang J, Wang Q, Wang H, Huang B, Hong Z, Dai G, Zheng X, Liu T. Effects of N addition and precipitation reduction on soil respiration and its components in a temperate forest. Agricultural and forest meteorology. 2019;271:336-45. DOI |
Cite this article:
Mouhamad, R., Atiyah, A., Al-Azzawi, G., Al-Bandawy, B. CO2 emissions in calcareous soil under various manure additions and water availability levels. DYSONA – Applied Science, 2020;1(1): 36-42. doi: 10.30493/das.2020.220730