
Frank Chibuzor Okenmuo 1,2*; Temitayo Abayomi Ewemoje 3
1, Department of Environmental Management, Pan African University of Life and Earth Sciences Institute, University of Ibadan, Ibadan, Nigeria
2, Department of Soil Science, Faculty of Agriculture, Chukwuemeka Odumegwu Ojukwu University, Igbariam, Nigeria
3, Department of Agricultural and Environmental Engineering, University of Ibadan, Ibadan, Nigeria
E-mail:
fcvokenmuo1@gmail.com
Received: 26/06/2022
Acceptance: 25/08/2022
Available Online: 26/08/2022
Published: 01/01/2023

Manuscript link
http://dx.doi.org/10.30493/DAS.2022.349144
Abstract
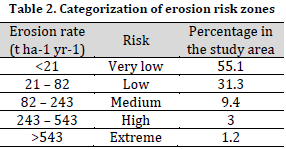
The urban watershed of Obibia River is rapidly being degraded owing to pressures from increasing population and associated land-use changes. Erosion, an aspect of land degradation, has often been assumed to be costly and catastrophic due to the inability to accurately detect its occurrence at the early stages to initiate conservation measures. This study aims to apply revised universal soil loss equation (RUSLE), remote sensing, and geographic information system (GIS) to accurately detect incipient soil erosion hazards in Obibia River watershed. The multi-source data for RUSLE was based on erosion factors of rainfall erosivity (R), soil erodibility (K), slope length and steepness (LS), and the vegetation (C) combined within a GIS environment. The erosion hazard map indicated erosion categories were: very low (55.1% <20 t ha-1 yr-1), low (31.3% 21-82 t ha-1 yr-1), medium (9.4% 82-243 t ha-1 yr-1), high (3% 234-543 t ha-1 yr-1); and extreme (1.2% >543 t ha-1 yr-1). Most extreme forms of erosion occurred in undulating landscapes near river bodies. The entire erosion categories require urgent management considerations except for the low categorization. The data can be relied upon for hydro-soil erosion identification, management, and control.
Keywords: Soil erosion, Remote sensing, Environmental management, Geographic information system
Introduction
Soil erosion ranked highly among the critical environmental problems of the 21st century. It is responsible for yield declines, deterioration of soil functions, and increased hydro-geological vulnerabilities of communities [1-3]. The physical conditions that lead to erosion are variations in rainfall and vulnerability to frequent extreme flooding or drought and other factors [4][5]. On the other hand, human population growth, climate change due to fossil fuel consumption, loss of biodiversity due to deforestation, the adverse effects of technology adoption, ill-suited government policies, and weak conservation bodies are largely contributing to sustained soil erosion occurrences [6][7].
Nowadays, the Obibia watershed of Anambra, Nigeria, is witnessing rapid urban development, especially in the mid and bottommost section of the basin, where significant towns such as Awka and Mbaukwu are located [8]. Furthermore, the fast urban development in the area is associated with the increase in paved areas along with the destruction of vegetation and blockage of watercourses. The high predisposition of this watershed to flood incidents has been reported [8], which is often accompanied by soil losses. Such losses result in gullies when runoff depths increase. At this stage, soil erosion can pose a serious challenge for land users and managers. Therefore, it is necessary to detect soil erosion and control it before it reaches a more critical stage.
Researchers have made several attempts to understand the nature of soil erosion in Southeastern Nigeria using runoff plots [9], erosion pins, and models [10][11]. In terms of modeling, the revised universal soil loss equation (RUSLE) has shown promising results in detecting erosion-prone areas within Anambra State. Such models might assist in identifying the more prone areas within the erosion risk zones, and this understanding could be a more accurate and cost-effective way for soil erosion prediction and appropriate control.
RUSLE is an empirical model applied in many regions of the world to detect sheet and inter-rill erosion [12]. Its usefulness spans data-limited areas, and its capability is enhanced when combined with remote sensing in a GIS environment. Previously, USLE/RUSLE erosion predictions were comparable to on-ground or actual erosion hazards within southern Nigeria [10][12]. However, the studies attempting to address soil erosion in the Southeastern region at a watershed scale are still scarce [13].
Since a watershed-scale approach will aid in assessing soil loss and the consistent prioritization of critical erosion areas, the current study aimed to investigate the potential of RUSLE, remote sensing, and GIS in detailed mapping of soil erosion hazards within the Obibia watershed. The results of this study will help authorities take appropriate soil and water conservation action to minimize soil loss in target areas within the watershed. It will also serve as a vital tool for policymakers, soil scientists, geographers, and land users
Materials and Methods
Study area
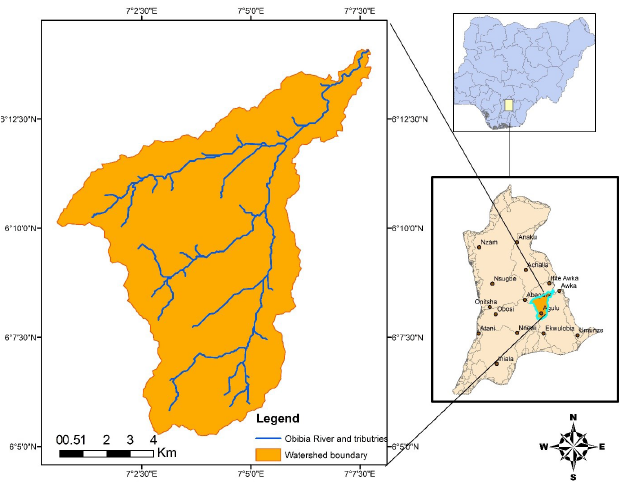
The study area lies within latitudes 6º4ꞌ30ꞌꞌ and 6º15ꞌ30ꞌꞌ N and longitudes 7º1ꞌ00ꞌꞌ and 7º8ꞌ00ꞌꞌ E of Southeastern Nigeria. It has a land area of 95.955 km2 and includes multiple towns such as Awka and Agulu (Fig. 1). The elevation of the area is between 43 – 298 m. Geologically, the watershed is comprised mainly of the Imo Clay Shale and the Bende-Ameki Formation. The Imo Clay Shale also covers parts of Kogi State, while the Bende-Ameki formation covers most of the south and west of the watershed [8]. The soils are mainly reddish sands, and the area falls within the humid tropical climate (Koppen’s Awi climate) with an annual rainfall of about 1500 mm – 3000 mm [14]. The dry and wet weather condition prevails in the area. The months of March to October are mainly the wet season, while the period from November to April is usually classified as the dry season. During the wet season, the temperature varies from 23ºC to 26ºC, and the winds are predominant southwest [15][16]. The dry season temperature ranges from 26ºC to 35ºC, with February-April being the hottest period of the year [10][14]. The waterbodies branch off in a dendritic pattern, and the fourth-order basin has a total stream length of 102.25 km [8]. The high rainfall, size, and drainage pattern of the basin possess hydrological risks such as flooding. Much of the vegetation was extensively deforested, and the land was put to other uses such as agriculture and urban development, leaving the area with thinner vegetation except for streams, river channels, and lakes sides [15]. Hence the tropical rainforest vegetation is fast adjusting to derived savannah vegetation, and the process is amplified by climate change and soil erosion.
Data pre-processing
The 30 m Digital Elevation Model (DEM) acquired from Shuttle Radar Topographic Mission (SRTM) (1-arc second) resolution data was retrieved from the OpenTopography website (https://opentopography.org/). The data was processed using the Hydrologic analysis of the ArcGIS 10.4 Spatial Analyst tool to delineate and extract the stream network and the watershed area.
The RUSLE model factors
The RUSLE is a popularly adopted mathematical model that uses data from multiple sources (Fig. 2) as input for depicting soil loss over an area. The combination of the inputs is commonly expressed in the Universal Soil Loss Equation (USLE) [17]. The soil loss is a product of five environmental factors (Equation 1):
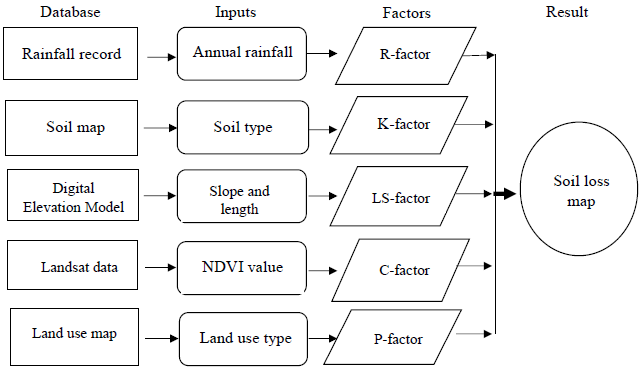
A = R×K×(LS)×C×P (1)
Where A is the mean annual soil loss (t ha-1 yr-1), R is the rainfall factor or rainfall erosivity factor (MJ mm ha-1 h-1 yr-1), K is the soil erodibility factor (t ha h MJ-1 mm-1), L is the slope length factor (unitless), S is the slope steepness factor (unitless), C is the cover and management factor (unitless), and P is the support practice factor (unitless).
Rainfall erosivity factor (R)
The rainfall erosivity factor (R-factor) summarizes the energy value of rainfall events over time [17]. The rainfall erosivity can alter in response to the variability of rainfall patterns (intensity, frequency, and distribution). In this study, the rainfall data used were raw monthly rainfall data of 20 years (1998-2017) acquired from the Nigerian Meteorological Agency (NIMET) and scrutinized for errors and consistency. The R-factor over the study area was assumed to be uniform. In the absence of an autographic rain gauge for determining rainfall intensity EI30, modified Fournier’s index (MFI) (Equation 2), developed from the Fournier index (FI) [18][19], was used.

Where, MFI – modified Fournier index;
Pi – monthly total precipitation (mm);
P – annual total precipitation (mm)
The equation for West Africa (Equation 3)

Where, R is the rainfall erosivity factor (MJ mm·ha−1 y r −1)
MFI is the modified Fournier index
Soil erodibility (K)
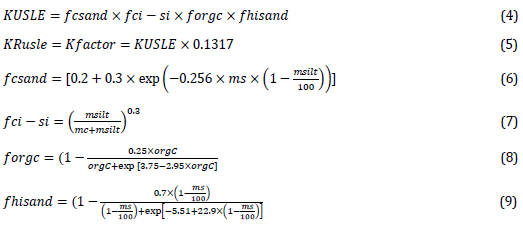
Soil erodibility (K-factor)is the response of soil to rainwater. Soil response to the eroding force depends on the physical, chemical, structural, and hydrologic characteristics [20][21].The FAO Harmonized World Soil Database (HWSD) version 1.2 [22] provided soil data which included classes and attribute values.The downloaded soil image file is a raster in Band Interleaved by Line (BIL) format, containing an attribute database. Textural class, cation exchange capacity of soil, clay fractions, granulometry, sodium exchange percentage, water storage capacity, organic carbon, pH, soil depth, salinity, and gypsum contents are contained. A hand-held global positioning system (GPS) was used for ground-truthing between May 2019 and July 2019. The digital soil map was imported into ArcGIS 10.4 environment and read. K-factor was calculated using equations 4-9 proposed by Williams [23]
Where,
fcsand: a factor that equates low soil erodibility to soils with high coarse sand contents and high values to soils with minute sand
fci-si: a factor that equates low erodibility to soils with high clay to silt ratios
forgc: a soil erodibility factor based on its organic carbon content
fhisa: a soil erodibility factor based on its sandiness
ms: sand fraction content (particles with a diameter of 0.5 to 2 mm diameter) (%)
msilt: silt fraction content (particles with a diameter of 0.002 to 0.05 mm) (%)
mc: clay fraction content (particles <0.002 mm in diameter) (%)
orgC: organic carbon fraction content (%)
Slope length (L) and steepness (S) factors
The LS-factor represents the influence of topography on soil erosion. Sub-factor L is the slope length. The original field slope length was 72.6 foot (22.1 m). Sub-factor S is the slope steepness representing the effect of slope steepness on erosion. Soil loss increases more rapidly with slope steepness than with slope length. In the present study, DEM with a spatial resolution of 30 m acquired from the OpenTopography website (https://opentopography.org/) was combined with an approach developed by [24] (Equation 10) in ArcGIS 10.4 for LS-factor estimation.
LS= (λ/22.13) 0.4 × (0.01745 Sin Ɵ /0.0896)1.4 ×1.4 (10)
Where:
λ= Flow Accumulation × Cell resolution (DEM)
Ɵ: Slope angle in degree
Areas with flow accumulation greater than 0.5 ha were excluded from LS factor estimation and considered to constitute drainage channels.
Crop management factor (C)
Crop Management Factor (C-factor) is the factor of vegetation cover, cropping systems, and land use, which impact runoff and erosion rates and is estimated based on satellite images. A cloud-free Landsat 8 OLI/TR image of 1st February 2018 (path 189, row 56) was downloaded from the website https://earthexplorer.usgs.gov. The image acquired was subsequently used to determine the Normalized Difference Vegetation Index (NDVI). The equation for NDVI is given by:
NDVI = (B5 + B4) / (B5 – B4) (11)
Where B4 and B5 stand for Bands 4 and 5 in Landsat electromagnetic spectrum, respectively.
The regression equation used in this study was based on [25], which is given as:
C = 0.431 – 0.805 NDVI (12)
Support practice (P)
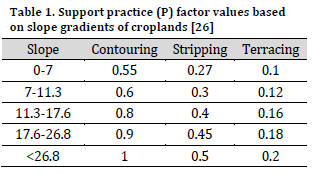
Support practice factor (P) is the effect of conservation practices that affect soil loss compared with soil loss under up and downhill cultivation [20]. Contouring, terracing, cross slope cultivation, and strip cropping can reduce the impact of runoff and consequently minimize soil erosion. The P-factor was determined using data proposed by Korea Institute of Construction Technology for three support practices based on a study in South Korea [26]. Contouring was the predominant support practice in the area. Hence, the slope map was assigned equivalent values (Table 1). The slope data were reclassified in ArcGIS 10.4.
Results and Discussion
RUSLE factors spatial distribution
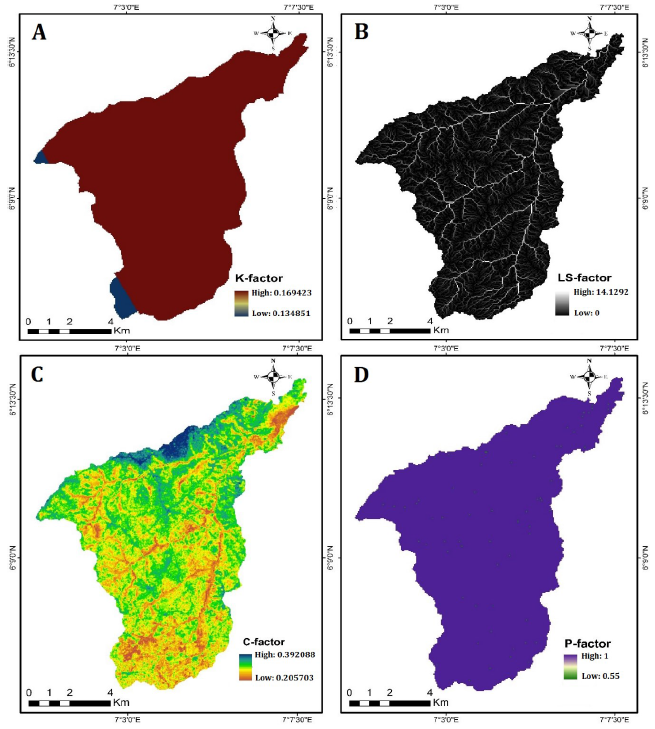
The calculated R-factor of the watershed for 20 years was an average of 1,155.05 MJ mm ha-1 h-1 year-1. The K-values obtained for the study area ranged from 0.13-0.17. The LS-factor values ranged from 0-14, while the C-factor values ranged from 0.21-0.39. The higher NDVI values of the C-factor imply a greater likelihood of soil erosion due to poor land cover management, while the lower NDVI values are encountered in forest with better land cover management. The P-factor values ranged between 0.55 and 1. Values tending to zero indicate improved conservation practices, while values toward 1 indicate a decline in conservation support systems (Fig. 3).
Soil loss estimation
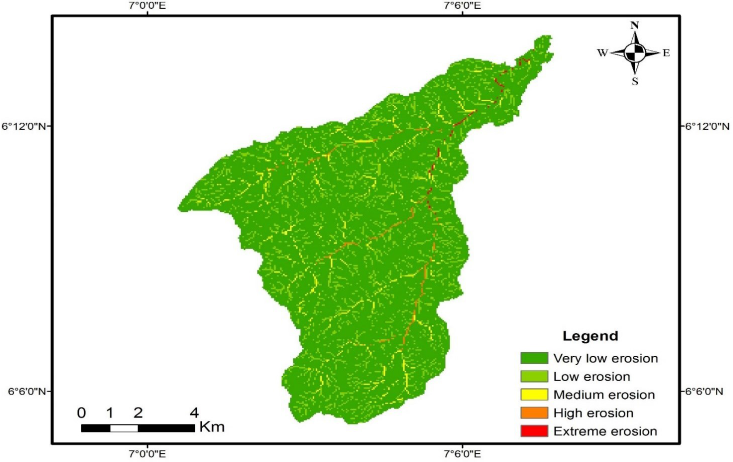
Soil loss is obtained from multiplying the five environmental factors: rainfall, erodibility, vegetation cover, slope, and support practices. The results of the current study showed the presence of an extreme soil loss of 543 t ha-1 yr-1 (Table 2). [10][11] reported values similar to those obtained in this study under a similar environment using the RUSLE model. The variations in the results may be due to data, methodology, and scale employed by authors in various parts of Southeastern Nigeria. However, this study and previous results have consistently been above the soil loss tolerances of 5-10 t ha-1 yr-1 [17]. The reclassified map (Fig. 4) shows five categories of erosion risk based on the calculated output. These categories are namely: very low erosion risk (55.1%), low erosion risk (31.3%), medium erosion risk (9.4%), high erosion risk (3%), and 1.2% extreme erosion risk. A similar 91%, 7%, and 2% for low, medium, and high soil erosion risk, respectively, was reported for the entire Anambra State [27]. The northeastern, central, and southeastern parts of the watershed, where rapid urbanization and population growth took place around Mbaukwu, Nise, Enugwu-ukwu, Amawbia, Nibo, and Awka locations had the most vulnerability to extreme and high erosion risks. Field checks revealed that the areas had steep slopes and corresponded with extremely gullied and river-silted areas. In fact, an overlap between the areas with high LS-factor (Fig. 3 B) and medium-extreme erosion risk zones (Fig. 4) can be noticed. The impact of slope factor on soil erosion in areas with low vegetation cover has been reported by [27][28]. Therefore, a well-tailored erosion conservation plan should consider slope steepness reduction as a critical factor in soil erosion management in the watershed. Furthermore, community-based soil erosion management programs should be prioritized to better address the problem of slope reduction at the farm level, preventing the escalation of soil erosion.
Conclusion
Soil loss in the Obibia watershed was quantified and mapped by integrating the RUSLE in a GIS environment. The result obtained in this study implies that the watershed is under different categories of erosion risks. Sustainable development programs of the watershed should focus on proper land use, slope length reduction, adoption of green infrastructures, adequate water channeling, and removal of obstructions from drainage channels in low to extreme erosion risk zones. Appropriate soil and water conservation programs should also form part of developmental efforts in this rapidly urbanized watershed.
Acknowledgment
The authors acknowledge the African Union under the Pan African University Doctoral Scholarship for funding the doctoral research of the first author. Their support is greatly appreciated.
Conflict of interest statement
The authors declared no conflict of interest.
Funding statement
The authors declared receiving the funding of the African Union under the Pan African University Doctoral Scholarship during the doctoral research of the first author.
Data availability statement
The authors declared that all related data are included in the article.
References
| 1 | Akamigbo FOR. Soils:fundamental methods of soil resource survey, classification, interpretation and application.Enugu: University Press Limited. 2010. |
| 2 | Lal R. Desertification and soil erosion. Global environmental change. 2014;1:369-78. DOI |
| 3 | Egboka BC, Orji AE, Nwankwoala HO. Gully Erosion and landslides in southeastern Nigeria: causes, consequences and control measures. Glob. J Eng. Sci. 2019;2(4). DOI |
| 4 | Obalum SE, Buri MM, Nwite JC, Watanabe Y, Igwe CA, Wakatsuki T. Soil degradation-induced decline in productivity of sub-Saharan African soils: the prospects of looking downwards the lowlands with the Sawah ecotechnology. Appl. Environ. Soil Sci. 2012. DOI |
| 5 | Tilahun M. The Economics of Land Degradation in Africa_Benefits of Action Outweigh the Costs_A complementary report to the ELD Initiative. Economics of Land Degradation Initiative (ELD), Bonn, Germany. 2015. |
| 6 | Ananda J, Herath G. Soil erosion in developing countries: a socio-economic appraisal. J. Environ. Manage. 2003;68(4):343-53. DOI |
| 7 | Pimentel D, Burgess M. Soil erosion threatens food production. Agriculture. 2013;3(3):443-63. DOI |
| 8 | Ezenwaji EE, Nwabineli EO, Phil-Eze PO. Investigations into the Morphometric Characteristics of Obibia Drainage Basin, Awka Urban Area, Nigeria. Open J. Modern Hydrol. 2017;8(1). DOI |
| 9 | Iwara AI, Ewa EE. Seasonal variability in runoff, sediment and nutrient losses in vegetation fallows in the Rainforest zone of Southern Nigeria. Ghana J. Geogr. 2018;10(1):42-57. |
| 10 | Igwe CA, Mbagwu JS. Application of SLEMSA and USLE erosion models for potential erosion hazard mapping in South-Eastern Nigeria. Int. Agrophys. 1999;13(1):41-8. |
| 11 | Fagbohun BJ, Anifowose AY, Odeyemi C, Aladejana OO, Aladeboyeje AI. GIS-based estimation of soil erosion rates and identification of critical areas in Anambra sub-basin, Nigeria. Model. Earth Syst. Environ. 2016;2(3). DOI |
| 12 | Adeola FO, Ubom O, Adeyemi O. Estimating soil loss from soil Erosion-induced land degradation in Uyo Metropolis, Nigeria Using Remote Sensing Techniques and GIS. Ife Res. Publica. Geogr. 2016;12(1):120-37. |
| 13 | Odunuga S, Ajijola A, Igwetu N, Adegun O. Land susceptibility to soil erosion in Orashi Catchment, Nnewi South, Anambra State, Nigeria. Proceedings of IAHS. 2018;376:87-95. DOI |
| 14 | Nigeria Meterological Agency, NMA. Nimet seasonal rainfall prediction [SRP]. Abuja, Nigeria. 2013. |
| 15 | Onu NN, Ibezim CU. Hydrogeophysical investigation of Southern Anambra Basin Nigeria. Glob. J. Geol. Sci. 2004;2(2):221-33. DOI |
| 16 | Ifeka A, Akinbobola A. Trend analysis of precipitation in some selected stations in Anambra State. Atmos. Clim. Sci. 2015;5(1). DOI |
| 17 | Wischmeier WH, Smith DD. Predicting rainfall erosion losses: a guide to conservation planning. Department of Agriculture, Science and Education Administration. 1978. |
| 18 | Arnoldus HM. Methodology used to determine the maximum potential average annual soil loss due to sheet and rill erosion in Morocco. FAO, Rome, Italy. 1977. |
| 19 | Arnoldus HM. An approximation of the rainfall factor in the Universal Soil Loss Equation. Land and Water Development Division, FAO, Rome, Italy. 1980:127-32. |
| 20 | Ojo-Atere JO, Ogunwale JA, Oluwatosin GA. Fundamentals of tropical soil science. Evans Brothers. 2009. |
| 21 | Das DK, Das DK. Introductory soil science. Kalyani publishers. 2004. |
| 22 | Fischer G, Nachtergaele F, Prieler S, Van Velthuizen HT, Verelst L, Wiberg D. Global agro-ecological zones assessment for agriculture (GAEZ 2008). IIASA, Laxenburg, Austria and FAO, Rome, Italy. 2008;10. |
| 23 | Williams JR. The EPIC Model. Computer models of watershed hydrology. Highlands Ranch, CO: Water Resources Publication. 1995:909-1000. |
| 24 | Moore ID, Burch GJ. Physical basis of the length‐slope factor in the universal soil loss equation. Soil Sci. Soc. Am. J. 1986;50(5):1294-8. DOI |
| 25 | Jong SM. Applications of reflective remote sensing for land degradation studies in a Mediterranean environment. Koninklijk Nederlands Aardrijkskundig Genootschap. 1994. |
| 26 | KICT. The development of selection standard for calculation method of unit sediment yield in river. Korea Institute of Construction Technology [KICT]. 1992. |
| 27 | Ajibade FO, Nwogwu NA, Adelodun B, Abdulkadir TS, Ajibade TF, Lasisi KH, Fadugba OG, Owolabi TA, Olajire OO. Application of RUSLE integrated with GIS and remote sensing techniques to assess soil erosion in Anambra State, South-Eastern Nigeria. J. Water Clim. Chang. 2020;11(S1):407-22. DOI |
| 28 | Abdo HG. Evaluating the potential soil erosion rate based on RUSLE model, GIS, and RS in Khawabi river basin, Tartous, Syria. DYSONA Appl. Sci. 2022;3(1):24-32. DOI |
Cite this article:
Okenmuo, F., Ewemoje, T. Estimation of soil water erosion using RUSLE, GIS, and remote sensing in Obibia River watershed, Anambra, Nigeria. DYSONA – Applied Science, 2023;4(1): 6-14. doi: 10.30493/das.2022.349144