Mirna Ahmad Shaddoud 1*; Romulus Costache 2,3,4; Ioannis Kotaridis 5; Mohammad Fereshtehpour 6; Alban Kuriqi 7
1, Geography Department, Faculty of Arts and Humanities, Tartous University, Tartous, Syria
2, National Institute of Hydrology and Water Management, București-Ploiești Road, 97E, 1st District, 013686, Bucharest, Romania
3, Danube Delta National Institute for Research and Development, Tulcea, Romania
4, Department of Civil Engineering, Transilvania University of Brasov, 5, Turnului Str, 500152, Brasov, Romania
5, Aristotle University of Thessaloniki, Faculty of Engineering, School of Civil Engineering, Lab. of Photogrammetry – Remote Sensing, 54124 Thessaloniki, Greece
6, Department of Civil Engineering, York University, Toronto, ON M3J 1P3, Canada
7, CERIS, Instituto Superior T’ecnico, University of Lisbon, 1649-004 Lisbon, Portugal
E-mail:
mirnashaddoud@tartous-univ.edu.sy
Received: 28/09/2024
Acceptance: 26/11/2024
Available Online: 28/11/2024
Published: 01/01/2025

Manuscript link
http://dx.doi.org/10.30493/DAS.2024.480819
Abstract
Flash flood hazard is one of the most frequent hydrological hazards in the Syrian coastal region. The Northern Kabir River Basin (NKRB) is among the most susceptible regions to flooding. Assessing the spatial distribution of flash flood risk presents a significant difficulty in the NKRB. The absence of regular hydrological measurement and common political boundaries are the main challenges to identifying the actual hazard locations in the NKRB. Morphometric analysis and spatial techniques combined with remote sensing data provide a comprehensive objective approach to mapping flash flood hazard. This research focused on determining the spatial distribution of flash flood hazard degree in 10 sub-basins of the NKRB. 16 morphometric parameters were calculated, including area (A), drainage density (Dd), stream frequency (Fs), texture ratio (T), shape index (ISh), circulatory ratio (Cr), stream order (U), stream number (Nu), stream length (Lu), mean bifurcation ratio (MRb), weighted mean bifurcation ratio (WMRb), length of overland flow (Lg), basin relief (BH), relief ratio (Rh), ruggedness Number (Rn) and slope index (SI). The flash flood hazard degree was determined according to the morphometric prioritization method in a geographic information system (GIS) environment. The hazard degree was classified into five categories: very high, high, moderate, low and very low. The results indicated that the sub-basins of SW2 and SW1 can be classified as very high and high-risk (49.15%) areas, the sub-basins of SW10, SW9, SW7, SW8 and SW4 are moderate risk (27.98%) areas, the sub-basins of SW3 and SW6 are low risk (15.84%) areas, and the areas of sub-basin SW5 are very low risk (7.03%) areas. The very high-risk sub-basins were concentrated in the upper parts of the study area. The high flood risk values in the upper basins are attributed to the high values of T, Lu, Nu, A, Cr, and ISh. Consequently, there is an immediate necessity to implement adaptive measures in the elevated regions of high and very high-risk sub-basins.
Keywords: Flash flood, Morphometric analysis, GIS, Remote sensing, Eastern Mediterranean, Syria
Introduction
Water is one of the most important natural resources and is the basis of the socio-economic development process [1]. Spatial and temporal variation in water availability creates a surplus of water in many landscape units, and a deficit in others. Water availability exerts a dual influence as it can be beneficial, characterized by adequate supply or effective water harvesting leading to excess, or detrimental, manifesting as dangers of flooding and flash floods [2].
Flood risk is one of the most devastating environmental, economic, and social natural disasters. The intensity of flood is influenced by many natural and human factors such as rainfall intensity and duration, land use, and hydrological response at the river basin scale [3]. Flash flood occurrences wreak havoc on infrastructure, individuals’ lives, and their overall well-being [2], especially in areas with poor natural hazard mitigation strategies and scarce relevant data [4]. Hydrological prioritization highlights the understanding of hydrological behavior or the degree of hydrological response and thus flood risk [5][6]. Hence, it is necessary to determine hydrological prioritization at the level of sub-river basins to achieve environmental, economic, and social sustainability [7][8].
Morphometric analysis reflects the mutual influence of landscape, topography, vegetation, climate, and hydrology characteristics through precise mathematical parameters [7][9]. This analysis utilizes basic, areal, hydrological, and topographic parameters to determine the hydrological response of the river basin [10][11]. Many investigators have used morphometric analysis to determine soil erosion risk [12], groundwater potential [13], potential runoff risk [14] and flash flood risk [15]. In this regard, morphometric analysis is one of the most widely used methods to determine hydrological prioritization at the sub-basin scale.
Numerous studies have utilized morphometric analysis to prioritize flash flood risk [16-18] and for assessing water accumulations [2][19]. Morphometric analysis combined with spatial approaches such as geographic information system (GIS) and remote sensing (RS) data provide precise and dependable outcomes that are cost-effective, efficient, and less time-intensive in evaluating flash flood risk [20-22].
The Northern Kabir River Basin (NKRB) is the largest basin in the mountainous western region of Syria, encompassing an area of 1079 km². Consequently, establishing the hydrological prioritization of this basin is crucial for conserving natural resources [22] and preventing natural disaster risks such as water erosion [23] and flash floods [20][21]. Moreover, flash flood hazard maps generated from morphometric analysis in this basin can aid decision-makers with managing the river at the sub-basin level [23][24]. Therefore, this study sought to ascertain the spatial distribution of flash flood hazard levels across 10 sub-basins of the NKRB by employing morphometric analysis and spatial techniques in conjunction with remote sensing data, thereby offering a thorough and objective methodology for mapping flash flood hazards in data-scarce areas of the Eastern Mediterranean.
Material and Methods
Study area
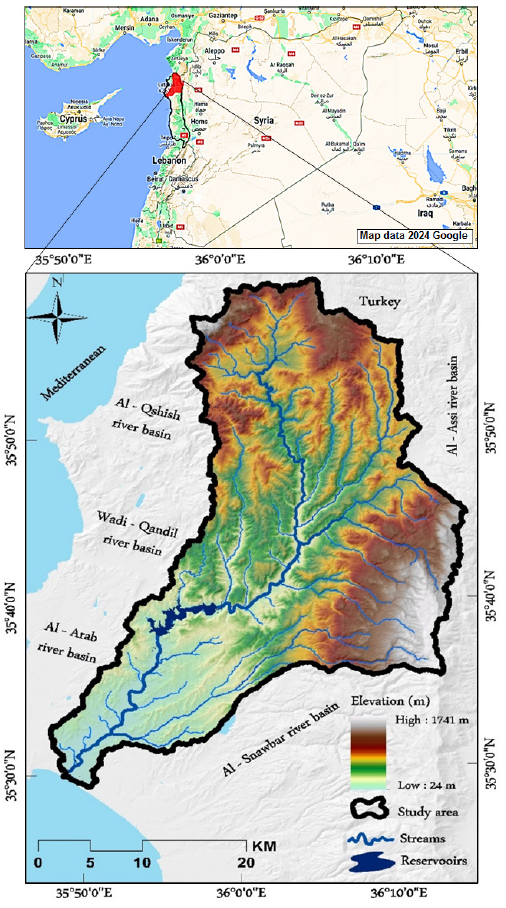
The NKRB extends between latitudes 35° 29′ 11′′, 35° 53′ 48′′ and longitudes 35° 48′ 14′′, 36° 15′ 7′′ (Fig. 1). The river network originates from the northwestern extremity of the Latakia Mountains, situated on the Turkish-Syrian border, referred to as the Ansari Mountains, and flows southward of the city of Latakia, 2 km from the village of Al-Bassa, into the Mediterranean Sea [25]. The study area is bordered to the north by Turkey, to the south by the Al-Snawbar River Basin, to the east by the Al-Assi River Basin, to the west by the Arab River Basin, the Al-Qashish River Basin, and the Wadi-Qandil River Basin. The elevation within the basin ranges from 24 m (flood plain) to 1771 m (Ansari Mountains), with slope degrees ranging from 0○ to 69.08○. The NKRB belongs to the Mediterranean climate, the average temperature is estimated to be 12° – 28°, and the annual rainfall is 550 – 1100 mm. The vegetation consists of forest cover and shrubs in the eastern section, and agricultural lands mainly constituted of citrus, olives, and other fruits orchards in the western section [26].
Derivation of river basin and sub-river basins
The digital elevation model (DEM) with a spatial resolution of 12.5 was obtained from Alaska Satellite Facility (ASF) – Distributed Active Archive Center (From Link) and utilized to ascertain flow direction and accumulation, hence identifying the primary basin and sub-basins based on concentration sites and stream order, as well as evaluating the basin’s slope gradient.
Application of morphometric indicators
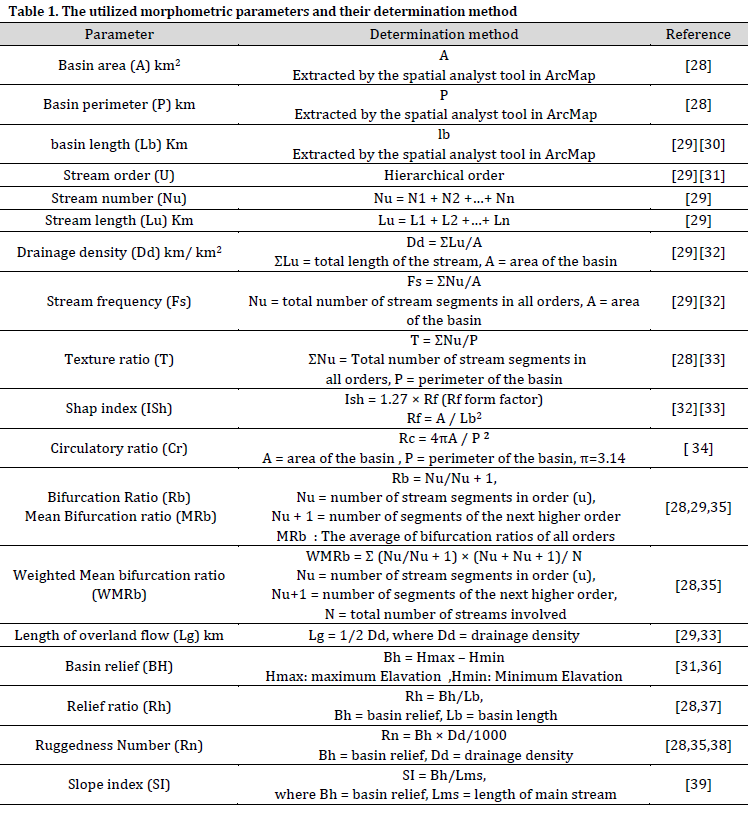
Morphometric parameters [28-39] were calculated in order to assess the degree of flash flood risk. Overall, 16 morphometric parameters were calculated (Table 1). The areal parameters, area (A), drainage density (Dd), stream frequency (Fs), texture ratio (T), shape index (ISh), and circulatory ratio (Cr) [28-34], were determined in the GIS environment. Also, linear parameters including stream order (U), stream number (Nu), stream length (Lu), mean bifurcation ratio (MRb), weighted mean bifurcation ratio (WMRb), and length of overland flow (Lg) [28][29][31][33][35] were also determined. Moreover, topographic parameters including basin relief (BH), relief ratio (Rh), ruggedness Number (Rn), and slope index (SI) [28][31][35-39] were determined.
Weighting of morphometric indicators
The Davis and John method [40] was adopted in giving weight to each parameter in the sub-river basins. The calculated morphometric parameters were utilized to determine the degree of flash flood hazard. Most of the morphometric indicators were positively correlated with the degree of hazard except for the mean bifurcation ratio (MRb), the weight of the mean bifurcation ratio (WRMb), and the length of the ground flow (Lg) which were inversely correlated with the degree of flash flood hazard. For the parameters with a positive correlation, the following equation was applied:

On the other hand, the following equation was applied for negatively correlated parameters

Where Y is the flash flood hazard degree, Ymax and Ymin are the upper and lower limits of the proposed scale of hazard degree, Xmax and Xmin are the highest and lowest values of any parameter, X is the estimated value of any parameter between the highest and lowest values. Then, the sub-basins are classified according to the estimated hazard degree by giving a final score from 1 to 5.
Flash flood hazard map
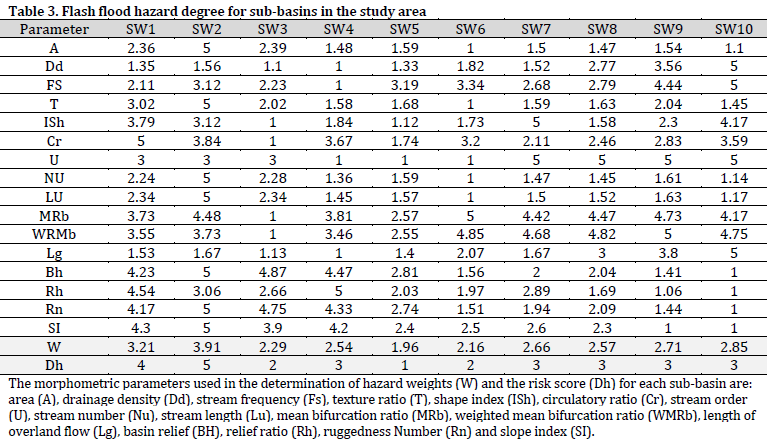
The hazard level is divided into five categories: Very low hazard, Low hazard, Moderate hazard, High hazard, Very high hazard according to their hazard weights from 1 to 5, respectively. The final weights (W) for each parameter were calculated, and the risk score (Dh) was determined as shown in Table 3. Based on these weights, a potential flash flood map was produced in a GIS environment.
Results and Discussion
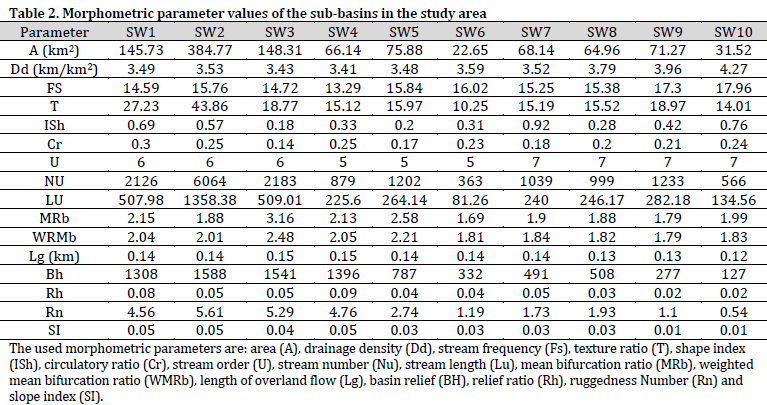
The NKRB was divided into 10 sub-basins (SB). The areal, linear and topographic morphometric parameters (Table 2) were analyzed according to the method of Davis and John [40].
Areal parameters
The total area of the NKRB is 1079.356 km2. The areas of the sub-basins ranged from 22.65 km2 in SW6 to 384.77 km2 in SW2 (Table 2). The results indicate that SW2 and SW3 and SW1 have a greater flash flood risk due to their larger area, while SW6 and SW10 have a lower risk (Table 3). In fact, a larger area means a higher hydrological response capacity [32], thus a greater potential of flash flood risk.
The values of the drainage density (Dd) ranged from 3.41 km/km2 in the SW4 to 4.27 km/km2 in the SW10 (Table 2). The drainage density (Dd) determines the interval between the amount of precipitation and discharge, thus the peak flow [41]. High values of Dd indicate high effective precipitation values, and low infiltration rate. Conversely, low values indicate the presence of dissected rock formations, high infiltration, and groundwater recharge [42]. Therefore, the high Dd values found in SW10, SW9 and SW8 reflect the higher risk of flash flood in these areas, while the low Dd values observed in SW4 and SW3 may indicate a lower risk compared to other areas (Table 3).
The Stream frequency (Fs) values within the river basin ranged from 13.29 in SW4 to 17.96 in SW10 as (Table 2). The Fs value reflects the influence of basin characteristics and precipitation patterns on stream formation [43]. High values indicate impermeable structures, while low values indicate the presence of silt deposits and high infiltration. Stream density, also, is positively related to discharge density [32]. High flash flood risk values are observed in SW10 and SW9, which basically have high discharge density, while the lowest risk is observed in SW4 and SW3 sub-basins (Table 3).
The values of the texture ratio (T) ranged from 10.25 in SW6 to 34.86 in SW2 (Table 2). Overall, the study area belongs to the soft texture, since the total area recorded a T value greater than 8 [44]. The soft texture in the entire basin reflects that the faults are still in their initial stage with the presence of close terrain and low vegetation cover [45]. In general, low values indicate low-slope plain areas [46][47]. According to the application of the weighting method, the SW2, SW1, and SW9 have a high flash flood risk, and the basins SW6 and SW10 have a lower flash flood risk (Table 3).
The shape index (ISh) values ranged from 0.18 in SW3 to 0.92 in SW7. High values (closer to circularity shape) indicate high flow for short duration, while low values indicate low peak flow for long duration [48]. The weighting results showed that SW7, SW10, SW1, and SW2 have a higher risk degree, while SW3 and SW5 sub-basins have a lower (Table 3).
The circularity ratio (Cr) values ranged from 0.14 in SW3 to 0.3 in SW1. High values indicate higher surface runoff and higher peak discharge values [49]. The weighting results showed that SW1, SW2, SW4, and SW10 have a higher flash flood risk degree compared to SW3 and SW5.
According to the areal parameters, SW2 and SW10 are the sub-basins with higher flash flood risk, followed by SW1. The most influential spatial parameters were the basin texture, area, and circularity parameters, respectively (Table 3). These findings can be attributed to the impermeable structures and larger slope degrees of these sub-basins. SW2 and SW1 have achieved significant advancement in geomorphological development, resulting in a markedly high hydrological response.
Linear parameters
The river network in the NKRB was classified as seventh, sixth, and fifth order (Fig. 2). The higher order is anticipated to produce a high peak of runoff during rainstorms, resulting in greater discharge [29][31] and an increased flash flood risk relative to lower orders.
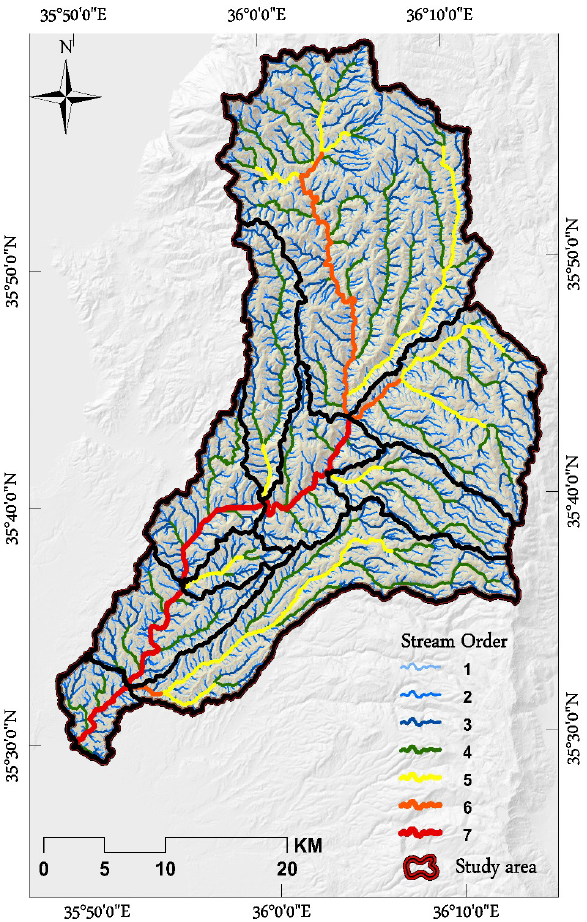
The basins with the highest stream order (U) were weighted as higher risk, i.e. SW10, SW9, SW8, and SW7, respectively, while the basins with the lowest risk are SW6, SW5, and SW4 (Table 3). The Stream number (Nu) varied from 363 channels with a length of 81.26 km in the SW6 to 6064 channels with a length of 1358.38 km in the SW2 (Table 2). Stream number (Nu) and their length (Lu) reflect the hydrological response of the river basin [29][31]. The results of applying the weighting index showed that SW1, SW3, and SW2 have a higher risk degree, while SW6 and SW10 have a lower risk degree (Table 3).
The values of the mean bifurcation ratio (MRb) ranged from 1.69 in SW3 to 3.16 in SW6, while the values of the weight of the bifurcation ratio (WRMb) ranged from 1.79 in SW3 to 2.48 in SW9 (Table 2). There is an inverse correlation between the mean bifurcation ratios and their weight with the flash flood risk [40]. Elevated values in the preceding two indicators signify minimal surface runoff, considerable roughness, and substantial elongation. Lower values generate a higher flash flood peak and exhibit greater circularity [50] resulting in an increased weight. According to the mean bifurcation ratio (MRb) the sub-basins with high flash flood risk are SW6, SW9, SW2 and SW8. Similarly, according to the weight of the mean bifurcation ratio (WMRb), the most dangerous basins are SW9, SW6, and SW8. On the other hand, the basins with the lowest danger are SW3 and SW5 according to both parameters (Table 3).
The Lg values ranged from 0.12 in SW4 to 0.15 in SW10 (Table 2). There is an inverse relationship between Lg values and flash flood risk. Low Lg values indicate a low slope with a longer flow path, and thus highlight an area more prone to flash floods [19][40]. The Lg weighting results showed that the basins with the highest risk score are SW10, SW9, and SW8, and the lowest are SW4 and SW3.
According to the linear morphometric indicators, the most vulnerable sub-basins are SW2 and SW10 followed by SW9 and SW6. The most influential linear indicators on flash flood risk are the Nu and Lg, followed by the MRb and U (Table 3). The significant basin area and steep slopes of sub-basin SW2 result in the largest hydrological response, particularly due to the predominance of topographic precipitation, whereas SW10 features impermeable geological formations facilitate prolonged flow distances.
Topographic parameters
The values of the Bh ranged from 127 in SW10 to 1588 in SW2 (Table 2). Higher Bh values indicate an increased risk of erosion with higher runoff volume and peak flow [51]. Accordingly, the upper sub-basins (SW2, SW3, SW4, and SW1) were classified at higher risk, while the lower basins, SW10, SW9 recorded lower flash flood risk.
The values of the Rh range from 0.02 in SW10 to 0.09 in SW4 (Table 2). High Rh values indicate a short concentration time and a fast peak flow and vice versa [52]. The results showed that SW4, SW1, and SW2 have the highest flash flood risk degree, while the lowest risks are observed in SW10 and SW9 (Table 3). The values of Rn range from 0.54 in SW10 to 5.61 in the SW2 (Table 2). High values indicate high runoff peak during rainstorms. Thus, there is a positive correlation between the Rn and the degree of flash flood risk [50]. The risk increases on bare slopes where morphodynamic processes accelerate [53]. The weighting results show that the sub-basins with higher flash flood risk are SW2, SW3, and SW4, and the lowest are SW10, SW9, respectively.
The SI index reflects the integration between the relief and the length of the main channel [39]. The values of SI index ranged from 0.01 in SW9 and SW10 to 0.05 in SW2, as shown in Table (2). High values indicate a higher flow volume, and a high peak in the maximum runoff hydrograph [54]. Therefore, an increased SI value, similar to that observed in the SW2, SW1, and SW4, indicate a high potential flash flood risk, while SW10 and SW9 were classified in a lower risk degree due to their low SI values (Table 3).
According to the topographic parameters, it was found that the upper basins were the areas with higher flash flood risk. The parameters with higher influence on the flash flood risk was the SI index, followed by Rn index and the Bh index. This can be explained by the fact that the higher areas have higher slopes and receive higher amounts of rainfall. Thus, the SW2, SW1, and SW4 were more hazardous according to the topographic parameters.
Prioritization of sub-basins
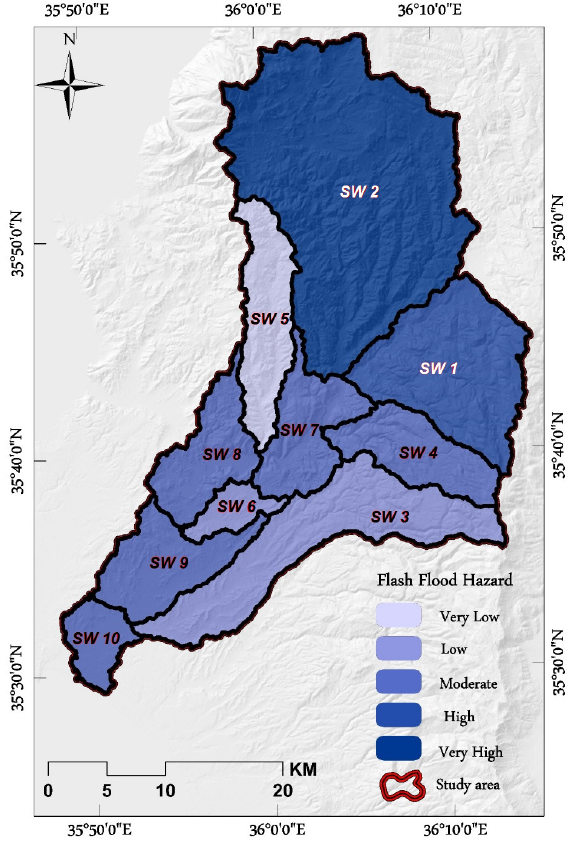
The morphometric weight method was used to determine the degree of flash flood risk in the NKRB (Table 3). The degree of risk was classified based on the 16 parameters in each sub-basin into five categories: very high, high, moderate, low and very low (Table 3) (Fig. 3). The results showed that SW2 is the basin most susceptible to flash flood risk, followed by SW1, while SW5 is the sub-basin with the lowest susceptibility to flash floods. SW10, SW9, SW7, SW8 and SW4 recorded moderate risk values, while SW3 and SW6 recorded low risk. Areas classified as very high risk comprised 35.65% of the total area, high risk accounted for 13.50%, and moderate risk represented 27.98%. Low-risk zones comprise 15.84%, while extremely low-risk areas account for 7.03%. Consequently, the areas with high and very high flash flood risk susceptibility represented 49.15% of the total area, which highlights the importance of applying effective flood management measures in these areas.
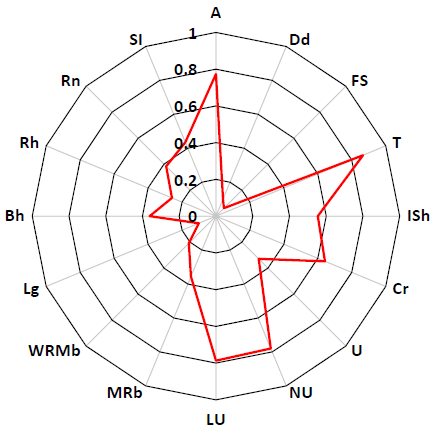
The influence degree of each parameter on the risk score was calculated using Pearson’s correlation coefficient (Fig. 4). Pearson’s correlation coefficient was calculated between the W value calculated according to the Davis and John [40] method for each parameter, and the final Dh. Correlation analysis showed that T parameter was the most influential parameter on the flash flood risk with a direct correlation coefficient of 0.866, while Lu, Nu, and A showed a strong direct correlation (>0.7), followed by the Cr and ISh. The lowest influential parameters were the Fs, Dd and Lg. The upper sub-basins are more susceptible to flash flood risk, which is similar to previous reports [2][19][27]. Also, the average flash flood risk for the lower basins is similar to that reported previously in another study [55].
Conclusion
Flash floods pose significant hydrological risks that can severely impact ecosystems and communities. This study employed morphometric analysis using advanced spatial technologies to objectively assess the degree of flash flood risk in the Northern Kabir River Basin (NKRB), focusing on 10 sub-basins. The analysis incorporated 16 key morphometric parameters from four main categories such as basin shape and morphology, drainage and stream network characteristics, relief and terrain ruggedness, and flow and runoff potential. These indicators were assigned weights across five risk categories to create a comprehensive flood risk map. Pearson’s correlation analysis revealed that the Texture Ratio (T) had the highest influence on flood risk, with a strong direct correlation of 0.866, followed by Stream Length (Lu), Stream Number (Nu), and Area (A). The least influential parameters were Stream Frequency (Fs), Drainage Density (Dd), and Length of Overland Flow (Lg). The results classified the study area into zones of very high, high, moderate, low, and very low flood risk. Notably, the upper portions of the basin, specifically sub-watersheds SW1 and SW2, exhibited the highest levels of risk. The generated flood risk map provides a valuable tool for identifying areas most susceptible to flash flooding. Additionally, it can support sustainable land-use planning, disaster preparedness, and mitigation strategies aimed at minimizing the impacts of flash floods on vulnerable ecosystems and human settlements. This study underscores the importance of integrating morphometric analysis with GIS technologies for effective hydrological risk assessment.
References
- Bal M, Dandpat AK, Naik B. Hydrological modeling with respect to impact of land-use and land-cover change on the runoff dynamics in Budhabalanga river basing using ArcGIS and SWAT model. Remote Sens. Appl. Soc. Environ. 2021;23:100527. DOI
- Abdelkader MM, Al-Amoud AI, El Alfy M, El-Feky A, Saber M. Assessment of flash flood hazard based on morphometric aspects and rainfall-runoff modeling in Wadi Nisah, central Saudi Arabia. Remote Sens. Appl. Soc. Environ. 2021;23:100562. DOI
- Al Kuisi M, Al Azzam N, Hyarat T, Farhan I. Flood Hazard and Risk Assessment of Flash Floods for Petra Catchment Area Using Hydrological and Analytical Hierarchy (AHP) Modeling. Water. 2024;16(16):2283. DOI
- Navarro O, Restrepo-Ochoa D, Muñoz-Duque LA, Zapa-Perez K, Ameline A, Mercier D, Fleury-Bahi G. Determinants of coping strategies in two types of natural hazards: Flash floods and costal flooding. Int. J. Disaster Risk Reduct. 2020;46:101514. DOI
- Dimple D, Rajput J, Al-Ansari N, Elbeltagi A, Zerouali B, Santos CAG. Determining the Hydrological Behaviour of Catchment Based on Quantitative Morphometric Analysis in the Hard Rock Area of Nand Samand Catchment, Rajasthan, India. Hydrology. 2022;9(2):31. DOI
- Khiavi AN, Vafakhah M, Sadeghi SH. Comparative prioritization of sub-watersheds based on Flood Generation potential using physical, hydrological and co-managerial approaches. Water Resour. Manag. 2022;36(6):1897–917. DOI
- Najia F, Bouchta EF, Mohamed M, Brahim B. Evaluation of morphometric parameters and prioritization of the Oued Joumouaa watershed. Ecol. Environ. Conserv. 2021;27:S403-19.
- Sajadi P, Singh A, Mukherjee S, Sang YF, Chapi K, Salari M. Drainage network extraction and morphometric analysis in an Iranian basin using integrating factor analysis and geospatial techniques. Geocarto Int. 2020;37(3):896–925. DOI
- Khare D. Morphometric Analysis for Prioritization using Remote Sensing and GIS Techniques in a Hilly Catchment in the State of Uttarakhand, India. Indian J. Sci. Technol. 2014;7(10):1650–62. DOI
- Mahala A. The significance of morphometric analysis to understand the hydrological and morphological characteristics in two different morpho-climatic settings. Appl. Water Sci. 2019;10(1). DOI
- López-Ramos A, Medrano-Barboza JP, Martínez-Acosta L, Acuña GJ, Remolina López JF, López-Lambraño AA. Assessment of Morphometric Parameters as the Basis for Hydrological Inferences in Water Resource Management: A Case Study from the Sinú River Basin in Colombia. ISPRS Int. J. Geo-Inf. 2022;11(9):459. DOI
- Singh WR, Barman S, Tirkey G. Morphometric analysis and watershed prioritization in relation to soil erosion in Dudhnai Watershed. Appl. Water Sci. 2021;11(9). DOI
- Choudhari PP, Nigam GK, Singh SK, Thakur S. Morphometric based prioritization of watershed for groundwater potential of Mula river basin, Maharashtra, India. Geol. Ecol. Landsc. 2018;2(4):256–67. DOI
- Shaikh M, Yadav S, Manekar V. Application of the Compound Factor for Runoff Potential in Sub-watersheds Prioritisation Based on Quantitative Morphometric Analysis. J. Geol. Soc. India. 2022;98(5):687–95. DOI
- Mansour MM, Ibrahim MG, Fujii M, Nasr M. Sustainable development goals (SDGs) associated with flash flood hazard mapping and management measures through morphometric evaluation. Geocarto Int. 2022;37(26):11116–33. DOI
- Dutal H. Using morphometric analysis for assessment of flash flood susceptibility in the Mediterranean region of Turkey. Environ. Monit. Assess. 2023;195(5). DOI
- Aziz MA, Hagras A. Flash flood hazard assessment in the Amlog Valley Basin, North-West Galala City, Egypt, based on a morphometric approach. Appl. Geomatics. 2023;16(1):111–24. DOI
- Taib H, Hadji R, Bedri K, Defaflia N, Hamed Y, Gentilucci M, Barbieri M, Pambianchi G. Morphometric analysis and risk assessment of flash floods in the Atlas chain of eastern Algeria and the Algerian–Tunisian borders. Euro-Mediterr. J. Environ. Integr. 2024:1-5. DOI
- Musaed H, El-Kenawy A, El Alfy M. Morphometric, Meteorological, and Hydrologic Characteristics Integration for Rainwater Harvesting Potential Assessment in Southeast Beni Suef (Egypt). Sustainability. 2022;14(21):14183. DOI
- Taha MMN, Elbarbary SM, Naguib DM, El-Shamy IZ. Flash flood hazard zonation based on basin morphometry using remote sensing and GIS techniques: A case study of Wadi Qena basin, Eastern Desert, Egypt. Remote Sens. Appl. Soc. Environ. 2017;8:157–67. DOI
- Nasir MJ, Iqbal J, Ahmad W. Flash flood risk modeling of swat river sub-watershed: a comparative analysis of morphometric ranking approach and El-Shamy approach. Arab. J. Geosci. 2020;13(20). DOI
- Chowdhury MdS. Morphometric analysis of Halda River basin, Bangladesh, using GIS and remote sensing techniques. Heliyon. 2024;10(7):e29085. DOI
- Abdelgawad AG, Helal E, Sobeih MF, Elsayed H. Flood hazard mapping using a GIS-based morphometric analysis approach in arid regions, a case study in the Red Sea Region, Egypt. Appl. Water Sci. 2024;14(4). DOI
- Marwade A, Patil A, Panhalkar S. Mapping and Prioritizing Flash-Flood Susceptible Watersheds in the Warana Basin, India: A Morphometric Analysis and Total Ranking Approach for Resilience Planning. J. Geomatics. 2024;18(1):1–11. DOI
- Almohamad H. Impact of Land Cover Change Due to Armed Conflicts on Soil Erosion in the Basin of the Northern Al-Kabeer River in Syria Using the RUSLE Model. Water. 2020;12(12):3323. DOI
- Barakat M, Mahfoud I, Kwyes AA. Study of soil erosion risk in the basin of Northern Al-Kabeer river at Lattakia-Syria using remote sensing and GIS techniques. Mesopotam. J. Mar. Sci. 2022;29(1):29–44. DOI
- Abdo HG, Almohamad H, Al Dughairi AA, Karuppannan S. Sub-basins prioritization based on morphometric analysis and geographic information systems: a case study of the Barada river basin, Damascus countryside governorate, Syria. Proc. Indian Natl. Sci. Acad. 2023;89(2):376–85. DOI
- Schumm SA. Evolution of drainage systems and slopes in badlands at Perth Amboy, New Jersey. Geol. Soc. Am. Bull. 1956;67(5):597. DOI
- Horton RE. Erosional development of streams and their drainage basins; hydrophysical approach to quantitative morphology. Geol. Soc. Am. Bull. 1945;56(3):275. DOI
- Gregory KJ, Walling DE. Drainage basin form and process: a geomorphological approach. Geografisk Tidsskrift, Bind 74. 1975.
- Quantitative analysis of watershed geomorphology. Eos Trans. Am. Geophys. Union. 1957;38(6):913–20. DOI
- Drainage‐basin characteristics. Eos Trans. Am. Geophys. Union. 1932;13(1):350–61. DOI
- Strahler AN. Revisions of Horton’s quantitative factors in erosional terrain. Eos Trans. Am. Geophys. Union. 1953;34:345.
- Potter PE. A Quantitative Geomorphic Study of Drainage Basin Characteristics in the Clinch Mountain Area, Virginia and Tennessee. V. C. Miller. J. Geol. 1957;65(1):112–3. DOI
- Strahler AN. Quantitative geomorphology of drainage basin and channel networks. Handbook of applied hydrology. 1964.
- Strahler AN. Dynamic basis of geomorphology. Geol. Soc. Am. Bull. 1952;63(9):923. DOI
- Schumm SA. Sinuosity of Alluvial Rivers on the Great Plains. Geol. Soc. Am. Bull. 1963;74(9):1089. DOI
- Unit‐hydrograph lag and peak flow related to basin characteristics. Eos Trans. Am. Geophys. Union. 1952;33(2):235–46. DOI
- Melton MA. An analysis of the relations among elements of climate, surface properties, and geomorphology. Defense Technical Information Center. 1957. DOI
- Davis JC, Sampson RJ. Statistics and data analysis in geology. New York: Wiley. 1986.
- Alqahtani F, Qaddah AA. GIS digital mapping of flood hazard in Jeddah–Makkah region from morphometric analysis. Arab. J. Geosci. 2019;12(6). DOI
- Bassey Eze E, Efiong J. Morphometric Parameters of the Calabar River Basin: Implication for Hydrologic Processes. J. Geogr. Geol. 2010;2(1). DOI
- Patel DP, Dholakia MB, Naresh N, Srivastava PK. Water Harvesting Structure Positioning by Using Geo-Visualization Concept and Prioritization of Mini-Watersheds Through Morphometric Analysis in the Lower Tapi Basin. J. Indian Soc. Remote Sens. 2011;40(2):299–312. DOI
- Smith KG. Standards for grading texture of erosional topography. Am. J. Sci. 1950;248(9):655–68. DOI
- Pallard B, Castellarin A, Montanari A. A look at the links between drainage density and flood statistics. Hydrol. Earth Syst. Sci. 2009;13(7):1019–29. DOI
- Pareta K, Pareta U. Quantitative morphometric analysis of a watershed of Yamuna basin, India using ASTER (DEM) data and GIS. Int. J. Geomatics Geosci. 2011;2(1):248-69.
- Gajbhiye S, Mishra SK, Pandey A. Prioritizing erosion-prone area through morphometric analysis: an RS and GIS perspective. Appl. Water Sci. 2013;4(1):51–61. DOI
- Umak DK, Punwatkar VL, Parashar VK. Morphometric analysis and prioritization of sub-watersheds of Barna watersheds, Raisen District, Madhya Pradesh, India using remote Sensing and GIS Techniques. Int. J. Sci. Technol. Eng. 2017;4(1):99-106.
- Geospatial IA. Drainage Morphometry of Flood Prone Rangat Watershed, Middle Andaman, India-A Geospatial Approach.. Int. J. Innov. Technol. Explor. Eng, 2014;3(11):15-22.
- Abdelkareem M. Targeting flash flood potential areas using remotely sensed data and GIS techniques. Nat. Hazards. 2016;85(1):19–37. DOI
- Bhat MS, Alam A, Ahmad S, Farooq H, Ahmad B. Flood hazard assessment of upper Jhelum basin using morphometric parameters. Environ. Earth Sci. 2019;78(2). DOI
- Bhatt S, Ahmed SA. Morphometric analysis to determine floods in the Upper Krishna basin using Cartosat DEM. Geocarto Int. 2014;29(8):878–94. DOI
- Masoud MH. Geoinformatics application for assessing the morphometric characteristics’ effect on hydrological response at watershed (case study of Wadi Qanunah, Saudi Arabia). Arab. J. Geosci. 2016;9(4). DOI
- Kaliraj S, Chandrasekar N, Magesh NS. Morphometric analysis of the River Thamirabarani sub-basin in Kanyakumari District, South west coast of Tamil Nadu, India, using remote sensing and GIS. Environ. Earth Sci. 2014;73(11):7375–401. DOI
- Abdo HG. Evolving a total-evaluation map of flash flood hazard for hydro-prioritization based on geohydromorphometric parameters and GIS–RS manner in Al-Hussain river basin, Tartous, Syria. Nat. Hazards. 2020;104(1):681–703. DOI
Cite this article:
Shaddoud, M., Costache, R., Kotaridis, I., Fereshtehpour, M., Kuriqi, A. Flash flood prioritization assessment using morphometric analysis in the coastal region of the Eastern Mediterranean. DYSONA – Applied Science, 2025;6(1): 172-185. doi: 10.30493/das.2024.480819

