Farzaneh Dadrass Javan 1; Farhad Samadzadegan 2; Ahmad Toosi 2*; Hamed Tousikordkolaei 3
1, Faculty of Geo-Information Science and Earth Observation (ITC), University of Twente, Enschede, Netherlands
2, School of Surveying and Geospatial Engineering, University College of Engineering, University of Tehran, Tehran, Iran
3, Department of Computer Engineering, Faculty of Technical Engineering and Basic science, Islamic Azad University Sari Branch, Sari, Iran
E-mail:
ahmadtoosi71@ut.ac.ir
Received: 08/11/2024
Acceptance: 06/01/2025
Available Online: 07/01/2025
Published: 01/07/2025

Manuscript link
http://dx.doi.org/10.30493/DAS.2025.486806
Abstract
The Lake Urmia Basin (LUB) in Iran has been experiencing significant drought conditions with severe impacts on its agricultural sector. This study analyzed the spatiotemporal patterns of agricultural drought across the LUB during growing seasons from 2000 to 2019. The analysis integrated multiple drought indices including the Vegetation Condition Index (VCI), Thermal Condition Index (TCI), Vegetation Health Index (VHI), Composite Index (CI), Precipitation Condition Index (PCI), and Rainfall Anomaly Index (RAI). These indices were derived from 8,279 satellite images combining MODIS, TRMM, and GridSat-B1 data processed in Google Earth Engine. The study’s primary innovation lies in developing a real-time algorithm for mapping spatial patterns and calculating temporal trends of agricultural drought through time-series analysis of drought indices in a cloud-based environment. For validation purposes, Standardized Precipitation Index (SPI) values at 3-, 6-, and 9-month intervals were calculated using precipitation data from seven synoptic stations. Positive Pearson correlations were observed between VCI and all SPI intervals across stations, with most stations showing significant correlations (R=0.35). VCI analysis revealed that while most of the LUB remained unaffected by drought, the remaining areas experienced mild, moderate, severe, and extreme drought conditions in descending order of extent. The maximum and minimum extents of extreme and severe drought were observed during 2000-2018, while moderate and mild drought peaks occurred during 2000-2002 and 2002-2018, respectively. Analysis of Variance (ANOVA) with Duncan Post Hoc testing demonstrated significant differences among indices, though VHI and CI showed no significant distinction from each other. The PERSIANN-CDR-derived RAI identified five major drought events between 2000 and 2019, showing a correlation of R=0.576 with the mean RAI from the seven stations. Temporal trend analysis using Ordinary Least Squares (OLS) regression revealed that 73.3% and 20% of the LUB experienced wet and drying trends, respectively, with 22.2% showing significant wet trends and 1.7% showing significant drying trends.
Keywords: Agricultural drought, Remote sensing, Standardized precipitation index, Vegetation condition index, Lake Urmia
Introduction
Drought is a condition characterized by a significant lack of precipitation throughout a broad region, resulting in severe challenges for agriculture, ecosystems, natural resources, food and water supplies, economic stability, and human health, potentially leading to fatalities [1-7]. The planet is progressively warming, leading to several severe drought incidents in recent years that have adversely impacted ecosystems and significantly contributed to vegetation degradation [3]. Drought can be classified into agricultural, meteorological (or climatological), hydrological, and socio-economic categories [2][5]. Agricultural drought refers to a condition in which soil moisture is insufficient for plant growth, thereby adversely impacting agricultural profitability [8]. Agricultural drought is critically significant to the economies of agrarian nations [9]. Consistent and efficient agricultural drought monitoring is essential for productivity in the agricultural industry, as early warnings can significantly mitigate damage [4]. Furthermore, it affords policymakers the opportunity to implement timely measures about this natural event, so ensuring that the financial budget is allocated judiciously. In contrast to traditional methods, remote sensing (RS) serves as an effective instrument in Earth observation and natural resource management. A range of RS-based climate drought indices has been suggested, developed, and utilized for drought monitoring purposes [10].
The fact sheet from the Food and Agriculture Organization (FAO) indicates that the agricultural industry serves as a livelihood for over 15 million individuals in rural Iran [11]. Iran is situated in an arid and semi-arid region of the Middle East, characterized by diverse weather conditions [10]. The northwestern regions have cold weather, the northern and southern sectors have a humid climate, while the southeast and center regions are characterized by broad semi-arid and dry zones. Agriculture is thriving in the northern, north-western, and south-western regions due to advantageous climatic conditions. In developing countries such as Iran, which seeks to substitute oil exports with non-oil exports, the economic condition is heavily reliant on agriculture. Consequently, policymakers must employ contemporary technologies to safeguard agriculture from threats such as drought, flooding, and pests.
Numerous research initiatives have been undertaken in the domain of remote sensing-based drought monitoring since the inception of this technology. Certain studies concentrated on examining the effects of drought on agriculture. Dutta et al. [9] evaluated agricultural dryness in Rajasthan, India, by assessing the Vegetation Condition Index (VCI) and subsequently confirmed the findings using indices generated from synoptic stations. Kundu et al. [12] employed the ground-based precipitation index to identify rainfall deficiencies and subsequently tracked agricultural drought via remote sensing-based indicators. Vaani and Porchelvan [13] assessed agricultural drought in India over a 20-year period using VCI, demonstrating that their research area is undergoing moderate drought (MoD) to severe drought (SD) conditions over this timeframe. Zagade et al. [14] conducted a remote sensing-based evaluation of agricultural droughts in an Indian watershed from 2000 to 2017, identifying the transition from moderate drought (MD) to severe drought (ED) conditions prevalent in the majority of their research region. Yoon et al. [15] studied agricultural drought in East Asia by using satellite-derived indicators, specifically assessing the efficacy of the evaporative stress index in identifying drought occurrences in South Korea. This index had a more pronounced response to the drought than other indexes. A cohort of academics performed trend analysis in their study. Güner Bacanli [16] examined precipitation and drought trends in a Turkish case study utilizing the SPI index and Sen technique, mapping drought severity across several time scales. Han et al. [17] examined the trajectory of drought in their case study utilizing several remote sensing-based indices and slope analysis, corroborating the findings with ground truth precipitation data. Okal et al. [18] assessed the spatio-temporal patterns of droughts in a Kenyan study region utilizing remote sensing-based indices, precipitation data, the Standardized Precipitation Index (SPI), and the Standardized Precipitation Evapotranspiration Index (SPEI).
In Iran, numerous studies have been conducted on both national and regional levels, akin to research undertaken worldwide. Shamsipour et al. [19] examined drought occurrences in a section of Iran’s central plains utilizing satellite-derived data and the Standardized Precipitation Index (SPI). Zarei et al. [10] assessed meteorological drought across Iran from 2000 to 2005 utilizing NOAA-AVHRR-derived drought indices and synoptic data. Damavandi et al. [1] assessed the agricultural drought in Markazi province from 2000 to 2014 by the analysis of time series obtained from satellite imagery. Tavazohi and Ahmadi [20] evaluated the drought in the Zayandeh Roud river basin from 2000 to 2015 utilizing the Standardized Precipitation Index (SPI) and various remote sensing-based indices. Heydari et al. [21] examined drought prediction utilizing various remote sensing-based vegetation indices over different temporal intervals. They utilized AVHRR pictures to derive prevalent remote sensing indices from 1985 to 2008 and employed the Standardized Precipitation Index (SPI) to assess both short- and long-term drought conditions in Iran. Behrang Manesh et al. [3] examined the correlation between meteorological and agricultural drought across several climates in Iran utilizing satellite and ground-based data through slope analysis. Pourkhosravani et al. [22] analyzed drought conditions in the Khatun Abad basin from 2000 to 2017 utilizing ground truth precipitation and remote sensing data. Karimi et al. [23] employed remote sensing imagery to evaluate the efficacy of vegetation indices in relation to agricultural drought within the Karkheh basin. Given the significance of Lake Urmia (LU) to Iran’s agricultural sector and economy [24], and the recent drought affecting the Lake Urmia Basin (LUB) [25], numerous researchers have undertaken studies in this area. Bajgiran et al. [26] assessed drought in northwest Iran utilizing AVHRR-derived vegetation indices and found that the Vegetation Condition Index (VCI) had a stronger statistical association with the ground truth Standardized Precipitation Index (SPI), hence it was employed for drought assessment. The research by AghaKouchak et al. [27] indicated that the extent of LU has diminished by around 88% during recent decades. Rezaei Banafsheh et al. [28] conducted research on a portion of the LUB from 2000 to 2011, demonstrating that VCI is the most effective metric for assessing drought in their case study. Zynali et al. [29] employed the standardized evapotranspiration and precipitation index (SEPI) and adaptive neuro-fuzzy inference system (ANFIS) models to assess and predict drought conditions in the LUB. They disclosed that SEPI is more comprehensive than SPI. Sobhani et al. [30] utilized SEPI to assess drought in the LUB, concluding that the highest incidence rate of drought was recorded at a rain gauge in the southern region of the LUB over a three-month period, while the lowest rate was noted near the southwestern area of the LU. Kazempour Choursi et al. [24] assessed the drought conditions of the LUB during the growing months from 2000 to 2014, utilizing various satellite-based indices and the Standardized Precipitation Index (SPI) across multiple temporal scales, revealing that each index exhibited optimal performance during specified months of the year.
The aforementioned literature regarding the drought in Iran can be classified into two categories according to the scope of the study area. The initial group evaluated the drought on a nationwide basis, hence the specifics of drought conditions in localized regions (such as the LUB) remain ambiguous. The second group assessed the drought in Iran at a granular level, including drought monitoring in the Karkhe basin [23], Marivan county [31], southern Iran [32], Isfahan rangelands [33], Isfahan province [34], among others. The research on the LUB does not encompass recent years. Furthermore, no research has examined the long-term trend of agricultural drought conditions in the LUB. Moreover, in many instances, the research must concentrate exclusively on agricultural drought, excluding other forms or dimensions of drought. Despite the aforementioned significant research, the current severe drought conditions necessitate a more contemporary investigation of the LUB to accurately assess the spatiotemporal patterns of agricultural dryness in this region. This research aims to identify and monitor the spatiotemporal behavior, specifically the spatial extent and temporal trend of long-term agricultural drought in the LUB during the 21st century (2000-2019), utilizing geospatial techniques and time series analysis of Moderate Resolution Imaging Spectroradiometer (MODIS)-derived indices, along with satellite- and ground-based precipitation indices at the regional scale.
Materials and Methods
Study area
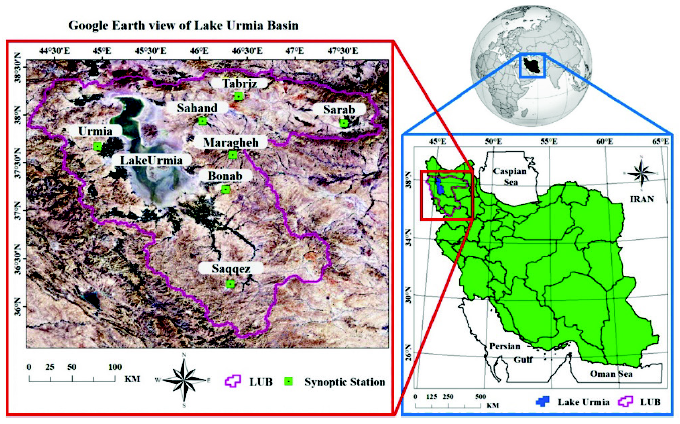
Lake Urmia Basin (LUB), with an average area of 51,801 km2, is located in the north-western part of Iran, between 35° 40’ and 38° 30’ North latitude and between 44° 12’ and 47° 54’ East longitude (Fig. 1), and has a cold semi-arid climate [26]. It is situated within three provinces (Kurdistan, East Azerbaijan, and West Azerbaijan) and contains the second biggest lake in Iran (Lake Urmia). The average annual precipitation of the LUB varies between 200 and 990 mm with a mean annual temperature between 7.5 and 15 °C. Seven in-situ synoptic meteorological stations (Bonab, Maragheh, Sahand, Saqqez, Sarab, Tabriz, and Urmia) scattered across the LUB were considered for this study (Fig. 1) (Table 1).

Datasets and indices
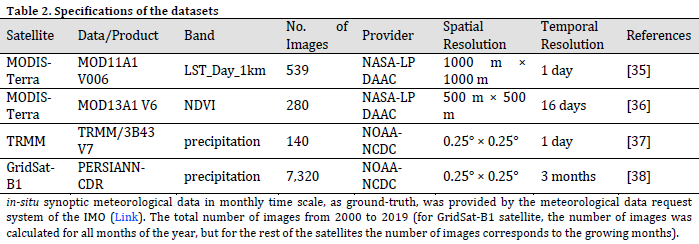
Images were acquired from Moderate Resolution Imaging Spectroradiometer (MODIS) satellite, Tropical Rainfall Measuring Mission (TRMM) satellite, and the Precipitation Estimation from Remotely Sensed Information Using Artificial Neural Networks-Climate Data Record (PERSIANN-CDR) product (Table 2). The images were used to obtain various vegetation, drought, and precipitation indices. Furthermore, the ground-based precipitation data was supplied by the Iran Meteorological Organization (IMO).
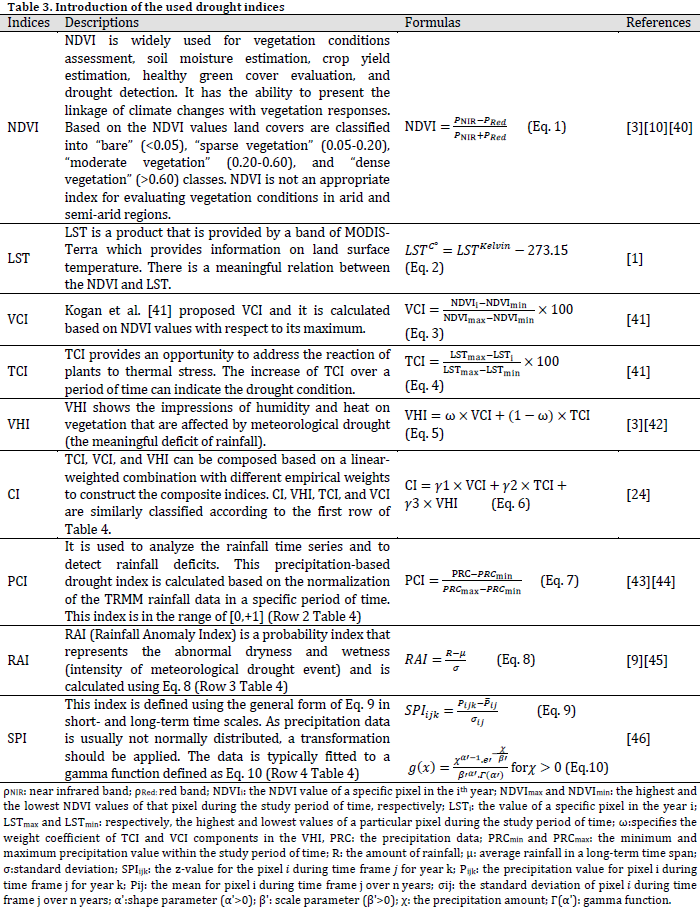
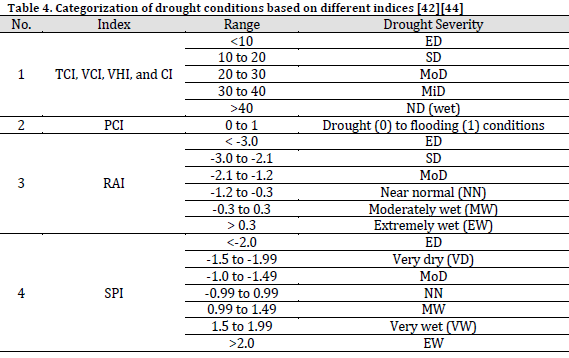
It is noteworthy that all of the used indices are known as state-of-the-art and widely used indices [17][39] so they are selected to be used in this research. Some of the RS-based products are used for the drought evaluation, while the ground-based indices are considered as ground-truth data to validate the performance of the former indices (Table 3).
Methodology
In this study, a paradigm is utilized to monitor the spatio-temporal behavior of any probable drought conditions over the LUB study area (Fig. 2). Firstly, the rainfall anomaly condition of LUB was analyzed using the RAI obtained from the time series of PERSIANN-CDR precipitation data and the precipitation data collected from seven in-situ synoptic meteorological stations from 2000 to 2019. Then, state-of-the-art RS-based drought indices including Vegetation Condition Index (VCI), Thermal Condition Index (TCI), Vegetation Health Index (VHI), Composite Index (CI), and Precipitation Condition Index (PCI) were calculated using the Google Earth Engine (GEE) platform which are applied for monitoring the spatial extent and pattern of agricultural drought in the study area for the years 2000 to 2019. Afterward, the ground-based synoptic station-derived SPI on a three-month, six-month, and nine-month time scale (characterized by SPI-3, SPI-6, and SPI-9, respectively) were utilized for validation of the obtained results. In this regard, a Pearson bivariate correlation test was used to discover which RS-based index has the maximum positive and significant correlation with the meteorological station-derived SPI. In the Pearson test, the Pearson Correlation Coefficient (PCC) and the Correlation of Determination (CoD) are defined as Eq. 11 and Eq. 12, respectively.

Where R and R2 refer to PCC and CoD, respectively. IR and IG stand for the RS-based and ground-based drought indices, respectively. Furthermore, IRA and IGA define the average values of IR and IG within all the index values (N), respectively.
By knowing the optimum index, the spatial extent of drought is extracted using the high-correlated RS-based index, and the area, as well as the relevant percentage of each severity class, were calculated and analyzed. Although the ground-based drought indices have relatively more precise performance in drought evaluation compared to the RS-based procedure, they are limited only to the meteorological stations and surrounding area, and do not cover all over the study area (LUB). Therefore, it is preferable to conduct the research using the RS-based method and validate its performance using the ground truth data. This ensures that all the study area is monitored and that the accuracy has been checked with ground truth. Furthermore, after mapping the spatial pattern of drought conditions, the Analysis of Variance (ANOVA) was conducted on the values of different indices between 2000-2019 to discover any significant differences between the performance of RS-based indices.
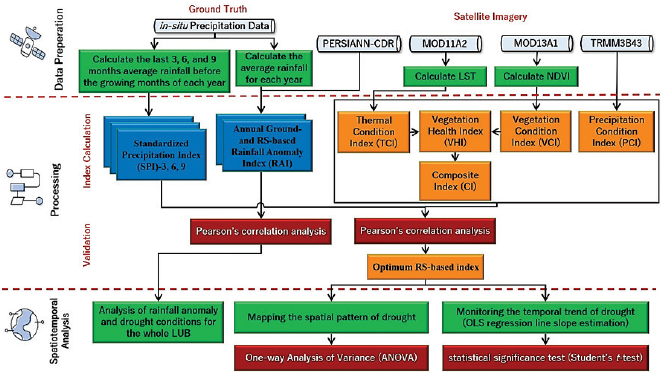
Trend analysis of drought and rainfall anomaly plays a significant role in the sustainable management of agricultural products and water resources and is of great importance to the future development [16]. Consequently, in another phase of the drought monitoring methodology, the temporal trend of agricultural drought was analyzed using the Ordinary Least Squares (OLS) regression method and a linear regression model, i.e. y=ax+b [17]. Then the analysis was carried out based on the slope values of the regression line. The trend analysis is conducted on the pixel values of the optimum RS-based drought index map. The slope product is an image with the same dimensions as the drought indices and it is computed according to Eq. 13 for the period between 2000 to 2019. The slope values equal to zero (SLOPE=0) represent the constant condition of the drought index and positive slope values (SLOPE>0) indicate the increasing trend of the drought index (i.e. drying trend), while negative slope values (SLOPE<0) represent the decreasing trend. Finally, a statistical significance test was carried out at the desired significance level (α) to classify the slope values based on the probability values (p-values).

Where Y stands for the total number of years and y as a counter represents each individual year. In this research Y=20 and y=1,2,3,…,20. DIy is the mean image of the optimum drought index for the growing months of the yth year, and SLOPE represents the slope of the fitted regression lines of the growing months at corresponding pixels of the optimum drought index in 20 years [17][47].
Processing tools
To swiftly access and efficiently manage diverse satellite-derived images, they were utilized within the web-based GEE image processing platform, where spectral vegetation, temperature, and precipitation indices were computed using this cloud-free technology. Additionally, rainfall anomaly indices (namely RAI and SPI) were computed utilizing the Meteorological Drought Monitoring open-source software [48]. IBM SPSS Statistics and Microsoft Excel tools were utilized to organize numerical outputs and perform statistical analysis on the acquired index values. ArcGIS 10.5 was used for area computation, temporal trend analysis, and cartographic mapping.
Results
Analysis of rainfall anomaly
The rainfall conditions of LUB are monitored using both remote sensing and ground-based data. The year-separated PERSIANN-CDR precipitation data from 2000 to 2019 (Fig. 3 A) can be utilized to compute the annual RAI. All years with RAI < 0 indicate probable drought conditions, and when RAI deviates farther from the crucial number (i.e., RAI = -3), the situation becomes increasingly severe. The RAI value is notably low (RAI < -3) in the years 2000, 2001, 2008, and 2013, indicating a higher likelihood of drought conditions during these years, which also experienced the least rainfall (Fig. 3 A). Conversely, the years 2002-2004, 2006, 2009, 2011, 2012, and 2015-2018 exhibited markedly distinct conditions, characterized by extreme wetness, specifically classified as “no drought (ND)” (RAI > 0.3). Given that each transition from RAI>0 to RAI<0 signifies a potential drought state [12], it is deduced that five potential drought events may occur within the 21st century in the LUB. While the methodology of Kundu et al. [12] permits the study to concentrate solely on these years, the present study encompasses the entire period for a more comprehensive spatial and temporal examination.
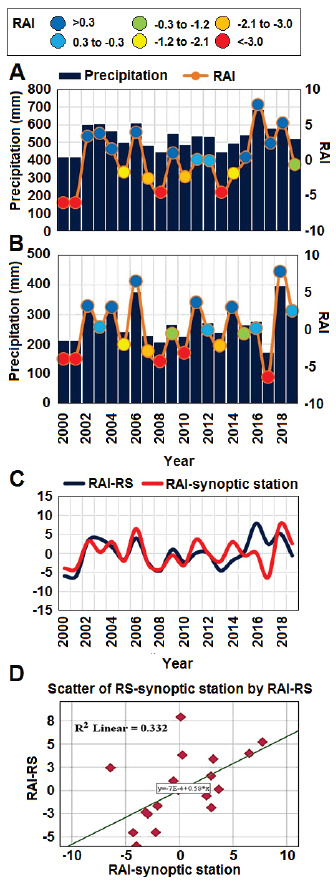
To validate the RS-based RAI, the mean annual precipitation from seven synoptic meteorological stations—Bonab, Maragheh, Sahand, Saqqez, Sarab, Tabriz, and Urmia was collected. The selection of stations was conducted to ensure comprehensive coverage of the whole LUB with optimal distribution. The annual RAI was also calculated from the specified data.
Fig. 3B illustrates the temporal series of in-situ-derived precipitation fluctuations with the ground-based RAI obtained from the previously referenced rain gauges. Fig. 3C demonstrates that the RS-based RAI and the ground-based RAI exhibit analogous behavior. Fig. 3D illustrates the scatter plot of RAI derived from both RS-based and synoptic data. A correlation of 0.576 (R2=0.332) was determined between the two specified RAIs (Fig. 3 D). This connection is significant at α=0.01 in a one-tailed test, with a p-value of 0.004, indicating a 99% confidence interval. This validation demonstrates that the acquired RS-based RAI is dependable and accurately reflects the rainfall deficit across the entire LUB.
Mapping the drought spatial pattern
To analyze the spatial distribution of agricultural drought in the research area, the vegetation growth period of the LUB, specifically from March to September, was considered. The mean RS-based drought indicators were computed for the growing months of 2000 to 2019 seasons. The indices were derived from the maximum value composite (MVC) of a sequence of MODIS pictures, which are also assessed visually for cloud coverage. The TCI, VCI, VHI, CI, and PCI drought condition maps for the growing months from 2000 to 2019 are derived from cloud-free images (Fig. 4). The generated maps are displayed in the MODIS Sinusoidal tile grid projection scheme. It should be noted that the water-covered regions, specifically the LU, in all index maps are obscured and disregarded to avert any influence on the results, as the indices may be inaccurately computed.
The indexes generally indicate varying drought conditions in LUB. Consequently, given that each drought index possesses distinct characteristics and evaluates the drought phenomenon from a particular perspective, encompassing three primary dimensions—vegetation condition, land surface temperature, and precipitation quantity and anomalies—it is advisable to analyze each index independently, taking into account its specific attributes. TCI (Fig. 4 A) regards drought intensity as a variable dependent on the thermal state of the Earth’s surface. The Vegetation Condition Index (VCI) (Fig. 4 B) assesses drought severity by analyzing the condition and density of vegetation in the region. The VHI (Fig. 4 C), as a composite index, evaluates the drought condition by simultaneously considering both the temperature state of the Earth’s surface and the status of vegetation, often assigning equal weights to each factor. The composite index (CI) (Fig. 4 D) assesses the drought conditions by simultaneously considering the Earth’s surface thermal state (LST) and vegetation condition (VCI) with equal weighting. Given that VHI is also considered, the outcomes of CI are typically altered in relation to individual TCI and VHI. The Precipitation Condition Index (PCI) correlates drought conditions with precipitation levels.
TCI maps (Fig. 4 A) and chart (Fig. 5 A) indicate that the peak agricultural drought level, denoted as ED, occurred in the southern region of LUB, encompassing approximately 57 km² in 2001 and 2002, and in the western section of LU, covering about 12 km² during the 2012-2015 period. In the years 2004, 2007, 2010, and 2018, no ED was identified in LUB. The SD state was predominantly observed in the southern region of the LUB, followed by the eastern region of LU. The area impacted by SD is more pronounced in the first half of 2000-2019 than in the latter half, and SD has exhibited a negative trend from 2000 to 2019. The years 2002 and 2009 exhibited the highest and lowest surface density, including approximately 6,697 and 647 km², respectively, which correspond to 12.9% and 1.25% of LUB, respectively. Overall, MoD is the highest-ranking drought classification in all years, followed by mild drought (MiD), ND, SD, and ED in descending order from second to fifth rank (Fig. 5 A). These data indicate that the area of SD is diminishing. In 2002, the region was around 17,953 km² (35% of LUB), representing the peak SD condition, whereas in 2018, it was 13,532 km² (26% of LUB), indicating the lowest SD condition. MiD and ND conditions are predominantly found in the outermost regions of LUB, and from 2000 to 2019, the extent of these two classifications has exhibited a positive trend of expansion. Conversely, ED, SD, and MoD have predominantly transpired in the innermost regions of LUB.
VCI (Fig. 4 B) indicates that a significant portion of the land is classified as MiD and ND. In comparison to VCI, TCI is a comparatively tolerant index that more readily designates the target pixel as a drought-affected region. According to VCI maps, MoD and, in certain instances, SD are identified in the eastern and southern regions of LU with ED occurring mostly in the southern region. The trend of SD conditions mirrors that of ED, since both exhibit a decline from 2000 to 2019. The years 2000 and 2001 experienced the highest occurrence of SD class, around 385 km² and 298 km², respectively, constituting roughly 0.75% and 0.58% of LUB, whereas 2018, with an area of approximately 26 km² (0.05% of LUB), was less impacted by SD. The area influenced by the MoD has remained largely stable over the past 20 years, predominantly occurring in the eastern and southern regions of LU. ND consistently ranked first across all years (Fig. 5 B), followed by MiD, MoD, SD, and ED. In 2002, the MiD condition encompassed 30,894 km², representing 60% of the overall territory, while in 2018, it covered 8,470 km², accounting for 16% of the total area. A significant portion of the LUB has not encountered drought, with the year 2018 exhibiting around 38,066 km² (74% of LUB) as the highest area classified as ND, while the year 2002 recorded about 21,565 km² (42% of LUB) as the lowest ND area.
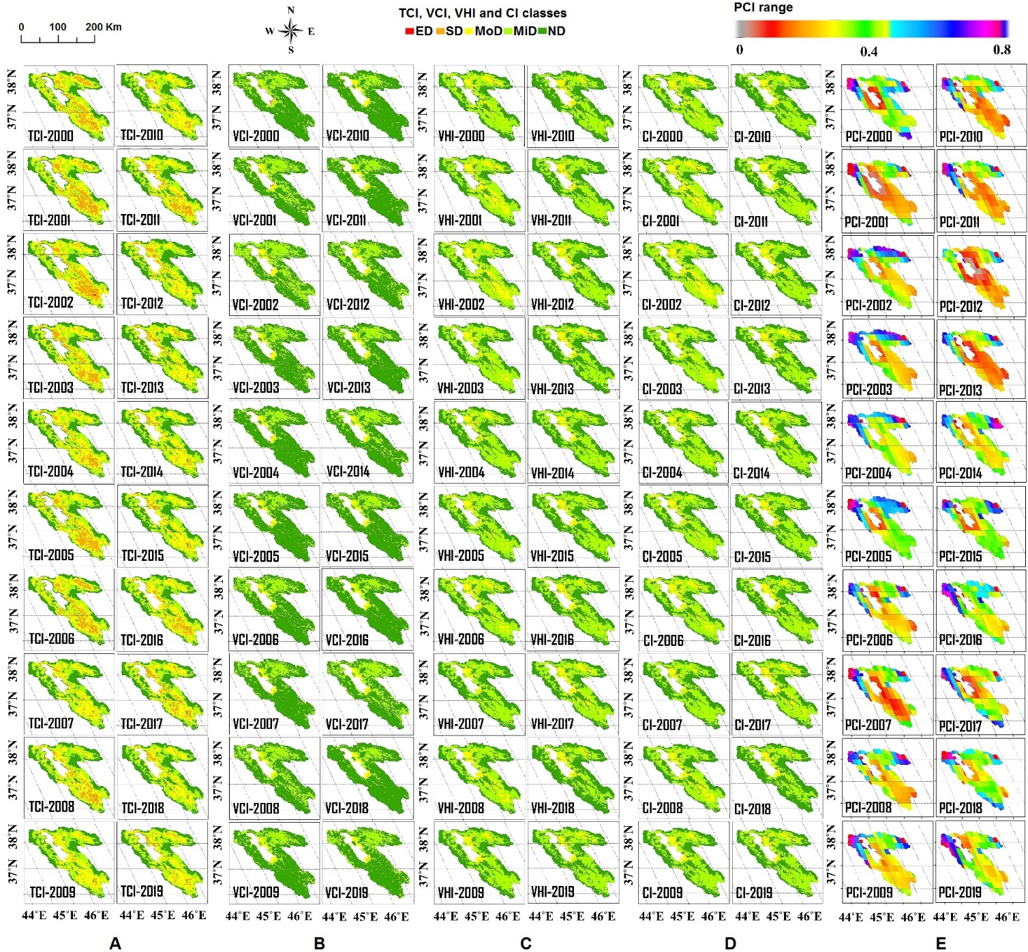
Based on the VHI maps (Fig. 4 C) and area chart (Fig. 5 C), it is evident that no ED has occurred in LUB to date. No substantial spatial displacement happened in various years, including 2000-2001 and 2003-2004, with an extent of less than 3 km². Conversely, the years 2019 and 2015, with areas of around 116 km² and 80 km², respectively, had the largest SD areas, constituting 0.32% and 0.15% of the overall LUB area, respectively. The eastern region of LU is predominantly influenced by MoD (Fig. 4 C). Analysis of the time series (Fig. 5 C) reveals that the largest area of MoD occurred in 2002, measuring approximately 11,096 km², or 21% of LUB. Conversely, in 2007, the minimum MoD area was recorded at approximately 2,688 km², equivalent to 5.2% of LUB. MiD, being the dominant condition throughout the VHI time series, ranked first in 2003 with an area of 26.2 km² (0.05% of LUB), whereas in 2018, the minimum area of MiD was around 17,359 km² (34% of LUB). It is worth noting that MiD formed as a layer surrounding the MoD, predominantly in the innermost region of the ND area (Fig. 4 C). The ND condition exhibited its greatest extent in 2018, covering over 27,255 km² (53% of LUB), whereas the minimal ND condition was recorded in 2002, encompassing around 13,172 km² (25% of the research area). It may be stated that the trend of ND area has expanded over the studied period.
The CI maps (Fig. 4 D) and the time history of the extracted area (Fig. 5 D) indicate that no ED has occurred in LUB to date. Analogous to VHI, no significant spatial deviation was seen in 2000, 2001, 2003, and 2004 (less than 2 km²). Conversely, the years 2019 and 2015, with approximately 124 km² and 87 km² (corresponding to 0.3% and 0.2% of the LUB, respectively), exhibited the largest SD area, hence corroborating the VHI. It is evident that MoD was more frequent in the eastern region of LU (Fig. 4 D). Analysis of the time series (Fig. 5 D) reveals that the largest area of MoD was recorded in 2002, measuring around 12,016 km², which constitutes 23% of the LUB. Conversely, in 2007, the minimal MoD area was identified at around 2,975 km², representing 5.7% of the LUB. MiD, as the dominant condition throughout the CI time series, ranked first in 2003 with an area of 26,393 km², almost 51% of LUB. In 2018, the minimal area of MiD was recorded at roughly 18,034 km², encompassing 35% of LUB.
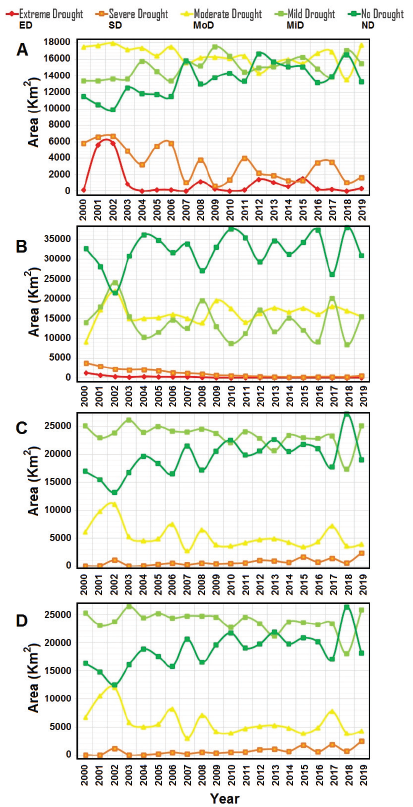
According to composite index (CI) maps, it is evident that MiD manifested as a layer encircling the MoD, predominantly occurring in the innermost region of the ND area (Fig .4 D). The ND class exhibited its maximum extent in 2018, covering over 26,318 km² (51% of LUB), while its minimum extent was recorded in 2002, encompassing around 12,480 km², or 24% of LUB. The trend in the ND area has significantly increased during the century. The severity classes of drought based on CI exhibit a greater similarity to those observed in VHI than to the CI-TCI and CI-VCI combinations.
Given that precipitation is typically the primary determinant of drought occurrence [22], an indicator such as the Precipitation Concentration indicator (PCI), which correlates precipitation with drought conditions, can significantly contribute to drought monitoring efforts when used alongside the previously listed indices. PCI maps indicate that the PCI values in the northwestern, northeastern, and southwestern regions of LUB are comparatively elevated, approaching 0.5, relative to other areas of the research (Fig. 4 E). This circumstance is attributable to the favorable rainfall conditions in the specified regions. Conversely, the circumstances are markedly distinct for the innermost regions of LUB, particularly in the vicinity of the lower section of LU and the southern part of LUB. It is important to note that the conditions were most severe in 2000, 2001, 2007, 2008, 2012, and 2013, as indicated by PCI values approaching zero, signifying a pronounced drought intensity resulting from the rainfall shortfall identified in TRMM precipitation data. The PCI results align with the RAI obtained from PERSIANN-CDR data (Fig. 3 A) throughout the study area.
Validation of RS-based indices
Pearson correlation analysis was conducted between the in-situ synoptic meteorological station SPI throughout 3-, 6-, and 9-month intervals and each of the remote sensing-based drought indices, individually.
This analysis was conducted to assess the efficacy of the RS-based drought indices and to ascertain the presence of any significant association (at a specified significance level) between the RS-based indices and the ground truth data. In this context, the scatterplots of all RS-based indices alongside ground-based SPI-3, SPI-6, and SPI-9 pairings at seven ground stations (Bonab, Maragheh, Sahand, Saqqez, Sarab, Tabriz, and Urmia) are illustrated in Figures 6, 7, and 8, respectively. The average value of each RS-based indicator is computed using a square window encompassing the city that contains each ground station on the GEE platform. In each subplot, the x-axis represents ground-based indices, while the y-axis represents RS-based indices. The values of the ground-based SPI and RS-based index pairs are depicted as red diamonds, with a best-fit line drawn alongside its equation, y=ax+b. The lines are derived by the least-squares adjustment technique. The CoD values in each instance are presented as R2 ϵ[0,+1], signifying the strength of the linear correlation between two index pairs. Analysis of the scatter plots reveals that only VCI exhibits a positive correlation with all three-time scales of SPI across the seven ground rain gauges, as indicated by the consistently positive slope of the fitting line (Figs. 6, 7, and 8). This suggests that the variations in VCI are more closely aligned with SPI-3, -6, and -9 compared to the other four RS-based indices and their respective SPI pairs. In summary, while TCI, VHI, CI, and PCI exhibit a positive correlation with SPI-3, -6, and -9, this holds true only for certain meteorological stations, and there are instances of a negative correlation. The average R2 values for Figures 6 to 8 demonstrate a comparatively stronger linear correlation between RS-base indices and SPI-9 (Average CoD (RCoD2)=0.114), whereas the linear relationship strengths for RS-based indices with SPI-6 and SPI-3 rank second and third, respectively, with RCoD2=0.109 and 0.052. Among all RS-based indices, TCI had a comparatively stronger linear correlation with SPI-3, however in the scatter plot of RS-based indices against SPI-6 and SPI-9, VCI demonstrated the greatest RCoD² value. The weakest linear correlation was noted between PCI and SPI-3, -6, and -9.
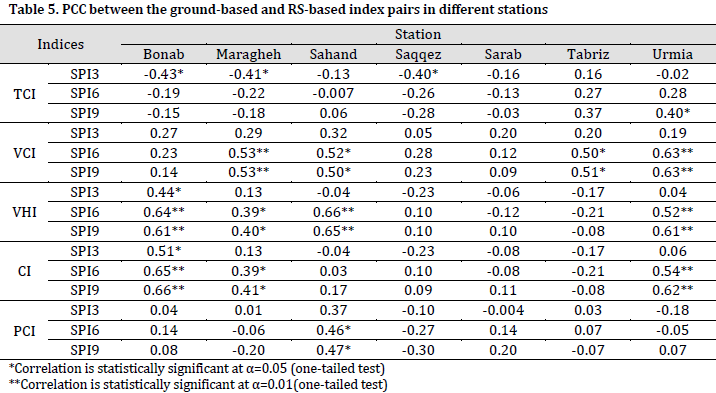
The correlation between each index pair was computed as a value within the range of [-1,+1], referred to as R, known as the Pearson Correlation Coefficient (PCC). Table 5 presents the One-Tailed Pearson correlation coefficients (PCC) between each in-situ Standardized Precipitation Index (SPI) across various time scales and remote sensing (RS)-based indicators. To ascertain the significance of the PCC associated with each index pair, the reports from the statistical significance test (at the α significance level) were considered, indicating that R is significant at α=0.05 and α=0.01 (within the 95% and 99% confidence intervals, respectively) for 25 out of 105 cases.
According to the findings, TCI exhibits a negative correlation with SPI-3 in Bonab, Maragheh, and Saqqez. The PCC for the specified situations was calculated as -0.43, -0.41, and -0.40, respectively. TCI exhibited a notable association with SPI-9 at the Urmia station (R=0.40). The correlation between VCI and SPI-3, -6, -9 is consistently positive across all stations, with the absolute magnitude of the correlation (|R|) being notably significant in most locations, including Maragheh, Sahand, Tabriz, and Urmia (Table 5).
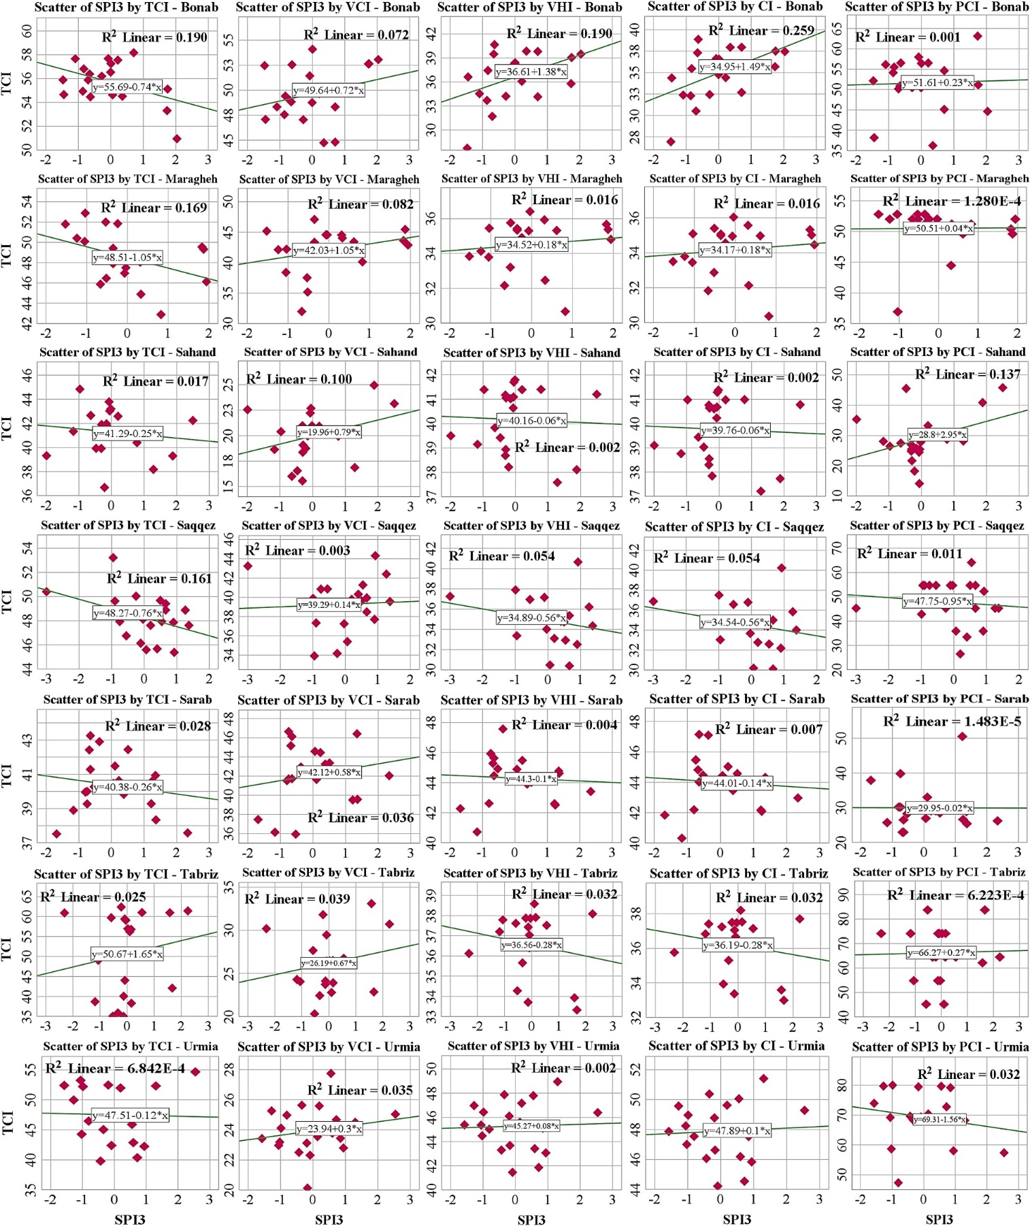
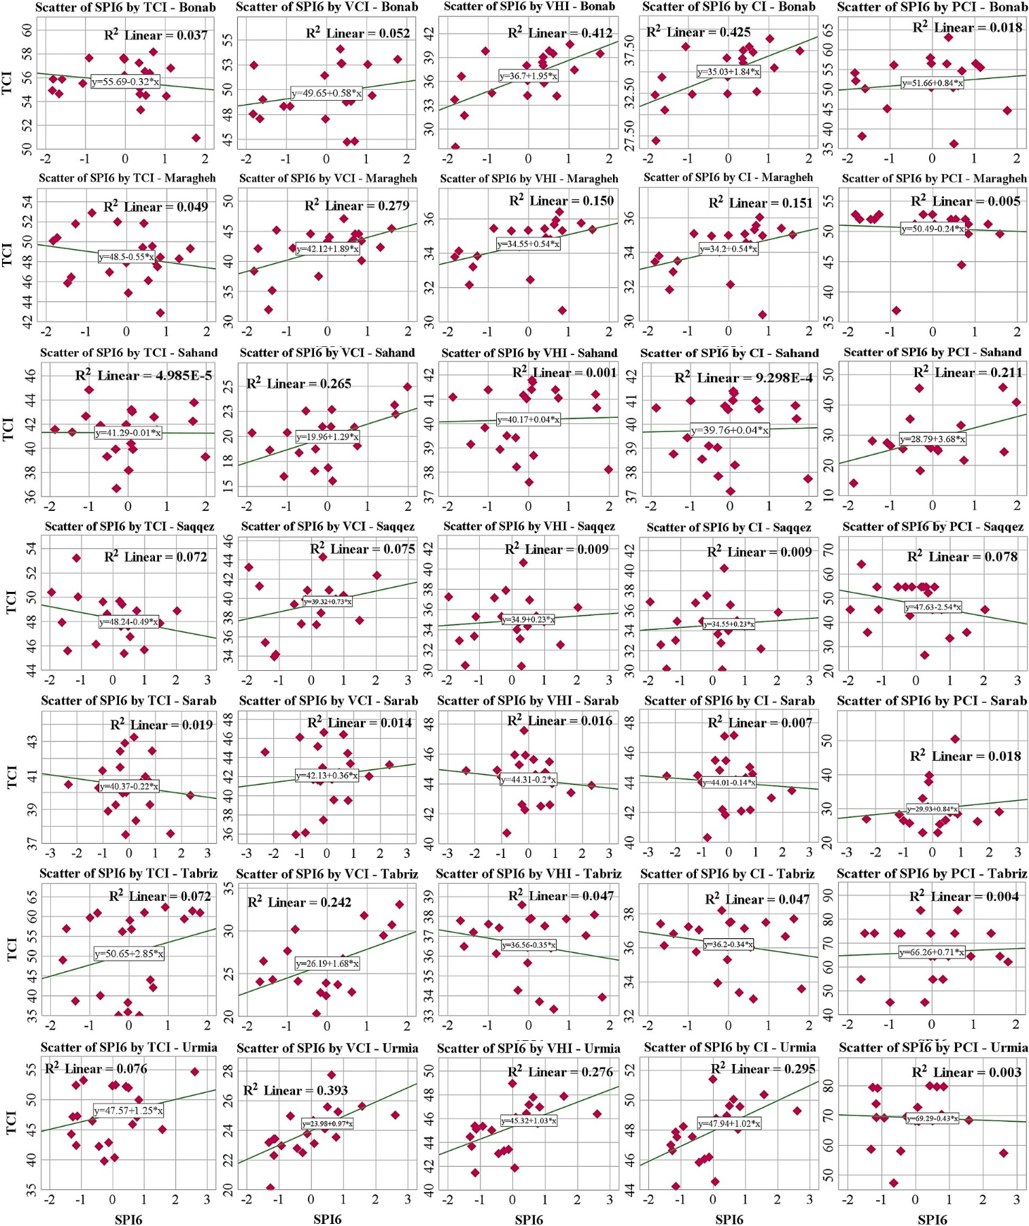
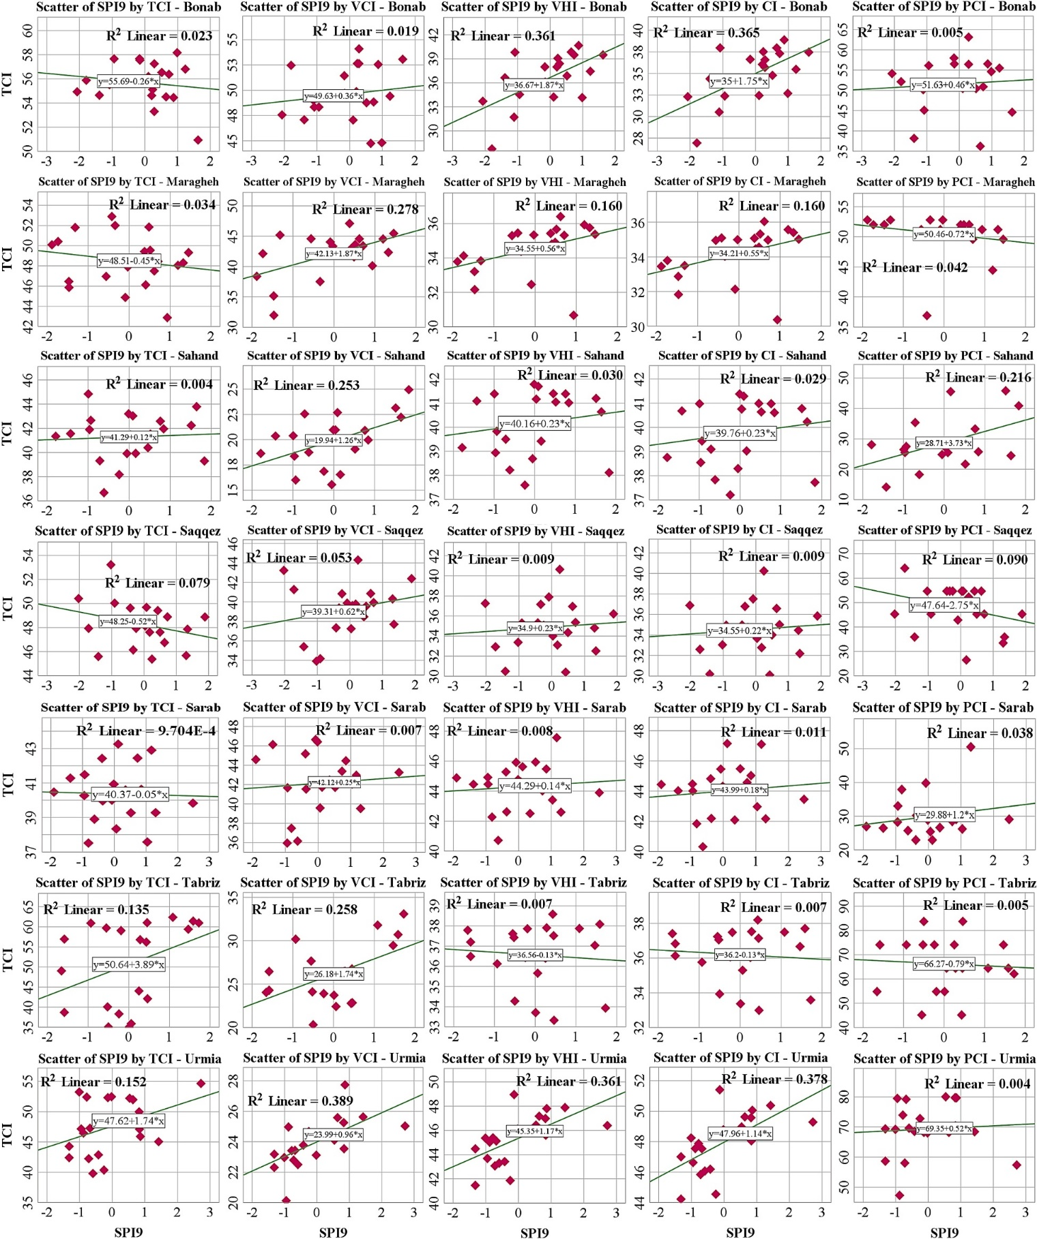
VCI exhibited a substantial correlation with SPI-6 at Maragheh and Urmia stations. The Pearson correlation coefficients for these stations were 0.53 and 0.63, respectively. A significant Pearson correlation coefficient (PCC) with SPI-6 was observed in the Sahand and Tabriz rain gauges. The estimated PCC for these instances was 0.515 and 0.492, respectively. The PCC associated with VCI-SPI9 pairs was notably significant in Maragheh, Urmia, Sahand, and Tabriz. The first two stations exhibit PCC values of 0.53 and 0.63. The last two stations have estimated PCC values of 0.50 and 0.51 (Table 5).
VHI had a significant correlation with SPI-6, with coefficients of R=0.64, 0.66, and 0.52 for the Bonab, Sahand, and Urmia sites, respectively. VHI exhibits a substantial correlation with SPI-6 at the Maragheh station (R=0.39). A statistically significant correlation has been identified between VHI and SPI-9, with PCC values of 0.65, 0.61, and 0.61 for the Sahand, Bonab, and Urmia stations, respectively. A notable correlation was also found among the CI-SPI6 pairs at the Maragheh, Bonab, and Urmia sites, with R values of 0.39, 0.65, and 0.54, respectively. CI exhibited a substantial association with SPI-9 for the Bonab and Urmia sites, with R values of 0.66 and 0.62, respectively. In contrast to VCI-SPI couples, PCI had the weakest correlation with SPI across various time scales. It demonstrated a substantial association with SPI6 and SPI9, with coefficients of R=0.46 and R=0.47, respectively, both seen at the Sahand station. VCI exhibited the highest average R with SPI-3 (RPCC=0.214), whilst the lowest average R was seen between the VHI-SPI6 pair (RPCC=-0.082).
Based on the aforementioned descriptions, it is established that VCI can be considered as the optimal index, exhibiting the highest and most significant positive correlation with all ground-based SPI-3, -6, and -9 across all seven stations. The drought spatial distribution derived from VCI is demonstrated to be more trustworthy than the other four remote sensing-based indices. Consequently, an in-depth examination of drought monitoring is performed with VCI.
Temporal trend analysis of drought
The OLS regression technique was applied to the VCI drought index maps from 2000 to 2019 to simulate the temporal trend of drought conditions in LUB. The initial results of the slope analysis illustrate the estimated slope of the OLS regression line applied to the relevant pixels of the original VCI image (the TIFF image that has not yet been classed into drought categories) over a span of 20 years. The initial slope values ranged from -2.64 to 2.27 (Fig. 9 A). The refined map of the slope product (Fig. 9 B) reveals that most of the LUB exhibited a positive slope, represented in blue.

Approximately 37,971.5 km², or 73.4% of LUB, corresponds to areas where SLOPE>0. Consequently, these regions have seen a tendency towards increased precipitation. Conversely, an area of approximately 10,262.9 km² is allocated to the SLOPE<0 class, including 20% of the research area. It is important to note that the remaining 6.6% of LUB is allocated to LU. The SLOPE<0, indicated in red (Fig. 9 B), predominantly occurs in the northeastern section of the LUB, the eastern region of the LU, and at the southern point of the LUB. While the negative slope has been noted in other regions of the LUB, its prevalence is comparatively lesser than in the aforementioned areas. The regions with SLOPE<0 are those that underwent a drying trend from 2000 to 2019.
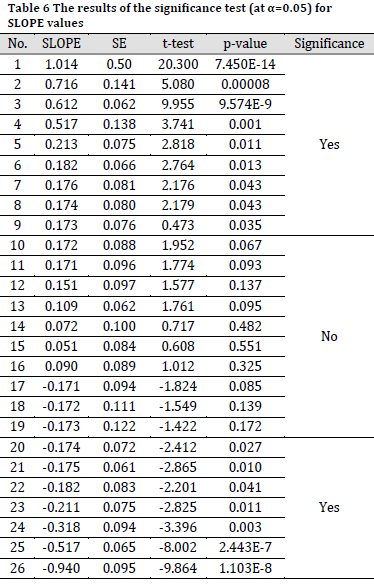
The classification of slope maps can be conducted based on the p-value and significance level (Tabl, indicating the extent to which the slope of the fitted regression line deviates from zero [17][47]. In this context, a hypothesis test that concentrates on the slope of the fitted regression line was performed. In this analysis, the VCI pixel values are treated as the independent variable (X), while “Years” serve as the dependent variable (Y) in the linear equation Y=mX+Y0. In the specified equation, Y0 represents a constant known as the “intercept,” whereas m denotes the slope, referred to as the “regression coefficient”. If the test indicates that the slope of the fitted regression line is significantly different from zero, it can be inferred that a meaningful linear relationship exists between X and Y. This test, conducted at α=0.05 (95% confidence interval), posits the null hypothesis that the slope equals zero, whereas the alternative hypothesis asserts that the slope does not equal zero, i.e., H0: m=0, Ha: m≠0. Utilizing the input data, specifically the VCI pixel values over a 20-year period from 2000 to 2019, the standard error (SE) of the slope, the slope of the regression line, the degrees of freedom (DoF), the test statistic, the p-value, and the T-student statistic (or t-test) are calculated. According to the results presented in the original slope map (Fig. 9 A), derived from Eq. 13, the coordinates of 26 slope map values were retrieved in MATLAB, and the aforementioned parameters were subsequently estimated for each value individually. The objective is to ascertain whether each of the 26 slope values significantly deviates from zero.
The findings from the specified statistical test are presented in Table 6, which includes only the estimated elements pertaining to the slope value, while the information regarding the intercept has been omitted. In each instance, the p-value is juxtaposed with the significance level (α); if p-value < α, then H0 will be rejected. This indicates that the slope considerably deviates from zero; otherwise, H0 will be accepted, asserting that there is no significant difference at α=0.05. For SLOPE>0, the value 0.172 does not statistically differ from zero, however the number 0.173 exhibits a significant difference. A comparable scenario was noted in the values of -0.173 and -0.174 inside the SLOPE<0 portions. According to the test results, the slope map can be divided into four categories depending on significance: “significant SLOPE<0” “non-significant SLOPE<0”, “non-significant SLOPE>0”, and “significant SLOPE>0” (Fig. 9 C). The specified categories encompass SLOPE values within the intervals [-2.64, -0.174], [-0.173, 0], [0, 0.172], and [0.173, 2.26], respectively. The area allocated to each category was calculated, revealing approximately 864.7 km², 9,524.6 km², 26,368.8 km², and 11,469.7 km² for the designated categories, respectively, which correspond to 1.7%, 18.4%, 50.9%, and 22.2% of the total LUB area.
Discussion
This research aimed to identify, monitor, and assess the extent, severity, and temporal trend of agricultural drought in LUB using satellite remote sensing indices, while evaluating their performance against in-situ synoptic SPI-3, -6, and -9 as ground truth. The regional distribution of drought has been analyzed from 2000 to 2019 utilizing five established drought indices: TCI, VCI, VHI, CI, and PCI, focusing on land surface temperature, precipitation, and vegetation health. Consequently, a comprehensive and accurate spatial pattern analysis, along with the monitoring of the temporal trends of agricultural dryness during the growing months, constitutes the advantages of this research.
The findings indicated that several drought indices differ significantly due to their distinct evaluations of the drought phenomenon, encompassing factors such as precipitation and temperature fluctuations, vegetation health, and soil moisture levels. [17][31]. In the study area, the RAI generated from PERSIANN precipitation data exhibited a substantial positive correlation with the RAI acquired from synoptic stations, indicating that satellite-based precipitation data can be employed for drought assessment in this case study. The RAI obtained from PERSIANN-CDR suggests that the year 2000 demonstrated severe drought, corroborating the findings of Khalili et al. [49], who utilized the Standard Index of Annual Precipitation (SIAP) to demonstrate that the research area faced a severe drought state in that year. The findings indicate that the research area has undergone a transition from normal to extreme drought conditions over a 20-year period, with the average area of drought classifications inversely correlated with drought severity, and the intensity of drought varying by sector based on multiple indices. The spatial analysis results demonstrate that VCI exhibited the highest positive correlation with SPI-3, -6, and -9 across all ground-based stations, thereby designating it as the optimal index. This finding agrees with previous works [24][26][50][51] stating that slope and topography influence the drought phenomenon, since most droughts transpired distant from the mountainous areas of LUB. This further corroborates the findings of [3], which stated that slopes influence vegetation indices. Google Earth photos reveal that the western and eastern regions of LUB are hilly, with no dryness detected across all five drought indices, accompanied by significant precipitation, as indicated by the comparatively high PCI values. The results indicate that the combined indices do not consistently outperform the individual indices, thereby contradicting the findings of Pourkhosravani et al. [22]. The behavior of the indices is case-dependent and varies across different studies, precluding the establishment of general rules in this context. The results indicate that both VHI and CI exhibit a comparable spatial pattern, which is in agreement with [17]. This suggests that incorporating VCI and TCI into the VHI with equal weighting (γi=0.33) does not surpass the performance of the individual VHI in the current study region. It is important to recognize that this is not a universal principle, and in other case studies, VHI and CI may exhibit a substantial disparity.
A one-way ANOVA [52] was performed on four index groups: TCIi, VCIi, VHIi, and CIi, to determine the presence of significant differences among them. The specified indices represent the average value of each index over LUB for a duration of 20 years, i.e., i=1,2,3,…,20, with a sample size of 4×20. The statistical community members of the TCI-VHI-CI triplet have similarities among them due to the common temperatures, while the VCI-VHI-CI triplet exhibits similarity through the shared vegetation condition. Although TCI and VCI differ in nature, this discrepancy does not impact the ANOVA test, as both indices share a comparable range (zero to infinity) and consist of five common drought classes. Furthermore, due to PCI’s distinct range relative to the aforementioned indices, it is excluded from this assessment. Levene’s test for homogeneity of variance, a prerequisite for ANOVA, was performed [53]. Levene’s test showed a non-significant variance (p= 0.553) among the different groups are equal. Consequently, an ANOVA test may be performed, and its outcomes will be valid.
The one-way ANOVA showed significant difference (p=1.8013E-29) in the mean values across at least two of the TCI, VHI, and CI groups. A pairwise comparison of each two-by-two index was performed to identify significant differences among them using Duncan’s Multiple Range Test (DMRT) method [54]. Duncan’s Post Hoc test results classified the four specified indices into three unique categories based on their mean values. The test indicated no significant differences between VHI and CI (p= 0.391). On the other hand, TCI and VCI exhibited significant differences from the VHI and CI groups. Consequently, VHI and CI can be classified under a single category, while TCI and VCI are assigned to two separate categories.
The validation phase of the RS-based indices necessitates noting that the SPI, derived from precipitation data, is computed to assess rainfall deficits across various temporal scales (specifically 1, 3, 6, 9, 12, 18, 24, 36, and 48 months) and to monitor drought conditions over both short-term and long-term periods [39]. These durations illustrate the impact of drought on the accessibility of water resources across various categories. Soil moisture responds to variations in rainfall within a brief timeframe, but groundwater, reservoirs, and streamflow exhibit a delayed response to rainfall anomalies over an extended duration [55]. This study concentrated on agricultural drought, specifically employing the SPI over 3, 6, and 9-month intervals during the validation phase of RS-based indices to evaluate the influence of short-term precipitation anomalies on agricultural drought, as these three temporal scales are standard metrics for agricultural drought monitoring research. For alternative drought assessments, the Standardized Precipitation Index (SPI) is appropriate for extended time scales. The Pearson correlation results for VCI-SPI-3, -6, -9 pairs indicated that the rainfall deficit over a 6-month period has a greater impact on the agricultural drought of LUB, followed by the deficits over 9-month and 3-month periods, which rank second and third, respectively.
According to the slope analysis of VCI, the majority of LUB, characterized by various land cover types, demonstrates that a SLOPE>0 signifies a declining trend in drought conditions within LUB. This contradicts previous findings [29][30], potentially due to differing study timeframes. Drought conditions have improved since the second decade of the 21st century, resulting in a drastic alteration of the slope’s sign. In certain regions of the northeastern LUB where SLOPE<0, a drying tendency is evident. While temporal trends of drought may vary across different indices, only the VCI trend has been examined due to its positive association with SPI and its comparatively greater reliability.
Alongside the impact of rainfall anomalies, land surface temperature, and vegetation conditions, future research should also consider additional parameters such as terrain, land slope, vegetation type, soil type, soil moisture, wind intensity, and wind direction. For instance, the Soil Moisture and Ocean Salinity (SMOS) and Soil Moisture Active Passive (SMAP) datasets are appropriate selections [56][57]. It is significant that neither was available during the first decade of the 21st century (SMAP and SMOS were available from 2015 and 2009, respectively [58]). Therefore, they were excluded from the current analysis. The findings of this research may significantly influence governmental decisions and assist policymakers in more effectively managing drought and mitigating its impacts.
Conclusions
Drought exerts a more pronounced influence on human existence than other natural calamities. The agricultural sector faces significant challenges due to decreased precipitation. Therefore, it is crucial to continuously evaluate the intensity of the drought. This study evaluated rainfall anomalies and agricultural drought through PERSIANN-CDR, TRMM, and MODIS-derived indices, correlating them with in-situ annual RAI and SPI-3, -6, and -9 over the Lake Urmia Basin (LUB). The spatiotemporal dynamics of drought were analyzed for the period from 2000 to 2019 using annual drought index series. Notwithstanding the intricacies of the drought phenomena, the findings unequivocally demonstrate that the spatial distribution of drought and non-drought conditions, as well as the temporal trends, have been effectively mapped and monitored by geospatial methodologies and satellite data. This analysis indicates that agricultural drought primarily falls into MiD classifications, while most of LUB area has not encountered any drought conditions. Moreover, most of the study area has a negative drying tendency. The RS-based assessment methodology presented in this research appears to yield significant advancements in agricultural drought monitoring. The findings of the present study will inform governments and policymakers about developments regarding LUB and LU, enabling timely interventions against this natural phenomenon. The positive Pearson correlation coefficient between Vegetation Condition Index (VCI) and all in-situ Standardized Precipitation Index (SPI) validates the efficacy of this remote sensing-based method for evaluating agricultural drought in LUB.
Despite employing several meteorological stations in this research and attempting to ensure a homogeneous distribution over the LUB, the quantity of stations is inadequate, and their distribution is neither suitable nor dense enough to encompass the entire study region. Consequently, RS technology is crucial in rapidly and accurately assessing agricultural drought. Moreover, The GEE platform has facilitated continuous and near real-time drought monitoring more effectively than previously. The vegetation state of LUB more accurately represents the drought conditions of the research region. The application of indices is contingent upon the specific instance, and no singular index is universally applicable to all case studies with varying attributes. Regularly conducted similar research is essential to prompt the government to take timely action in response to severe indicators of drought and to mitigate future drought impacts. To effectively address the drought phenomenon, civil projects must be implemented for the optimal management of water resources, the development of green spaces should be prioritized, and industrial pollutants must be minimized to facilitate temperature regulation in the region. The presented RS-based maps and analogous analyses of this research can be pivotal in the preliminary phase of all the aforementioned processes.
References
- Damavandi AA, Rahimi M, Yazdani MR, Noroozi AA. Spatial monitoring of agricultural drought through time series of NDVI and LST indices of MODIS data (case study: Markazi Province). Sci.-Res. Q. Geogr. Data. 2016;25(99):115-26. DOI
- Hu T, van Dijk AI, Renzullo LJ, Xu Z, He J, Tian S, Zhou J, Li H. On agricultural drought monitoring in Australia using Himawari-8 geostationary thermal infrared observations. Int. J. Appl. Earth Obs. Geoinf. 2020;91:102153. DOI
- Behrang Manesh M, Khosravi H, Heydari Alamdarloo E, Saadi Alekasir M, Gholami A, Singh VP. Linkage of agricultural drought with meteorological drought in different climates of Iran. Theor. Appl. Climatol. 2019;138:1025-33. DOI
- Lu J, Carbone GJ, Gao P. Mapping the agricultural drought based on the long-term AVHRR NDVI and North American Regional Reanalysis (NARR) in the United States, 1981–2013. Appl. Geogr. 2019;104:10-20. DOI
- Ogunrinde AT, Olasehinde DA, Olotu Y. Assessing the sensitivity of standardized precipitation evapotranspiration index to three potential evapotranspiration models in Nigeria. Sci. Afr. 2020;8:e00431. DOI
- Ray SS, Sesha Sai MV, Chattopadhyay N. Agricultural drought assessment: Operational approaches in India with special emphasis on 2012. In High-impact weather events over the SAARC region. Cham: Springer International Publishing. 2014:349-64. DOI
- Zhao C, Brissette F, Chen J, Martel JL. Frequency change of future extreme summer meteorological and hydrological droughts over North America. J. Hydrol. 2020;584:124316. DOI
- Vergni, L. Agricultural drought: Indices, definition and analysis. The Basis of Civilization–water Science? IAHS Publication. 2004(286):246.
- Dutta D, Kundu A, Patel NR, Saha SK, Siddiqui AR. Assessment of agricultural drought in Rajasthan (India) using remote sensing derived Vegetation Condition Index (VCI) and Standardized Precipitation Index (SPI). Egypt. J. Remote Sens. Space Sci. 2015;18(1):53-63. DOI
- Zarei R, Sarajian M, Bazgeer S. Monitoring meteorological drought in Iran using remote sensing and drought indices. Desert. 2013;18(1):89-97. DOI
- Food and Agriculture Organization (FAO). Country fact sheet on food and agriculture policy trends. Iran, Socio-economic context and role of agriculture. 2014.
- Kundu A, Denis DM, Patel NR, Dutta D. Spatial pattern of agricultural drought using noaa-avhrr derived vegetation indices. Remote Sensing for Natural Resources Management & Monitoring. 2016:276..
- Vaani N, Porchelvan P. Monitoring of agricultural drought using fortnightly variation of vegetation condition index (VCI) for the state of Tamil Nadu, India. The International Archives of the Photogrammetry, Remote Sensing and Spatial Information Sciences. 2018;42:159-64. DOI
- Zagade N, Kadam AK, Umrikar BN, Maggirwar BC. Remote sensing-based assessment of agricultural droughts in sub-watersheds of upper Bhima basin India. J. Remote Sens. Land. 2018;2(2):105-11. DOI
- Yoon DH, Nam WH, Lee HJ, Hong EM, Feng S, Wardlow BD, Tadesse T, Svoboda MD, Hayes MJ, Kim DE. Agricultural drought assessment in East Asia using satellite-based indices. Remote Sens. 2020;12(3):444. DOI
- Güner Bacanli Ü. Trend analysis of precipitation and drought in the A egean region, T urkey. Meteorol. Appl. 2017;24(2):239-49. DOI
- Han Y, Li Z, Huang C, Zhou Y, Zong S, Hao T, Niu H, Yao H. Monitoring droughts in the Greater Changbai Mountains using multiple remote sensing-based drought indices. Remote Sens. 2020;12(3):530. DOI
- Okal HA, Ngetich FK, Okeyo JM. Spatio-temporal characterisation of droughts using selected indices in Upper Tana River watershed, Kenya. Sci. Afr. 2020;7:e00275. DOI
- Shamsipour AA, AlaviPanah SK, Mohammadi H, Azizi A, Khoshakhlagh F. An analysis of drought events for central plains of Iran through an employment of NOAA-AVHRR data. Desert. 2008;13(2):105-15. DOI
- Tavazohi E, Ahmadi M. Assessment of drought in the Zayandehroud basin during 2000-2015 using NDDI and SPI indices. Fresenius Environ. Bull. 2018;27(4):2332-40.
- Heydari H, Valadan Zoej M, Maghsoudi Y, Dehnavi S. An investigation of drought prediction using various remote-sensing vegetation indices for different time spans. Int. J. Remote Sens. 2018;39(6):1871-89. DOI
- Porkhosravani M, Karimi S, Mehrabi A, Mohebbi Kermani AT. Spatial monitoring of drought in the Khatun Abad basin using SPI and remote sensing technique. Desert Ecosyst. Eng. 2019;8(3):44-31. DOI
- Karimi M, Shahedi K, Raziei T, Miryaghoobzadeh M. Analysis of Performance of vegetation indices on agricultural drought using remote sensing technique in Karkheh basin. Iran. J. Remote Sens. GIS. 2020;11(4):29-46.
- Kazempour Choursi S, Erfanian M, Ebadi Nehari Z. Evaluation of MODIS and TRMM satellite data for drought monitoring in the Urmia lake basin. Geogr. Environ. Plan. 2019;30(2):17-34. DOI
- Mirgol B, Nazari M, Etedali HR, Zamanian K. Past and future drought trends, duration, and frequency in the semi‐arid Urmia Lake Basin under a changing climate. Meteorol. Appl. 2021;28(4):e2009. DOI
- Bajgiran PR, Darvishsefat AA, Khalili A, Makhdoum MF. Using AVHRR-based vegetation indices for drought monitoring in the Northwest of Iran. J. Arid Environ. 2008;72(6):1086-96. DOI
- Aghakouchak A, Norouzi H, Madani K, Mirchi A, Azarderakhsh M, Nazemi A, Nasrollahi N, Farahmand A, Mehran A, Hasanzadeh E. Aral Sea syndrome desiccates Lake Urmia: call for action. J. Great Lakes Res. 2015;41(1):307-11. DOI
- Rezaei Banafsheh M, Rezaei A, Faridpour M. Analyzing agricultural drought in east Azarbaijan province emphasizing remote sensing technique and vegetation condition index. Water Soil Sci. 2015;25(1):113-23.
- Zynali B, Asghari SS, Saffarian ZV. Monitoring and Forecast of Drought in Urmia Lake Basin by SEPI Index and ANFIS Model. J. Spat. Anal. Environ. Hazards. 2017;4:73-96.
- Sobhani B, Zengir VS, Kianian MK. Drought monitoring in the Lake Urmia basin in Iran. Arab. J. Geosci. 2019;12:1-5. DOI
- Solaimani K, Darvishi S, Shokrian F. Analysis of agricultural drought using remote sensing indices (Case study: Marivan city). J. RS GIS Nat. Resour. 2019;10(2):15-33.
- Fatemi M, Narangifard M. Study of spatial and temporal rain and drought patterns in the south of Iran using TRMM. Desert. 2018;23(2):243-53.
- Fazel Dehkordi L, Sohrabi TA, Ghanavizbaf MH, Ghazavi R. Drought monitoring by using of MODIS satellite images in dry lands (Case study: Isfahan Rangelands). Geogr. Environ. Plan. 2016;27(3):177-90. DOI
- Safari Shad M, Habibnejad Roshan M, Ildoromi A. Evaluation of NDVI Index in drought monitoring using Remote Sensing Technique (Case study: Isfahan Province). Sci.-Res. Q. Geogr. Data. 2017;25(100):35-44. DOI
- Earth Engine Data Catalog (EEDC). Land Processes Distributed Active Archive Center (LP DAAC)-Search Data Catalog- MOD11A1. 2021. DOI
- EEDC. LP DAAC-Search Data Catalog-MOD13A1. 2021. DOI
- Huffman GJ, Bolvin DT, Nelkin EJ, Adler RF. Heading Toward Launch with the Integrated Multi-Satellite Retrievals for GPM (IMERG). In6th International Precipitation Working Group Workshop 2012;7230.2012.
- Sorooshian S, Hsu K, Braithwaite D, Ashouri H, NOAA CDR Program. “NOAA Climate Data Record (CDR) of Precipitation Estimation from Remotely Sensed Information using Artificial Neural Networks (PERSIANN-CDR), Version 1 Revision 1. [indicate subset used].” NOAA National Centers for Environmental Information. 2014. DOI
- Alahacoon N, Edirisinghe M, Ranagalage M. Satellite-based meteorological and agricultural drought monitoring for agricultural sustainability in Sri Lanka. Sustainability. 2021;13(6):3427. DOI
- Siddiqui S, Javid K. Spatio-temporal analysis of aridity over Punjab Province, Pakistan using remote sensing techniques. Int. J. Econ. Environ Geol. 2018;9(2):01-10.
- Kogan FN. Remote sensing of weather impacts on vegetation in non-homogeneous areas. Int. J. Remote Sens. 1990;11(8):1405-19. DOI
- Kogan F. World droughts in the new millennium from AVHRR‐based vegetation health indices. Eos Trans. Am. Geophys. Union. 2002;83(48):557-63. DOI
- Ali S, Henchiri M, Yao F, Zhang J. Analysis of vegetation dynamics, drought in relation with climate over South Asia from 1990 to 2011. Environ. Sci. Pollut. Res. 2019;26:11470-81. DOI
- Du L, Tian Q, Yu T, Meng Q, Jancso T, Udvardy P, Huang Y. A comprehensive drought monitoring method integrating MODIS and TRMM data. Int. J. Appl. Earth Obs. Geoinf. 2013;23:245-53. DOI
- Van Rooy MP. A rainfall anomally index independent of time and space, notos. 1965:43-8.
- McKee TB, Doesken NJ, Kleist J. The relationship of drought frequency and duration to time scales. In Proceedings of the 8th Conference on Applied Climatology. 1993;17(22)179-83.
- Huang F, Xu S. Spatio-temporal variations of rain-use efficiency in the west of Songliao Plain, China. Sustainability. 2016;8(4):308.
- Salehnia N, Alizadeh A, Sanaeinejad H, Bannayan M, Zarrin A, Hoogenboom G. Estimation of meteorological drought indices based on AgMERRA precipitation data and station-observed precipitation data. J. Arid Land. 2017;9:797-809. DOI
- Khalili A, Hojjam S, Bazrafshan J. The comparison and categorizing of seven drought indices from succession of drought, normal and wet years point of view in some climatic zones of Iran. In Proceedings of the Sixth Inter-Regional Conference on Environment-Water ‘‘Land and Water Use Planning and management, Albacete, Spain 2003.
- Rezaeimoghadam M, Valizadeh Kamran K, Rostamzadeh H, Rezaee A. Evaluating the adequacy of MODIS in the assessment of drought (Case study: Urmia Lake Basin). Geogr. Environ. Sustain. 2013;2(4):37-52.
- Hamzeh S, Farahani Z, Mahdavi S, Chatrobgoun O, Gholamnia M. Spatio-temporal monitoring of agricultural drought using remotely sensed data (Case study of Markazi province of Iran). J. Spat. Anal. Environ. Hazards. 2017;4(3):53-70. DOI
- Fisher RA. XV.—The correlation between relatives on the supposition of Mendelian inheritance. Earth Environ. Sci. Trans. R. Soc. Edinb. 1919;52(2):399-433. DOI
- Levene H. Robust Tests for Equality of Variances. Contrib. to Probab. Stat. Essays Honor Harold Hotell. 1961.
- Duncan DB. Multiple range and multiple F tests. Biometrics. 1955;11(1):1-42. DOI
- Agricultural and Meteorological Software (AgriMetSoft). FAQ, What is the difference between SPI-12 and annual SPI?. 2020.
- Martínez-Fernández J, González-Zamora A, Sánchez N, Gumuzzio A, Herrero-Jiménez CM. Satellite soil moisture for agricultural drought monitoring: Assessment of the SMOS derived Soil Water Deficit Index. Remote Sens. Environ. 2016;177:277-86. DOI
- Mladenova IE, Bolten JD, Crow W, Sazib N, Reynolds C. Agricultural drought monitoring via the assimilation of SMAP soil moisture retrievals into a global soil water balance model. Front. Big Data. 2020;3:10. DOI
- EEDC. NASA-USDA Enhanced SMAP Global Soil Moisture Data. 2021.
Cite this article:
Dadrass Javan, F., Samadzadegan, F., Toosi, A., TousiKordkolaei, H. Spatial-temporal patterns of agricultural drought severity in the Lake Urmia Basin, Iran: A cloud-based integration of multi-temporal and multi-sensor remote sensing data. DYSONA – Applied Science, 2025;6(2): 239-261. doi: 10.30493/das.2025.486806

