Duygu Arikan İspir 1*
1, Faculty of Engineering and Natural Sciences, Konya Technical University, Konya, Türkiye
E-mail:
darikan@ktun.edu.tr
Received: 12/02/2025
Acceptance: 30/04/2025
Available Online: 01/05/2025
Published: 01/07/2025

Manuscript link
http://dx.doi.org/10.30493/DAS.2025.506287
Abstract
Ensuring the ecological security of Lake Tuz, a region sensitive to the consequences of climate change, depends on the assessment of temporal and spatial changes in the ecological environment quality. This work thoroughly investigated the temporal and spatial dynamics of Lake Tuz from 2013 to 2023 using temperature and perceptation data in addition to Modified Normalized Difference Water Index (MNDWI) and utilizing Google Earth Engine (GEE) platform. Moreover, SHapley Additive exPlanations (SHAP) and eXtreme Gradient Boosting (XGBoost) were applied to analyze the inflence of climatic variables on the spatio-temporal variation of the lake. Natural components were identified as the primary factors influencing Lake Tuz, with temperature exerting a greater effect on water evaporation and the reduction of the lake’s surface area than rainfall. The MNDWI analysis indicated a consistent reduction in the lake’s water area throughout the study period, notwithstanding the cyclical variations during wet seasons. The present study underscores the necessity of sustainable water resource management in the region.
Keywords: Remote sensing, Google Earth Engine, Drought, Climate change, SHAP
Introduction
Terrestrial open-surface water bodies, such as lakes, reservoirs, artificial water storage areas, streams, and rivers, are essential water sources for aquatic and terrestrial ecosystems [1]. Natural and man-made water reservoirs are undoubtedly important for industrial production, agricultural operations, and the ecosystem. Water resources are therefore vital for human existence and the continuation of sustainable ecological development [2][3]. Water pollution, climate change, and human activity have all contributed to significant loss of surface water resources over the last century [4]. Globally, roughly 90,000 km² of permanent water bodies have been lost over the last 40 years, with more than 70% of this loss in the Middle East and Central Asia [5].
Investigating water surfaces change over time assists a better control of water resources [6]. In this context, remote sensing (RS) methods aid in monitoring the temporal and spatial dynamics of water bodies for sustainable development and ecosystem management [7][8]. Researchers are resorting to the Google Earth Engine (GEE) platform, which provides a faster, more efficient option, compared to conventional techniques of acquiring satellite imagery involving labor-intensive and time-consuming preprocessing [9]. GEE offers open access to several satellite platforms, enabling extensive data processing and straightforward data storage and preservation, rendering it a favored choice for remote sensing applications [10].
Diverse remote sensing instruments and data processing methodologies are utilized to identify water bodies. Frequently utilized optical satellite imagery comprises Landsat, Sentinel, and MODIS satellites. The Landsat satellite mission is often favored for the identification of water bodies [8][11]. The MODIS sensor on the Terra and Aqua satellites is mostly utilized for the detection of water bodies across extensive regions. In fact, utilizing diverse satellite data and methodologies, including spectral indices, classification, machine learning, and deep learning, enables the identification of water bodies [12]. Researchers frequently utilize indices that differentiate aquatic environments from terrestrial and other surfaces by analyzing reflectance variances in certain spectral bands captured by satellites. Spectral indices are derived from mathematical combinations of the reflectance values of designated bands [8][13][14].
In the identification of water bodies, green (G), near-infrared (NIR), and shortwave infrared (SWIR) bands are generally favored. Water displays low reflectance in the NIR and SWIR bands, while land and vegetation exhibit high reflectance in these regions, hence enabling the straightforward identification of water bodies. The initial NDWI (Normalized Difference Water Index) was presented in research undertaken in 1995 [15]. Currently, numerous significant water indices have been developed, such as the Modified NDWI (MNDWI), Automated Water Extraction Index (AWEI), Multi-Band Water Index (MBWI), Water Index 2015 (WI2015), Augmented NDWI (ANDWI), and Tasseled Cap Transformation (TCT) [16-19]. Zhang et al. [20] utilized NDVI and NDWI methodologies to investigate the impact of drought conditions on vegetation and water levels in the Ebinur Lake basin. Benzougagh et al. [21] employed NDWI analysis to assess water levels in reservoirs, whereas Aroma et al. [22] utilized MNDWI analysis for the delineation of coastal regions. A study by Awasthi [13] investigated the link between NDVI, NDBI, and NDWI, utilizing spectral indices to analyze regional differences.
Elucidating the factors affecting water alterations using artificial intelligence models provides an additive significance [23]. Nevertheless, conventional machine learning algorithms, a branch of artificial intelligence, frequently lack the capacity to elucidate the rationale behind individual forecasts or to substantiate the model’s judgments. The SHAP (SHapley Additive exPlanations) method, grounded on the TreeExplainer architecture, serves as an effective instrument for delivering local-level elucidations of machine learning model predictions [23]. This approach proficiently detects nonlinear relationships by facilitating adaptable modeling, interpretation, and visualization of intricate geographical phenomena and processes. The TreeExplainer-based SHAP technique is employed across several domains, including the analysis of temperature-dependent death rates [23], natural disasters such as floods [24], and the investigation of ecological conditions associated with climate change [25].
This research examines alterations in water surface elevations in Lake Tuz, Turkey’s second-largest lake and an important wetland region. Lake Tuz plays a prominent role in the preservation of biological diversity, accommodating thousands of avian species, and functioning as an essential natural nesting habitat for flamingos. Moreover, it serves as a refuge for endangered avian species including the Imperial Eagle, Steppe Eagle, and Egyptian Vulture [26]. Climate change and human involvement have significantly affected the atmospheric and hydrological cycles of the lake, potentially constraining biological systems and regional sustainable development. Consequently, monitoring drought and adopting requisite steps are vital for ensuring social, economic, and ecological security in the lake and surrounding region.
Despite the growing significance of monitoring water resources, substantial deficiencies persist in the precise evaluation of lake level fluctuations and their correlation with climate variability, especially in arid and semi-arid regions. Conventional terrestrial approaches frequently exhibit constraints in regional extent and temporal resolution, rendering remote sensing an essential instrument for extensive hydrological evaluations. Further research is necessary to assess the reliability of satellite-based surveillance in detecting changes in water volume and elucidating their connections to climatic variables. This study seeks to fill these gaps by evaluating lake level fluctuations in the Lake Tuz region by remote sensing techniques utilizing satellite data and climate indices. For that purpose, the Modified Normalized Difference Water Index (MNDWI) will be employed to monitor water fluctuations over a decade (2013–2023) utilizing Landsat-8 and Landsat-9 images. The study also investigates the influence of temperature and precipitation on water levels using SHapley Additive exPlanations (SHAP) analysis, thus offering a clearer comprehension of climate effects. This research integrates climate indicators with remote sensing data to provide a thorough understanding of drought impacts and enhance water resource management tactics in drought-prone areas.
Material and Methods
Study area
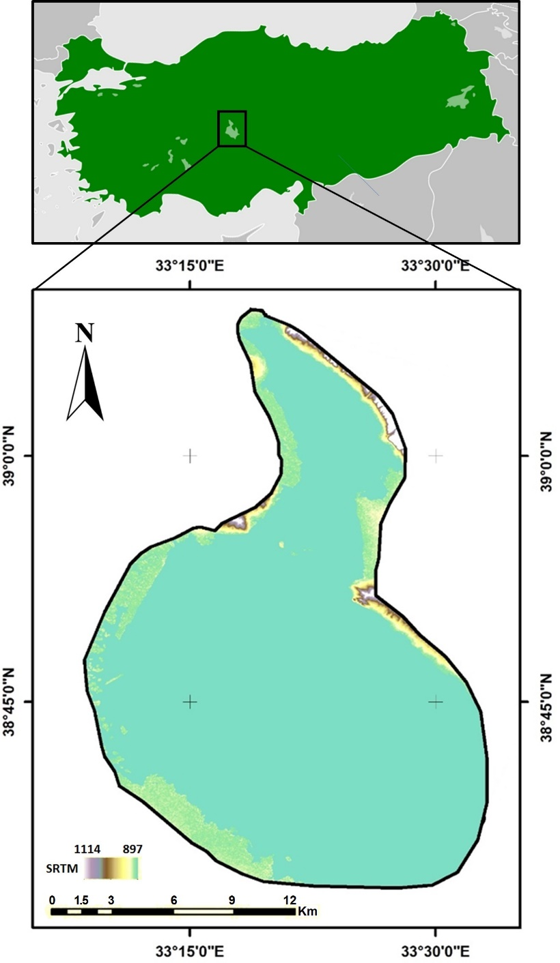
Situated in Central Anatolia (38.50°N latitude and 33.20°E longitude), Lake Tuz is Turkey’s second-largest lake (Fig. 1). SAYBIS statistics indicate it covers an area of 228,882 hectares [26]. The lake’s salinity is estimated to be approximately 32% [27][28]. The lake is surrounded by high peaks in a confined basin preventing humid sea air from entering the region. This generates a continental climate marked by hot and dry summers and cold, snowy winters. Though rainfall is common, the streams supplying the lake are limited and typically dry up in the summer. While in winter, temperatures fall to -5 to 10°C, often causing frost and snowfall; during summer, temperatures vary from 30 to 35°C, with low precipitation and strong evaporation rates. The area receives an average annual rainfall of 250–400 mm, mostly concentrated in late autumn, winter, and early spring. High temperatures and low rainfall hasten evaporation and cause seasonal water level changes. Consequently, these weather patterns have a major impact on the water level fluctuations of the lake, and resulting in a general water depth of less than 40 cm. The area is also known for the northwest-southeast trending Lake Tuz fault, one of the major tectonic features in Central Anatolia [29]. The lake, which hosts hundreds of birds including flamingos, has no aquatic flora owing to its high salt content [28].
Google earth engine and datasets
The data used in the study to monitor changes in Lake Tuz were obtained through Google Earth Engine (GEE). The fundamental workflow of this study is illustrated in Figure 2. GEE is a powerful cloud-based platform used for large-scale environmental data analysis and visualization. Launched by Google in 2010, this platform provides a comprehensive toolkit for researchers, scientists, policymakers and environmental organizations [30][31]. GEE can process petabyte-sized datasets, enabling users to conduct large-scale environmental analyses on topics such as deforestation [32], land use changes [33][34], air pollution [35] and water resources [36]. It offers access to data spanning over 40 years and various satellite sources (Landsat, Sentinel, and MODIS) [30]. The platform facilitates easy visualization of data through maps and charts. This three-component platform ensures that complex data is presented in a more understandably and effectively.
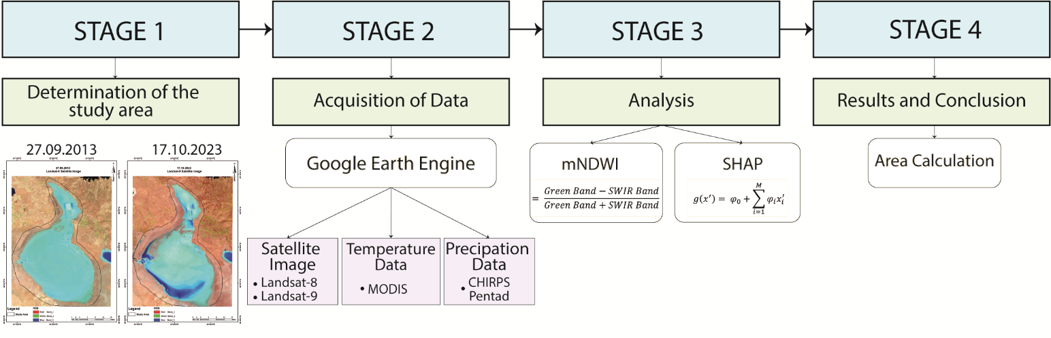
The study focused on two main sections: meteorological indices and remote sensing indices. All processing tasks were carried out on the GEE platform. CHIRPS Pentad data were used for precipitation, MODIS data for temperature, and Landsat-8 and Landsat-9 satellite imagery for monitoring drought (Table 1).Imagery (Red, Green, Blue, and SWIR bands) from two satellites were utilized in this study. Landsat-8 was used from 2013 to 2020, while Landsat-9 was used from 2021 to 2023.
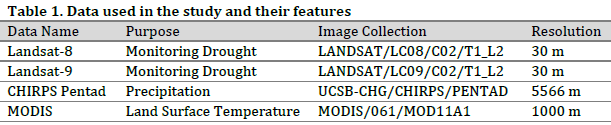
Understanding the effects of climate change in the region through the temporal analysis of precipitation and temperature variations provides critical information for the study. This is because the average global surface temperature is continuously rising, negatively affecting precipitation patterns [30] and impacting wetlands [16]. One of the most commonly used types of remote sensing data for Land Surface Temperature (LST) studies is Landsat and MODIS imagery [19][30][37]. For this study, MODIS data was preferred. For precipitation data, a system that combines ground-based observations with satellite data, known as “CHIRPS Daily: Climate Hazards Group Infrared Precipitation with Station Data” (Version 2.0 Final), a hemispheric precipitation dataset collected over more than 30 years, was used. CHIRPS creates gridded precipitation time series for trend analysis and monitoring of seasonal drought by combining 0.05° resolution satellite imagery with data from ground stations [38].
Methodology
In order to analyze the climatic impact, especially temperature and precipitation, on the spatiotemporal variability of the lake, the SHAP method was utilized. This method is based on the SAPE values from game theory [39]. SHAP values are used to fairly determine the contribution of each feature to the overall success of a team game [39][40]. The SHAP values for the XGBoost model were computed using the SHAP library in Python (Eq. 1). In the equation, an individual prediction for a specific input example with a given feature M is decomposed into contributions from each feature [41].
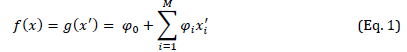
In the equation, the functions f and g represent the original model and the explanation model, respectively. The function g should be consistent with the output of the original model for the simplified form of the input x denoted as x’. The term φ0, represents the mean of the prediction values, while, φixi‘ denotes the SHAP value corresponding to the i-th feature in the example x.
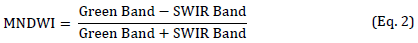
To achieve more accurate and precise identification of water bodies, the Modified Normalized Difference Water Index (MNDWI) was utilized in the study. This index ranges from -1 to +1 [18]. Unlike the NDWI, which uses the Near Infrared (NIR) band, the MNDWI is calculated using the Shortwave Infrared (SWIR) band. This modification provides more accurate results in detecting and distinguishing water bodies, as SWIR bands are strongly absorbed by water and enhance the contrast between water bodies and vegetation or structures [18][42] particularly in semi-arid environments like the Lake Tuz basin. For Landsat 8 and Landsat 9, the Green band corresponds to Band 3 (0.53–0.59 µm), while the Shortwave Infrared (SWIR) band corresponds to Band 6 (1.57–1.65 µm).
Results and Discussion
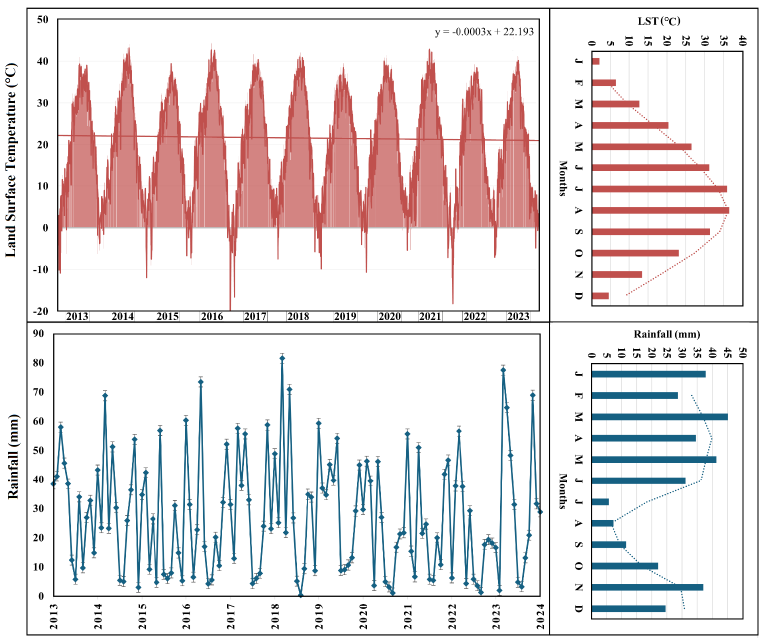
Monthly temperature and rainfall distribution and variations in the study area were illustrated (Fig. 3). While July recorded the least rainfall (average 5.69 mm), March had the highest (average 45.19 mm). Precipitation levels are fairly high in the first half of the year (January-June); a notable drop in precipitation is seen in the summer months (July and August). In the winter and fall, precipitation rises once more, peaking a second time in November. Of the years included in the research, 2019 recorded the largest quantity of rain (385.91 mm) while the least was observed in 2022 (237.71 mm). As for land surface temperature (LST), notable temperature rises in the spring months (March through May) are recoded. Temperatures peak during summer months June-August, with July (average 35.94°C) and August (average 36.47°C) recording the highest values. Temperatures drop once more in the autumn and winter, reaching their lowest in December. Recurring temperature cycle (average monthly cycle) shows summer temperatures ranging between 30 and 40 °C and winter temperatures usually below 0 °C. Particular periods along the graph show sharp temperature drops and rises that could indicate unusual climatic conditions or short-term weather events. Extreme cold weather events in winter when temperatures fall below -10°C are especially remarkable.
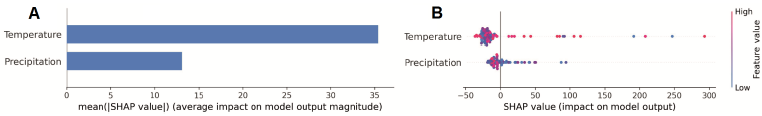
SHAP values were estimated to assist in determining which characteristics (precipitation and temperature elements) are more decisive in the decision-making process of the model (Fig. 4). The results show that temperature has more impact compared to rainfall. Consequently, the probability of experiencing a lake drought escalates as temperatures increase compared to the occurrence of lower precipitation values.
Annual spatial distribution patterns of the MNDWI analysis for Dry and Wet periods from 2013 to 2023 are shown in Figure 5. This visualization thoroughly demonstrates the temporal variations in water surfaces for both periods. Notably, ecological and environmental effects trigger an identifiable pattern of water reduction from the south and southeast toward the north. This pattern undoubtedly shows a decline in the region’s water resources and major ecological changes. Given the topography of the study area, the elevation above sea level varies from 897 to 1114 m with the northeastern section demonstrating slightly higher elevations compared to the southwestern section of the lake (Fig. 1). The lower altitude and shallower water conditions therefore explain the southern section’s initial drought impacts.
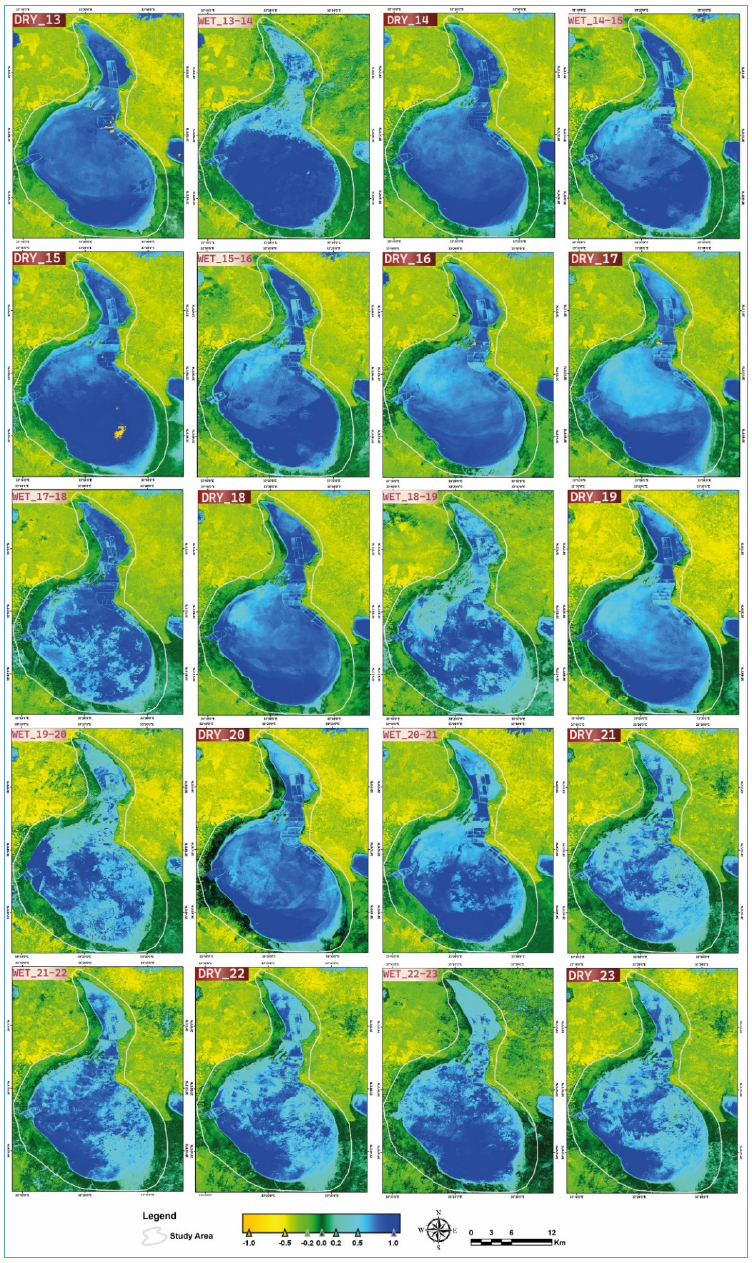
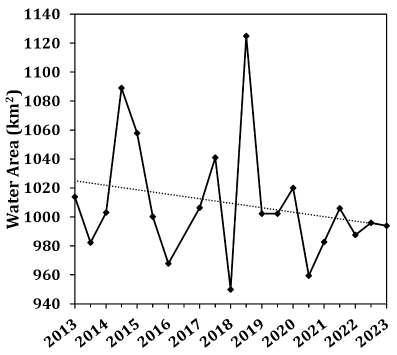
Figure 6 offers an analysis of changes in water areas over six-month intervals revealing the lake’s surface area fluctuations. The lake’s surface area decreased from 1013.82 km² in 2013 to 993.82 km² in 2023. The study shows a steady decline until 2018 when a considerable lake’s surface area expansion to 1124.82 km² during the wet season was noted. Starting in 2018 and continuing into 2013, the lake’s surface area has been steadily shrinking. The general linear trend formula to estimate the lake’s surface area was A = -3.0858Y + 7236.6, where A refers to the lake’s surface area in Km2 and Y refers to the year.
The findings of this study reveal significant temporal and spatial variations in the water levels of Lake Tuz over the ten-year period analyzed. Remote sensing analysis using MNDWI demonstrated a notable decline in water extent, particularly during the dry summer months, highlighting the lake’s vulnerability to seasonal fluctuations and long-term drying trends. MNDWI analysis was selected for this study since it provides more accurate results in identifying wetland areas such as rivers, seas, and lakes [18][42-45]. In fact, MNDWI has an enhanced ability to distinguish water bodies from surrounding land features, particularly in semi-arid environments like the Lake Tuz basin. Unlike NDWI, which utilizes the Near-Infrared (NIR) band and often misclassifies moist soil, vegetation, or saline surfaces as water, MNDWI replaces NIR with the Shortwave Infrared (SWIR) band, significantly improving water-body detection by minimizing interference from non-water surfaces [42]. This renders MNDWI particularly suitable for regions where seasonal salinity variations, sediment deposits, and exposed wetland areas can affect classification accuracy [18].
The current study found that not only temperature and precipitation, but also seasonal variations significantly affect drought conditions in Lake Tuz. Specifically, high precipitation levels in March and November have a positive impact. However, low precipitation during the summer months accompanied by intense summer heat waves increase the risk of drought, highlighting the need for greater attention to water management during this period.
Although numerous studies have examined the spatial dynamics of the lake surface area, the detailed impact of climatic factors, such as temperature and precipitation, has often been overlooked. In this study, the influence of climatic variables on lake surface changes was analyzed using SHAP analysis, providing a more comprehensive understanding of their role in water level fluctuations. This approach enhances the assessment of Lake Tuz’s water dynamics by integrating climate-driven influences. The findings of this study align with previous research, which has demonstrated a strong connection between the reduction in lake surface area and the increase in lake surface water temperature (LSWT) [46]. The observed decline in Lake Tuz’s water extent over the study period suggests that rising temperatures contribute significantly to evaporation-driven water loss, further exacerbating the lake’s shrinkage.
Conclusions
Utilizing Landsat-8 and Landsat-9 satellite photos, the GEE platform was used to track changes in water surface level in Lake Tuz. The MNDWI index clearly and accurately represented changes in the lake’s surface area over time, therefore delineating variations in the water body. Apart from stressing the significance of drought conditions, temperature, and rainfall in affecting these changes, this paper also underlines the benefits of MNDWI in efficiently identifying water-covered areas compared to conventional, labor-intensive visual interpretation techniques.
SHAP analysis, was used to evaluate the effect of climatic variables including temperature and precipitation. The findings show that while lower precipitation aggravates water loss and causes noticeable seasonal shrinkage in lake surface area, rising temperatures are the main driver of faster evaporation. Interannual precipitation changes were also found to affect short-term water level recoveries. Driven mostly by climatic factors, the study shows that Lake Tuz is progressively losing water levels. Combining climate data analysis with remote sensing technologies provides a thorough knowledge of these changes, therefore supporting the need of sustainable water resource management in the area.
References
- Habibi M, Babaeian I, Schöner W. Changing causes of drought in the Urmia Lake Basin—increasing influence of evaporation and disappearing snow cover. Water. 2021;13(22):3273. DOI
- Donchyts G, Baart F, Winsemius H, Gorelick N, Kwadijk J, Van De Giesen N. Earth’s surface water change over the past 30 years. Nat. Clim. Change. 2016;6(9):810-3. DOI
- Mohammed IN, Bolten JD, Souter NJ, Shaad K, Vollmer D. Diagnosing challenges and setting priorities for sustainable water resource management under climate change. Sci. Rep. 2022;12(1):796. DOI
- Timalsina R, Acharya S, Đurin B, Awasthi MP, Pant RR, Joshi GR, Byanju RM, Panthi KP, Joshi S, Kumar A, Thakur TK. An Assessment of Seasonal Water Quality in Phewa Lake, Nepal, by Integrating Geochemical Indices and Statistical Techniques: A Sustainable Approach. Water. 2025;17(2):238. DOI
- Çapar G. Su Kaynakları Yönetimi ve İklim Değişikliği. İklim Değişikliği Eğitim Modülleri Serisi 8. 2019.
- Pickens AH, Hansen MC, Hancher M, Stehman SV, Tyukavina A, Potapov P, Marroquin B, Sherani Z. Mapping and sampling to characterize global inland water dynamics from 1999 to 2018 with full Landsat time-series. Remote Sens. Environ. 2020;243:111792. DOI
- Sarp G, Ozcelik M. Water body extraction and change detection using time series: A case study of Lake Burdur, Turkey. J. Taibah Univ. Sci. 2017;11(3):381-91. DOI
- Yilmaz OS. Spatiotemporal statistical analysis of water area changes with climatic variables using Google Earth Engine for Lakes Region in Türkiye. Environ. Monit. Assess. 2023;195(6):735. DOI
- Deng Y, Jiang W, Tang Z, Ling Z, Wu Z. Long-term changes of open-surface water bodies in the Yangtze River basin based on the Google Earth Engine cloud platform. Remote Sens. 2019;11(19):2213. DOI
- Owusu C, Snigdha NJ, Martin MT, Kalyanapu AJ. Pygee-swtoolbox: A python jupyter notebook toolbox for interactive surface water mapping and analysis using google earth engine. Sustainability. 2022;14(5):2557. DOI
- Wulder MA, Masek JG, Cohen WB, Loveland TR, Woodcock CE. Opening the archive: How free data has enabled the science and monitoring promise of Landsat. Remote Sens. Environ. 2012;122:2-10. DOI
- Sekertekin A. A survey on global thresholding methods for mapping open water body using Sentinel-2 satellite imagery and normalized difference water index. Arch. Comput. Methods Eng. 2021;28(3):1335-47.
- Awasthi MP. Mapping and analyzing temporal variability of spectral indices in the lowland region of Far Western Nepal. Water Pract. Technol. 2023;18(11):2971-88. DOI
- Ji L, Zhang L, Wylie B. Analysis of dynamic thresholds for the normalized difference water index. Photogramm. Eng. Remote Sens. 2009;75(11):1307-17. DOI
- Gao BC. Normalized difference water index for remote sensing of vegetation liquid water from space. In Imaging spectrometry. SPIE. 1995;2480:225-36. DOI
- Abujayyab SK, Almotairi KH, Alswaitti M, Amr SS, Alkarkhi AF, Taşoğlu E, Hussein AM. Effects of meteorological parameters on surface water loss in Burdur Lake, Turkey over 34 Years Landsat Google Earth Engine time-series. Land. 2021;10(12):1301. DOI
- Chen J, Wang Y, Wang J, Zhang Y, Xu Y, Yang O, Zhang R, Wang J, Wang Z, Lu F, Hu Z. The performance of Landsat-8 and Landsat-9 data for water body extraction based on various water indices: A comparative analysis. Remote Sens. 2024;16(11):1984. DOI
- Singh KV, Setia R, Sahoo S, Prasad A, Pateriya B. Evaluation of NDWI and MNDWI for assessment of waterlogging by integrating digital elevation model and groundwater level. Geocarto Int. 2015;30(6):650-61. DOI
- Zhao X, Xia H, Pan L, Song H, Niu W, Wang R, Li R, Bian X, Guo Y, Qin Y. Drought monitoring over Yellow River basin from 2003–2019 using reconstructed MODIS land surface temperature in Google Earth Engine. Remote Sens. 2021;13(18):3748. DOI
- Zhang J, Ding J, Wu P, Tan J, Huang S, Teng D, Cao X, Wang J, Chen W. Assessing arid inland lake watershed area and vegetation response to multiple temporal scales of drought across the Ebinur Lake Watershed. Sci. Rep. 2020;10(1):1354. DOI
- Benzougagh B, Meshram SG, El Fellah B, Mastere M, Dridri A, Sadkaoui D, Mimich K, Khedher KM. Combined use of Sentinel-2 and Landsat-8 to monitor water surface area and evaluated drought risk severity using Google Earth Engine. Earth Sci. Inform. 2022;15(2):929-40. DOI
- Aroma RJ, Raimond K, Estrela VV, De Jesus MA. A coastal band spectral combination for water body extraction using Landsat 8 images. Int. J. Environ. Sci. Technol. 2024;21(2):1767-84. DOI
- Kim Y, Kim Y. Explainable heat-related mortality with random forest and SHapley Additive exPlanations (SHAP) models. Sustain. Cities Soc. 2022;79:103677. DOI
- Wang M, Li Y, Yuan H, Zhou S, Wang Y, Ikram RM, Li J. An XGBoost-SHAP approach to quantifying morphological impact on urban flooding susceptibility. Ecol. Indic. 2023;156:111137. DOI
- Wang H, Yan S, Ciais P, Wigneron JP, Liu L, Li Y, Fu Z, Ma H, Liang Z, Wei F, Wang Y. Exploring complex water stress–gross primary production relationships: Impact of climatic drivers, main effects, and interactive effects. Glob. Change Biol. 2022;28(13):4110-23. DOI
- SAYBIS. SAYBIS. 2024. Retrieved from: Link
- Dogan SS, Kocabaş A. Seasonal Gene Profiling in Tuz Lake with Regard to Biogeochemical Cycling. Kahramanmaraş Sütçü İmam Üniv. Tarım Doğa Derg. 2024;27(2):273-84. DOI
- Örmeci C, Ekercin S. Uzaktan Algilama Tekniği İle Tuz Gölünde Su Kalitesi Değişim Analizi. TMMOB Harita ve Kadastro Mühendisleri Odası 10. Türkiye Harita Bilimsel ve Teknik Kurultayı, Ankara. 2005.
- Bilgilioğlu BB. Yapay açıklıklı radar interferometre teknikleri ile Tuz Gölü dinamiklerinin analizi. Doctoral thesis. İstanbul Teknik Üniversitesi, Fen Bilimleri Enstitüsü. 2022.
- Karakus P. Investigation of Meteorological Effects on Çivril Lake, Turkey, with Sentinel-2 Data on Google Earth Engine Platform. Sustainability. 2023;15(18):13398. DOI
- Yang X, Qin Q, Yésou H, Ledauphin T, Koehl M, Grussenmeyer P, Zhu Z. Monthly estimation of the surface water extent in France at a 10-m resolution using Sentinel-2 data. Remote Sens. Environ. 2020;244:111803. DOI
- Bajaj M, Sasaki N, Tsusaka TW, Venkatappa M, Abe I, Shrestha RP. Assessing changes in mangrove forest cover and carbon stocks in the Lower Mekong Region using Google Earth Engine. Innov. Green Dev. 2024;3(3):100140. DOI
- Amindin A, Siamian N, Kariminejad N, Clague JJ, Pourghasemi HR. An integrated GEE and machine learning framework for detecting ecological stability under land use/land cover changes. Glob. Ecol. Conserv. 2024;53:e03010. DOI
- Arıkan D, Yıldız F. Land cover generation using random forest algorithm on google earth engine platform. Paper presented at the V. Internatıonal Turkic World Congress on Science and Engineering, Kyrgyz-Turkish Manas University, Kyrgyzstan. 2023.
- Aghdam FZ, Hasanlou M, Dehghanijabbarlou M. Quantifying urban air quality through multispectral satellite imagery and Google earth Engine. J. Atmos. Sol.-Terr. Phys. 2024;261:106301. DOI
- Maki̇neci̇ HB, Arıkan D. Seyfe lake seasonal drought analysis for the winter and summer periods between 2017 and 2022. Remote Sens. Appl. Soc. Environ. 2024;34:101172. DOI
- Ermida SL, Soares P, Mantas V, Göttsche FM, Trigo IF. Google earth engine open-source code for land surface temperature estimation from the landsat series. Remote Sens. 2020;12(9):1471. DOI
- Funk C, Peterson P, Landsfeld M, Pedreros D, Verdin J, Shukla S, Husak G, Rowland J, Harrison L, Hoell A, Michaelsen J. The climate hazards infrared precipitation with stations—a new environmental record for monitoring extremes. Sci. Data. 2015;2(1):1-21. DOI
- Gillies DB. Some theorems on n-person games. Princeton University. 1953.
- Hausken K, Mohr M. The value of a player in n-person games. Soc. Choice Welfare. 2001;18(3):465–83. DOI
- Aas K, Jullum M, Løland A. Explaining individual predictions when features are dependent: More accurate approximations to Shapley values. Artif. Intell. 2021;298:103502. DOI
- Xu H. Modification of normalised difference water index (NDWI) to enhance open water features in remotely sensed imagery. Int. J. Remote Sens. 2006;27(14):3025-33. DOI
- Laonamsai J, Julphunthong P, Saprathet T, Kimmany B, Ganchanasuragit T, Chomcheawchan P, Tomun N. Utilizing NDWI, MNDWI, SAVI, WRI, and AWEI for estimating erosion and deposition in Ping River in Thailand. Hydrology. 2023;10(3):70. DOI
- Kafu GY, Baidoo B, Aidoo KKY, Mihaye J, Owusu AB. Detecting changes in surface water extent of the Weija dam, Accra, Ghana using MNDWI indices from Landsat satellite imagery. Int. J. Water. 2024;16(1). DOI
- Xu H, Zhang F, Jim CY, Chan NW, Tan ML, Wei L, Lin X, Hu G, Wang S, Qiao Q. Regional variations in lake areas in China due to human and natural environmental factors since 1990. Ecol. Indic. 2025;172:113307. DOI
- Aslan NA, Koc-San Dİ. Investigation of the changes of lake surface temperatures and areas: Case study of Burdur and Egirdir Lakes, Turkey. Int. Arch. Photogramm. Remote Sens. Spat. Inf. Sci. 2021;43:299-304. DOI
Cite this article:
İspir, D. Arikan Spatiotemporal monitoring of the surface water level dynamics in Lake Tuz, Türkiye, using remote sensing and GIS. DYSONA – Applied Science, 2025;6(2): 378-388. doi: 10.30493/das.2025.506287