
Anthony C. Nlemadim 1*; Offiong E. Ikpeme 1; Martin M. Meremikwu 1; Maxwell U. Anah 1; Egorp O. Ineji 1
1, Department of Paediatrics, University of Calabar Teaching Hospital (UCTH), Calabar, Cross-River state, Nigeria
E-mail:
tonynlemas@yahoo.com
Received: 13/11/2022
Acceptance: 30/11/2022
Available Online: 02/12/2022
Published: 01/04/2023
Manuscript link
http://dx.doi.org/10.30493/DLS.2022.370107
Abstract
Background: Abnormal electrocardiogram (ECG) is common in children with sickle cell anemia (SCA). There are three levels of SCA severity, and the severe form is fatal. However, whether SCA severity level is associated with abnormal ECG is unknown.
Aim: To determine the relationship between SCA disease severity and abnormal ECG during steady-state.
Method: This cross-sectional study recruited 56 SCA patients between 4 and 17 years of age. Patients’ clinical information was obtained, and a physical examination with a full blood count was performed. These data were used to classify SCA in the subjects according to their severity as mild, moderate, or severe. 12-lead electrocardiography was performed after the physical examination.
Results: The median (interquartile) disease severity score was 4.0 (3.0 – 6.5), with a range of 1 – 19. Most subjects (78.6%) had mild disease, while 14.3% and 7.1% had moderate and severe disease, respectively. T-wave changes were the most prevalent (55.4%) ECG abnormality. None of the ECG abnormalities were significantly related to disease severity. However, prolonged QTc interval correlated negatively with disease severity (r=-0.272, p=0.043). Two or more ECG abnormalities per subject were observed in 53.6% of those with mild disease.
Conclusion: All three disease severity levels are associated with abnormal ECG patterns, especially T-wave changes. The predominance of mild disease in the investigated locality may be why prolonged QTc interval and multiple ECG abnormalities were mainly observed in them. Routine electrocardiography may be done to identify at-risk patients for further cardiac management.
Keywords: Sickle cell disease, Paediatric, Electrocardiogram, Steady-state, Disease severity
Introduction
Sickle cell anemia (SCA), a severe disease caused by a point mutation in the β-globin gene (HBB:c.20A>T) and characterized by two hemoglobin S (HbS) molecules in each erythrocyte, is the commonest hemoglobinopathy in Nigeria with a prevalence of 20 per 1,000 births [1][2]. The resultant effect of these two HbS molecules is the polymerization and subsequent sickling of the erythrocytes during stressful conditions like infections and dehydration. This leads to sickled erythrocytes’ adherence to and blocking of the vascular endothelium, resulting in tissue ischemia and painful conditions such as vaso-occlusive crises, which can be life-threatening [3][4].
The early life mortality rate among children with SCA has been estimated to be 50 – 90% [5]. Therefore, the World Health Assembly recognized SCA as a global health burden [6]. Nigeria has the largest number of SCA cases worldwide, and the number of newborns with SCA is expected to increase from 91,000 in 2010 to about 140,900 in 2050 [7]. This may worsen the Nigerian national health burden since more funds will be needed for disease treatment despite the projected increase in the future national income [7].
There are varied phenotypic expressions of SCA among affected children ranging from asymptomatic disease to multiple organ failure. These phenotypic expressions are largely influenced by geographical, environmental, nutritional, infectious, and genetic (haplotype) factors [8][9]. As a result of this conundrum, it has been difficult to predict the clinical severity of SCA despite recent efforts in haplotype mapping. Despite the clear differences in clinical features between the haplotypes, clinical variation among patients with the same haplotype exists [9].
The most common clinical feature in children with SCA is painful crises which may develop following worsened steady-state sickling-unsickling cycles of the erythrocytes by stimuli like infectious agents [3][10]. This usual asymptomatic baseline sickling-unsickling of the erythrocytes at the venular and arteriolar ends of the capillaries during steady state may be the reason for abnormal electrocardiogram (ECG) [3]. The sickling may lead to local cardiac microvascular obstruction (myocardial ischemia) which may be intra-myocardial (T-wave inversion), patchy sub-endocardial (ST depression), or severe transmural (ST elevation) [11][12]. This ischemia may be accompanied by the rise and fall of cardiac troponin T, implying myocardial injury by definition [13]. Electrocardiographic patterns like prolonged QTc interval have also been associated with mortality in SCA patients [14].
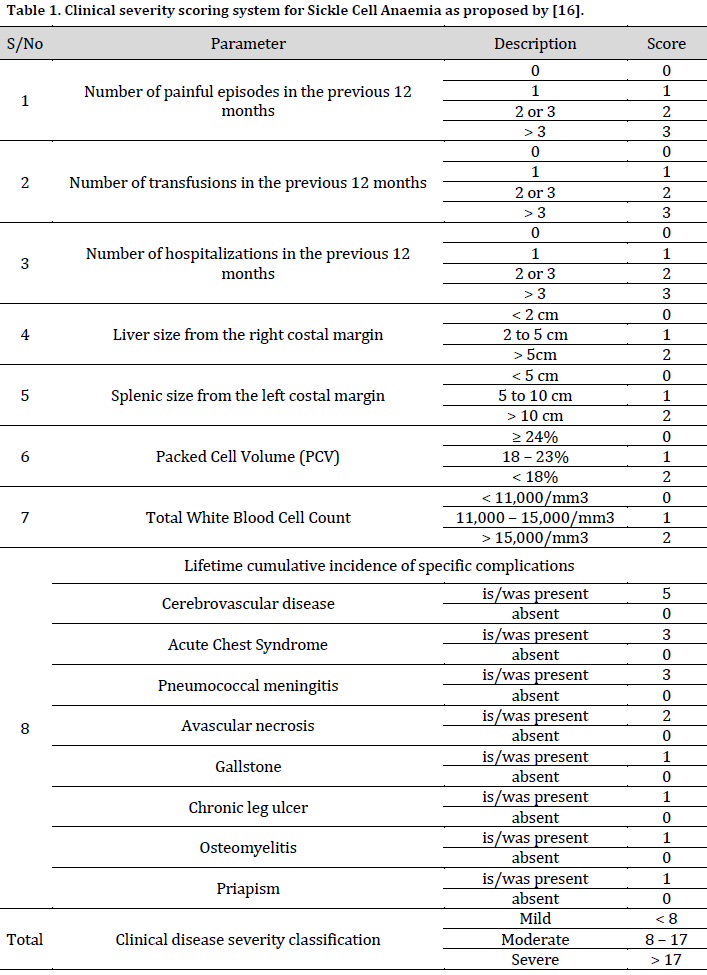
There is no existing universal system for SCA scoring or disease severity classification. Compared to the traditional use of clinical features in severity classification, the genetic-aided severity classification of SCA cases is clearer and more accurate [15]. However, efforts have been made to define and classify the clinical characteristics of SCA, especially in resource-poor regions where facilities for genetic tagging are scarce. In this context, a scoring format has been developed and validated for sickle cell disease severity classification in Nigeria following novel research in the Netherlands that utilized modern clinimetry [16][17]. This scoring format serves as a classification tool for SCA severity (mild, moderate, or severe) in children during the steady state of the disease [16].
There is a dearth of studies exploring the link between SCA severity and abnormal ECG, especially during steady state when there are essentially no symptoms. On the other hand, there are connections between some abnormal ECG patterns and mortality in SCA. Therefore, this study aimed to find the relationship between abnormal ECG parameters during steady state and disease severity of pediatric SCA.
Material and Methods
Study design and setting
This cross-sectional study was conducted in the Paediatric Haematology clinic at the University of Calabar Teaching Hospital (UCTH), Calabar, Nigeria from October 2017 to April 2018.
Participants
Patients attending UCTH with confirmed SCA cases were consecutively enrolled.
Inclusion criteria
Subjects 4 to 17 years of age and in a steady state of health were considered for this study. Steady state health was defined as when the child was not experiencing pain, had no painful episode in the previous four consecutive weeks, and had no blood transfusion during the last four consecutive months [18]. Children of 4 years and above can provide meaningful and objective self-reporting of pain when present or when it was last felt [19].
Exclusion criteria
Patients with well-known causes of ECG abnormalities such as features of renal disease, respiratory tract infection, severe malnutrition [Body Mass Index (BMI) < -3 standard deviation for age and gender] [20], fever, hypertension (≥95th percentile for age, gender, and height) [21], severe anemia (packed cell volume ≤ 15% or hemoglobin concentration ≤ 50g/L), cardiac disease, heart failure or shock were excluded from the study. Furthermore, Intake of drugs like digoxin, frusemide, captopril, or chemotherapy; presentation with any acute episodic event (crises); hypokalaemia, hyperkalemia, hypocalcemia or low glomerular filtration rate (GFR)-for-age-and-gender, or receiving chronic blood transfusion were also considered reasons for exclusion.
Data collecting
Sickle cell disease severity
Based on the scoring format [16] (Table 1), the following information was obtained from recruits: number of painful crises in the previous 12 months, number of blood transfusion during the last 12 months, previous stroke, acute chest syndrome, pneumococcal meningitis, avascular necrosis of the femur, gallstone, chronic leg ulcer, osteomyelitis or priapism and number of hospital admissions in the previous 12 months from their hospital records. Additionally, the liver and splenic sizes, packed cell volume (PCV), and total white cell count (TWBC) on physical examination were considered for scoring. Scores < 8 were graded as a mild disease; 8-17 were graded as moderate disease, while cases with scores > 17 were graded as severe.
Electrocardiography
The graphical recording of each subject’s cardiac cycle was performed with GE Marquette Hellige MAC® 1200ST ECG device (GE Medical Systems Information Technologies, Milwaukee, WI, USA). The electrodes were placed over the limbs and the anterior chest wall, with the subject lying calmly in supine position. Electrode gel was used to improve adhesion between the skin and the electrode. After a waiting period of 10 seconds to allow the polarization voltages to stabilize, the recording was initiated using the 12-lead mode. The ECGs were interpreted using Pediatric standards [22]. The criteria for defining each of the ECG findings include:
- Sinus Arrhythmia: variations in the R-R interval (heart rate) with each QRS complex preceded by a P-wave, regular PR interval, and normal P axis for age.
- Sinus tachycardia: heart rate (beats per minute) greater than the normal upper limit for the age of the child.
- Prolonged P-wave duration: P-wave greater than 0.10 seconds and it is indicative of left atrial hypertrophy
- Prolonged PR interval: refers to the status when the duration (seconds) between the beginning of the P-wave and the beginning of the QRS complex is greater than the upper limit of normal for age and heart rate. Hence, the first-degree atrioventricular block is a prolonged PR interval with an equal P-P interval. All P-waves are conducted to the ventricles.
- Prolonged QRS duration: when the interval between the beginning and end of the QRS is greater than the upper limit of normal for age.
- Prolonged QTc interval: heart-rate corrected QT interval, according to Bazett’s formula, is greater than 0.44 seconds. QT interval is the duration (seconds) from the beginning of QRS to the end of the T-wave.
- T-wave inversion: negative T-wave of at least 1mm in depth in more than two contiguous chest leads, while diphasic T-wave has a positive and negative deflection.
- Left Ventricular Hypertrophy: left axis deviation (QRS axis less than the lower limit of normal for age) plus R waves in leads I, II, III, aVL, aVF, V5, or V6 are greater than the normal upper limits for age and/or S waves in V1 or V2 greater than the normal upper limits for age.
Sinus arrhythmia and first-degree atrioventricular block are typical findings in children of the study age group [23][24]. Hence, the other ECG findings above are abnormal.
Laboratory tests
A blood sample (5 ml) was drawn from each child without a tourniquet. Two milliliters (2 mL) of blood was analyzed for full blood count using Sysmex KX-21NTM Automated Haematology analyzer (Sysmex Corporation, Kobe, Japan), which gave PCV and TWBC for each subject. Sera of the remaining 3ml of blood was analyzed for potassium, total calcium, and creatinine using ion selective electrode, cresolphthalein complex one, and modified Jaffe kinetic methods, respectively. These analyses were consecutively done as the subjects were enrolled. A total of 64 subjects were initially recruited. However, eight were excluded because of hypocalcemia. Those with normal potassium, calcium, and glomerular filtration rate (GFR) for age and gender were included.
Social class grouping
Subjects were classified according to their socioeconomic classes [25].
Ethical clearance
The required clearance and registration were obtained from the Health Research Ethical Committee of UCTH (NHREC/07/10/2012). Informed consent was also obtained from each parent/guardian of the subject. Additionally, verbal assent was obtained from those at least 7 years of age.
Statistical analysis
Data were analyzed using Statistical Package for the Social Sciences (SPSS) version 23 software. All numerical data except PCV and QTc interval had skewed distributions and were presented as the median and interquartile range (IQR). Proportions were compared using Fisher’s Exact Test. Kruskal Wallis H-test was used to compare variables with more than two groups, while One-way Analysis of Variance (ANOVA) was used in comparing PCV. Relationships between values were assessed with Spearman rank correlation. The significance level was set at <0.05.
Results
General characteristics and demographic factors
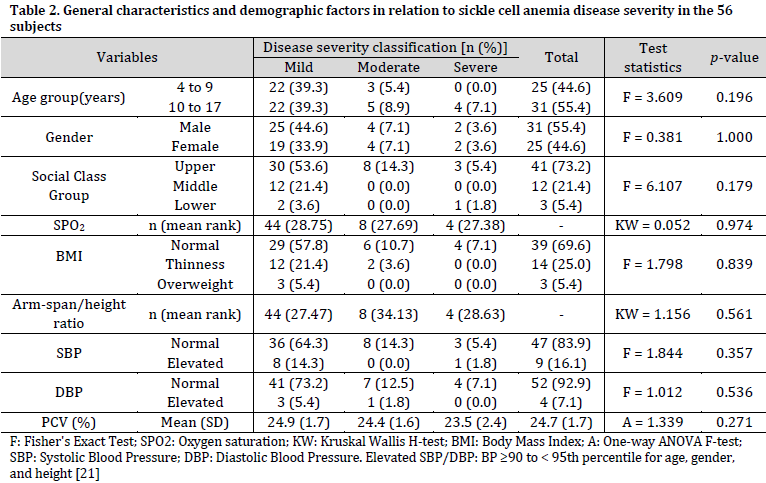
Fifty-six subjects participated in the study with a median (IQR) age of 10.0 (7.0 – 13.8) years and male to female ratio of 1.2:1. The median (IQR) oxygen saturation (SPO2) and arm-span/height ratio were 97% (95-99%) and 1.03 (1.00-1.06), respectively. Most subjects (78.6%) had mild disease, while severe disease was observed in 7.1% of subjects. The median (IQR) severity score was 4.0 (3.0-6.5), ranging from 1 to 19. Most subjects were of the upper social class (73.2%). Association analysis showed that neither demographic nor general factors were significantly associated with SCA severity (Table 2).
Electrocardiogram abnormalities
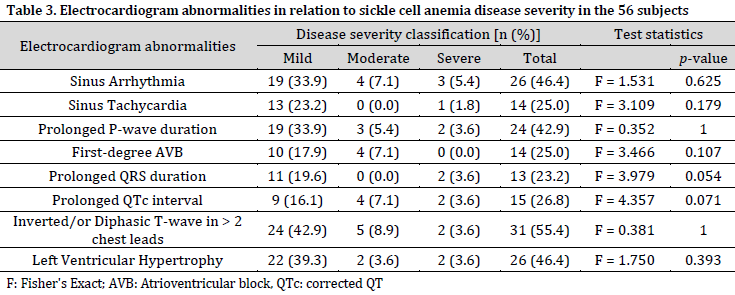
At least a third of the subjects had sinus arrhythmia, prolonged P-wave duration, T-wave changes, or left ventricular hypertrophy. The highest prevalent abnormality was T-wave changes observed in 55.4% of the subjects. On the other hand, there was no ST-segment shift or tall P-wave. No statistically significant association between any ECG abnormality and SCA severity was observed (Table 3). The mean (SD) QTc interval was 0.433 (0.02) seconds.
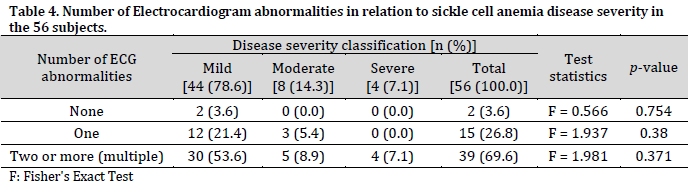
Number of ECG abnormalities
The highest number of ECG abnormalities per subject was five, observed in three subjects. These abnormalities exclude sinus arrhythmia and first-degree heart block. Fifty-four subjects had abnormal ECG, with about 70% having two or more (multiple) ECG abnormalities. It is also worth noting that all four severe SCA cases experienced multiple ECG abnormalities. However, the relationships between the number of abnormalities and SCA disease severity were not statistically significant (Table 4).
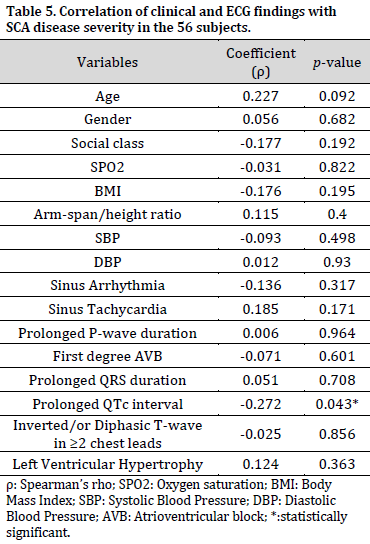
Correlations of general characteristics and ECG findings with disease severity
Prolonged QTc interval had a weak negative but statistically significant correlation with SCA disease severity. Other variables had extremely weak (0 to 0.09) to weak (0.1 to 0.29) correlations with disease severity that were not significant (Table 5).
Discussion
This study showed that mild SCA (78.6%) was more prevalent than moderate (14.3%) and severe diseases (7.1%). The relationship between the three levels of SCA disease severity and age, gender, social class, SPO2, anthropometry, blood pressure, and PCV were not significant. A similar relationship was observed between the ECG findings and SCA disease severity except for prolonged QTc interval, which showed a significant negative relationship with SCA severity. Multiple ECG abnormalities occurred in most of the subjects (69.6%).
The abnormal ECG findings observed include sinus tachycardia, prolonged P-wave duration, prolonged QRS duration, prolonged QTc interval, left ventricular hypertrophy, and T-wave changes, which were most prevalent. These abnormal ECG patterns were found across all disease severity levels and did not substantially occur in any disease severity level. However, their occurrence may be due to the background sickling-unsickling cycles of the hemoglobin S erythrocytes in the cardiac capillaries that cause ischemia-reperfusion injuries and alteration of local myocardial action potential conduction. These ECGs have also been shown to occur during steady state [13]. The current observations imply that abnormal ECG is not due to disease intensity but rather the disease itself. Therefore, severe SCA is not associated with abnormal ECG more than the other low severity levels.
A preponderance of mild disease was observed, with most cases experiencing abnormal ECG patterns. The predominance of mild disease could be due to the prevalent (86.9%) SCA Benin haplotype in Nigeria [26]. It has been shown that Benin/Senegal heterozygous haplotype is associated with lower frequencies of hospitalizations, blood transfusions, and painful episodes than other haplotypes [26]. This haplotype combination may explain the high frequency of mild disease in the current study population, since Senegal and Benin haplotypes are associated with high and intermediate fetal hemoglobin (HbF) levels [9]. The HbF resists sickling of erythrocytes, and higher levels are associated with mild disease [16]. The preponderance of mild disease in this study contrasts with findings from adults with SCA who expressed moderate disease (65%) more than the mild disease (23.3%) [27]. This may be explained by the fact that childhood is characterized by different phases of development as they grow with good adaptation to the environment and infections, unlike adulthood, which is static [28].
Interestingly, prolonged QTc interval was observed to have correlated inversely with levels of disease severity. This correlation implies that prolonged QTc interval occurred more in those with mild disease. However, the relationship between disease severity and prolonged QTc interval was weak. The QTc interval represents the propagation of action potential across the cardiac ventricles comprising depolarisation and repolarisation [22]. Sickled erythrocytes blocking of the cardiac microvasculature with resultant ischemia results in the prolongation of ST-segment, which is a component of QTc interval. This irregularity may cause refractoriness in some parts of the ventricles around which electrical activities can repeatedly pass, leading to ventricular arrhythmia [29]. Ventricular arrhythmia can cause death, and prolonged QTc intervals are associated with mortality [14]. Another typical effect of cardiac ischemia is T-wave changes, which was the predominant abnormal ECG in this study.
Age, gender, social class, anthropometry, and blood pressure did not significantly relate to levels of disease severity. This observation means that phenotypic and environmental factors may not substantially influence the rate of baseline repeated sickling of the erythrocytes and hence, clinical features of persons with a similar haplotype. This finding is similar to previous reports, which showed that gender and social class did not influence disease severity [16]. Furthermore, the weak age association with disease severity in this study was similar to the findings reported in the Netherlands [17] but contradicts another validation study done in Nigeria [17], where a strong association was found between age and SCA severity. This difference may be due to the larger sample size in the validation study (115 subjects) than that in the Netherlands (92 subjects) and this study (56 subjects).
Conclusion
Abnormal ECGs occur similarly in the three levels of SCA disease severity. However, prolonged QTc interval, which has been linked with mortality in SCA, was substantially associated with mild disease, the predominant disease severity type in the studied locality. Therefore, regular electrocardiography during the steady state is recommended in order to identify patients at risk of ventricular arrhythmia for closer cardiac-oriented management.
A larger sample size would have given more certainty to the findings of this study. Fetal hemoglobin measurement and SCA haplotype assignment can substantiate the conclusions of this study in addition to elucidating the genetic-phenotypic links in children with SCA.
Conflict of interest statement
The authors declared no conflict of interest.
Funding statement
The authors declared that no funding was received in relation to this manuscript.
Data availability statement The authors declared that all related data are included in the article.
References
| 1 | Weil PA. Molecular Genetics, Recombinant DNA & Genomic Technology. In: Harpers’s Illustrated Medical Biochemistry. 31st ed. New York, Mc Graw Hill. 2018:1079-81. |
| 2 | WHO. Sickle-cell anaemia: report by the Secretariat. World Health Organization. 2006 [cited 19 November 2022]. Link |
| 3 | Adekile AD, Adeodu OO, Adegoke SA. Haemoglobinopathies. In: Textbook of Paediatrics and Child Health in a Tropical Region. 3rd ed. Surulere: Educational Printing and Publishing. 2016:1051-63. |
| 4 | Ochocinski D, Dalal M, Black LV, Carr S, Lew J, Sullivan K, et al. Life-threatening infectious complications in sickle cell disease: a concise narrative review. Front. Pediatr. 2020;8:38. DOI |
| 5 | Grosse SD, Odame I, Atrash HK, Amendah DD, Piel FB, Williams TN. Sickle cell disease in Africa: a neglected cause of early childhood mortality. Am. J. Prev. Med. 2011;41(6):S398-S405. DOI |
| 6 | World Health Organization. Fifty-Ninth World Health Assembly. Resolutions and decisions annexes. Resolution WHA59.20. Sickle-cell anaemia. Geneva. WHO. 2006 [cited 20 November 2022] Link |
| 7 | Piel FB, Hay SI, Gupta S, Weatherall DJ, Williams TN. Global burden of sickle cell anaemia in children under five, 2010–2050: modelling based on demographics, excess mortality, and interventions. PLoS Med. 2013;10(7):e1001484. DOI |
| 8 | El-Hazmi MA. Clinical and haematological diversity of sickle cell disease in Saudi children. J. Trop. Pediatr. 1992;38(3):106-12. DOI |
| 9 | Steinberg MH. Genetic etiologies for phenotypic diversity in sickle cell anemia. Sci. World J. 2009;9:46-67. DOI |
| 10 | Meremikwu MM, Okomo U. Sickle cell disease. BMJ Clin. Evid. 2016. |
| 11 | Bode‐Thomas F, Hyacinth HI, Ogunkunle O, Omotoso A. Myocardial ischaemia in sickle cell anaemia: evaluation using a new scoring system. Ann. Trop. Paediatr. 2011;31(1):67-74. DOI |
| 12 | Loscalzo J, Antman EM. Ischaemic heart disease. In: Harrison’s Principles of Internal Medicine. 20th ed. New York: Mc Graw Hill. 2018:1850-65. |
| 13 | Nlemadim AC, Okpara HC, Anah MU, Odey FA, Meremikwu MM. Myocardial injury in patients with sickle cell anaemia and myocardial ischaemia in Calabar, Nigeria. Paediatr. Int. Child Health. 2020;40(4):231-7. DOI |
| 14 | Indik JH, Nair V, Rafikov R, Nyotowidjojo IS, Bisla J, Kansal M, et al. Associations of Prolonged QTc in Sickle Cell Disease. PloS one. 2016;11(10):e0164526. DOI |
| 15 | Steinberg MH. Predicting clinical severity in sickle cell anaemia. Br. J. Haematol. 2005;129(4):465-81. DOI |
| 16 | Adegoke SA, Kuti BP. Evaluation of clinical severity of sickle cell anemia in Nigerian children. J. Appl. Hematol. 2013;4(2):58. |
| 17 | Van Den Tweel XW, Van Der Lee JH, Heijboer H, Peters M, Fijnvandraat K. Development and validation of a pediatric severity index for sickle cell patients. Am. J. Hematol. 2010;85(10):746-51. DOI |
| 18 | Ballas SK. More definitions in sickle cell disease: steady state v base line data. Am. J. Hematol. 2012;87(3):338. DOI |
| 19 | Tomlinson D, Von Baeyer CL, Stinson JN, Sung L. A systematic review of faces scales for the self-report of pain intensity in children. Pediatrics. 2010;126(5):e1168-e98. DOI |
| 20 | WHO. Growth reference 5-19 years. BMI-for-age (5-19 years). Interpretation of cutoffs.: World Health Organization; 2017 [cited 21 June 2021]. Link |
| 21 | Sharma AK, Metzger DL, Rodd CJ. Prevalence and severity of high blood pressure among children based on the 2017 American Academy of Pediatrics Guidelines. JAMA Pediatr. 2018;172(6):557-65. DOI |
| 22 | Park MK. Electrocardiography. In: Park’s Pediatric Cardiology for Practitioners. 6th ed. Philadelphia, Elsevier saunders. 2014:40-65. |
| 23 | Park MK. Disturbances of atrioventricular conduction. In: Park’s Pediatric Cardiology for Practitioners. 6th ed. Philadelphia, Elsevier saunders. 2014:435-6. |
| 24 | Park MK. Cardiac arrhythmia. In: Park’s Pediatric Cardiology for Practitioners. 6th ed. Philadelphia, Elsevier saunders. 2014:406-9. |
| 25 | Oyedeji G. Socio-economic and cultural background of hospitalized children in Ilesa. Niger J Paediatr. 1985;12:111-7. |
| 26 | Adabale A, Makanjuola SBL, Akinbami A, Dosunmu A, Akanmu A, Javid FA, et al. Frequency of beta S globin gene haplotypes among sickle cell patients in Nigeria. Int. J. Med. Res. 2021;49(6):1-11. DOI |
| 27 | Dic-Ijiewere MO, Emorinken A, Obasohan AO, Okokhere PO, Dic-Ijiewere EO, Otumu OS. Relationship Between Disease Severity and Resting Electrocardiograms of Adults With Sickle Cell Anemia in a Tertiary Institution in Southern Nigeria. Cureus. 2021;13(5):1-11. DOI |
| 28 | Wheeler DS, Wong HR, Zingarelli B. Pediatric Sepsis–Part I: “Children are not small adults!”. Open Inflamm. J. 2011;4:4-15. DOI |
| 29 | Park MK. Rhythms originating in the ventricle. In: Park MK, editor. Park’s Pediatric Cardiology for Practitioners. 6th ed. Philadelphia, Elsevier saunders. 2014:430-3. |
Cite this article:
Nlemadim, A., Ikpeme, O., Meremikwu, M., Anah, M., Ineji, E. Steady-state electrocardiograms and disease severity of childhood sickle cell anemia in Clabar, Nigeria. DYSONA – Life Science, 2023;4(1): 1-9. doi: 10.30493/dls.2022.370107